Copyright © 2018 (Jennifer Stromer-Galley, Feifei Zhang, Jeff Hemsley, Sikana Tanupabrungsun). Licensed under the Creative Commons Attribution Non-commercial No Derivatives (by-nc-nd). Available at http://ijoc.org.
Tweeting the Attack: Predicting Gubernatorial
Candidate Attack Messaging and Its Spread
JENNIFER STROMER-GALLEY
1FEIFEI ZHANG
JEFF HEMSLEY
SIKANA TANUPABRUNGSUN
Syracuse University, USA
Political campaign scholars have been concerned about the nature and effects of negative messages. Although much research has examined attack advertisements in broadcast media, more research is needed to understand attack messaging on social media. We conducted a content analysis of campaign tweets generated by candidates who ran for governor in 2014 in the United States. We examine the variables that relate to campaign attack message posting and predict its spread. Analysis suggests challengers are more likely to attack, but incumbent-generated messages are more likely to spread. We also found that attack messages are more likely than advocacy messages to be retweeted.
Keywords: attack messages, political campaigns, retweeting, the negativity effect, Twitter
Attack or negative messaging by political candidates has been the subject of numerous studies since the 1990s.2 Several studies have content-analyzed television advertising by presidential candidates between 1960 and 1996, and most suggest a general increase in negative messaging over time (Benoit, 1999; Jamieson, Waldman, & Sherr, 2000; Johnston & Kaid, 2002; for an exception, see Geer, 2006), even though they measure negativity in different ways (Geer, 2006).
Jennifer Stromer-Galley: [email protected] Feifei Zhang: [email protected]
Jeff Hemsley: [email protected]
Sikana Tanupabrungsun: [email protected] Date submitted: 2017–08–17
1 We would like to acknowledge several people who helped us with this project, including Dr. Lauren Bryant, Dr. Nancy McCracken, and Yatish Hegde as well as Billy Ceskavich, Sagar Dubey, Michael Hutchinson, Wei Jeon, Sharon Lee, Patricia G. C. Rossini, G. Jamar Smith, and Huichuan Xia.
Scholars have examined the potential effects of negative messaging, finding that it has the potential to suppress voter turnout (Ansolabehere & Iyengar, 1995; Doherty & Adler, 2014; Mattes & Redlawsk, 2015). Scholars express concern that negative messaging contributes to the public’s general malaise toward public officials and that negativity creates the perception of deception and distraction from important national issues (Jamieson, 1992). That claim, however, is contested by others who argue that negative messages require greater evidence and that a healthy democracy requires those vying for power to challenge one another’s policy ideas, character, and fitness to govern (Geer, 2006).
Much of the research about negative campaign messaging has focused on television advertising. Campaigns have now expanded their campaign communication online (Stromer-Galley, 2014). In 2014, all but two of the major-party candidates running for governor had a Twitter account, and among those who had an account, all but two actively used it. Although only about 24% of U.S. Internet users are on Twitter (Greenwood, Perrin, & Duggan, 2016), it still serves as an important amplification channel for communication because political elites and the news media heavily use the platform, providing a functional way for candidates to spread their message among supporters on Twitter and beyond them to the mass public (Chadwick, 2013; Neuman, Guggenheim, Jang, & Bae, 2014). It is, therefore, important that scholars understand the candidate characteristics that predict campaign attack messaging on Twitter. Moreover, the affordances of Twitter allow the active spread of messages, especially virality (Nahon & Hemsley, 2013). Thus, this article also investigates the variables that factor into whether a message is retweeted.
To pursue this research, we analyzed the campaign tweets of all major-party and viable minor-party candidates, 78 in total, who ran for governor in 2014 in 36 states. We collected all the campaign tweets through Twitter’s application programming interface. The collection started September 15, 2014— when all states had completed their primaries and had shifted into the general election phase—and continued through November 7, three days after the election. We systematically content-analyzed a sample of tweets from each campaign account from the last three weeks of the campaign. We developed several categories, including analyzing each message for whether it attacked an opponent or opposing political party or advocated for the candidate’s policies or character. These categories were adopted from Jamieson, Waldman, and Sherr (2000). Using logistic regression to analyze variables predicting attack messaging and message retweeting, we found that being a challenger strongly and significantly increases the odds of attack messages when other variables are controlled for. Contrary to prior research (Evans, Cordova, & Sipole, 2014), our results suggest that candidates in competitive races and third-party candidates are less likely to attack, and Republicans are the most likely to do so. For the negativity effect, we found that the odds are much greater that attack messages will be shared on Twitter than will advocacy messages. We also found that tweets generated from a major party are more likely to be spread than tweets from third-party candidates.
Literature Review
Negativity on TV and Social Media
communication scholars such as Jamieson (1992) have documented the sometimes underhanded and deceitful ways that political candidates attack their opponents. For example, in the 1988 presidential campaign, George H. W. Bush attacked Michael Dukakis’s character and judgment as a leader by using fear appeals and tapping into subconscious racial fears in the infamous “Willie Horton” ad, among others, to sway voters.
Concern has been voiced that negative messages in broadcast media have increased over time and that they have deleterious effects on the democratic process. Scholars who examine presidential television ads over time have found an increase in negative messaging (Benoit, 1999; Fowler & Ridout, 2013; Goldstein & Freedman, 2002; Jamieson et al., 2000; Johnston & Kaid, 2002; West, 2001). The same increase has been found at the congressional level (Fowler & Ridout, 2013), although the volume of negative messages showed a modest decline in 2014 House and Senate races (Fowler & Ridout, 2015). In experiments and surveys, research suggests that television ads affect voters’ perceptions of the candidates and change voting behavior (Franz & Ridout, 2007). Some evidence suggests that negative messaging may depress voter turnout (Ansolabehere & Iyengar, 1995; Doherty & Adler, 2014; Mattes & Redlawsk, 2015), and contrastive messages may slightly increase voter turnout (Franz, Freedman, Goldstein, & Ridout, 2008). The research on the effects of negative voting is in dispute (Jackson, Mondak & Huckfeldt, 2009; Krasno & Green, 2008), with a suggestion that the timing of exposure to negative messaging is a key variable (Krupnikov, 2011). Negative messaging can also put the attacker at risk of voter backlash (Goldstein & Freedman, 2002; Theilmann & Wilhite, 1998), except when the attacker is a Black candidate and the voter views Blacks negatively (Krupnikov & Piston, 2015).
Negative campaigning may be advantageous to candidates (Lau & Pomper, 2002). Negative ads are more likely to be covered by the news media (Major & Andersen, 2016; Ridout & Smith, 2008), which amplifies a candidate’s message. Attacks can be especially helpful for challengers, because they have less to lose than incumbents. Therefore, challengers are more likely than incumbents to attack; moreover, when the race is competitive, candidates strategically find ways to exploit weaknesses in their opponents in order to gain the advantage, which likely includes attacking more (Geer, 2006).
Several variables have been shown to relate to negative messaging. In addition to the research that suggests challengers are more likely to attack, the race’s level of competitiveness seems to matter (Buell & Sigelman, 2008; Goldstein & Freedman, 2002; Hassell & Oeltjenbruns, 2016; Lau & Pomper, 2004). One study found that incumbents are generally less likely than challengers to go negative in television ads (Druckman, Kifer, & Parkin, 2009).
2014), to test the resonance of specific messages to specific target groups (Stromer-Galley, 2014), and to better understand the perspectives of the public (Bor, 2014).
A handful of studies have examined how campaigns use digital media. One study of e-mail messages by candidates running for congressional office found that open-seat candidates follow a trajectory that starts with positive messages and then moves to negative messaging as election day approaches, while candidates in competitive contests are more likely to go negative (Hassell & Oeltjenbruns, 2016). Bode et al. (2016) compared tweets with television ads in the 2010 U.S. Senate campaign. They found that ads were relatively uniform in terms of overall volume of attack, advocacy, and contrast and that tweets were predominately positive (81%). Challenger status and competitiveness were not predictors of the tone of tweets; however, more prolific tweeters were more likely to tweet negatively. A study by Bekafigo and Pingley (2017) of four gubernatorial campaigns in 2011 found that competitiveness and fundraising were significant predictors of negative tweets. A study by Evans et al. (2014) of candidates running for U.S. Senate and House seats in 2012 content-analyzed tweets and found that third-party candidates were significantly more likely than Republicans to attack and that challengers were significantly more active on Twitter and more likely to attack than incumbents. Candidates in competitive races were significantly more likely to attack. In a follow-up study examining 2014 House and Senate campaigns, Evans, Smith, Gonzales, and Strouse (2017) found that competitiveness was significantly related to negative tweeting, but there were differences between the House and Senate campaigns in terms of incumbency and attack messaging. In the House campaigns, challengers were significantly more likely to attack, and in the Senate races, there was no significant difference. The authors note that the 2014 Senate races were overall more competitive and incumbents were more challenged; thus, they probably campaigned more like challengers. In sum, in House, Senate, and gubernatorial campaigns, structural and environmental factors of campaigns, such as the degree of competitiveness and the status of the candidate (incumbent vs. challenger), seem to affect campaign discourse in noteworthy ways.
Given the research examining candidate television advertising and social media (and specifically Twitter) use, we propose the following hypotheses:
H1: Challengers are more likely than incumbents to attack on Twitter.
H2: Candidates in competitive races are more likely to attack on Twitter.
H3: Third-party candidates are more likely than Republicans and Democrats to attack on Twitter.
Because we examine attack messaging on Twitter, we should consider aspects of this communication platform. Thus, we ask:
RQ1: How does the account’s popularity (as measured by the number of followers) relate to the tone of messaging, controlling for the rate of Twitter adoption in each state?
The Negativity Effect and Retweeting
Previous studies have been concerned with the effects of messaging tone on voters. The “negativity effect” refers to the greater weight the human brain gives to negative information relative to equally positive information in various information-processing tasks (Lau, 1982, 1985, p. 119; Marcus, Neuman, & MacKuen, 2000; Soroka & McAdams, 2015). For instance, Geer and Geer (2003) suggest that memory differs when individuals are exposed to positive or attack ads and that negative messages are more likely to be recalled.
In the digital age, the centrifugal forces of the Internet promote user independence from traditional media brokers and enable new means of information diffusion (Ryan, 2010). Thus, scholars today can inquire about the spread or reach of messages in ways not possible in the earlier mass media era. For example, do individuals spread attack messages more than advocacy messages? One major area of scholarship on Twitter focuses on retweets. boyd, Golder, and Lotan (2010) suggest that retweeting is the act of diffusing a piece of information originally developed by others. As one of the affordances of Twitter, the behavior of a retweet can be used to measure individuals’ responses to a message. In our study, retweeting is employed as a measure of the public’s reaction to positive or attack campaign messages.
Based on the research on the negativity effect and retweeting, we predict the following hypothesis:
H4: Candidates’ attack messages are more likely than their advocacy messages to be retweeted on Twitter.
numbers of followings, account age, number of tweets, favorite count, and a Boolean variable indicating whether an account description is provided.
In this study, we also investigate how other factors influence retweeting behavior. Given that little research on retweeting has explicitly examined candidate messaging, we ask:
RQ2: How do factors such as incumbency, party, account popularity of a candidate, and race competitiveness relate to whether a political campaign post is spread on Twitter?
Methods
Our results are based on the analysis of campaign tweets generated during the 2014 gubernatorial election, which took place on November 4, 2014. The next section describes how we collected and sampled the data, developed the coding scheme to identify types of messages campaigns post, and used logistic regression to test our hypotheses and answer research questions.
Sample Procedures
We included all gubernatorial candidates polling at least 5% at the beginning of September 2014, when all states had completed their primaries and shifted into the general election phase. Because of this threshold of viability, our collection and analysis include six third-party candidates. Twitter accounts were found on the candidates’ campaign websites and by searching Twitter for their names. This process yielded a data set of 78 gubernatorial candidate accounts in 36 states, although only 74 of them posted campaign messages on Twitter. We used an open-source tool kit to collect tweets (Hemsley, Ceskavich, & Tanupabrungsun, 2014). Using the Twitter handles and follow parameters of the Twitter streaming application programming interface, we collected 35,639 tweets posted by campaigns between September 15 and November 7, 2014. We selected this period of the campaign because it is when attack messages are most likely (Damore, 2002). The data we collected included tweets posted by the candidates, the number of followers each candidate had at the time of each post, and the number of retweets of each tweet.
The total number of tweets generated by the 74 gubernatorial candidates varied dramatically, from 14 to 3,654 in the collection period. To evaluate several dimensions of campaign tweets, we sampled from the population of messages, as previous studies have done. To ensure our sample included campaign tweets from every candidate, we included all tweets from candidates who posted fewer than 150 tweets; for each candidate with more than 150 tweets, we randomly sampled 19 tweets for each week. For this article, we focus on the last three weeks of the campaign, from October 19 through November 7, because this is the final period leading up to the election and includes the day of the election as well as the three days after the election. Campaigning is at its most active during this period. This focused data set includes 3,607 tweets, 10% of the total collected.
(www.realclearpolitics.com) and cross-checked with The Cook Political Report (www.cookpolitical.com). The number of public Twitter accounts in the candidate’s state was also included (M = 50,150, SD = 53,921.83), which ranged widely from a minimum of 2,606 to a maximum of 272,000. The data were retrieved from the U.S. Census (www.census.gov). We also included the number of followers of each candidate (M = 18,470, SD = 135,630), which also ranged widely from a minimum of 148 to a maximum of 1,046,000. Thus, each row of our data set includes the sender name, tweet text, and fields for party affiliation (Republican, Democrat, third party), incumbency status (incumbent/challenger), competitiveness (likely/lean/toss-up), Twitter adoption in each state, and number of followers.
Content Analysis
We developed a codebook to categorize tweets through deductive and inductive analysis of Twitter messages generated by the campaigns. We followed the methods of category development for systematic content analysis offered by Krippendorff (2003). We were informed by Jamieson et al. (2000) and their analysis of candidate messages in television advertisements in considering the types of messages candidates are likely to generate via Twitter, especially around persuasive messages. We developed inductive categories around call-to-action and informative tweets. Our final codebook identifies campaign tweets in six main categories: persuasive messages, calls to action, informative messages (messages that essentially declare a state of affairs but do not fall into any of the other categories), conversational messages, ceremonial messages, and not English.3
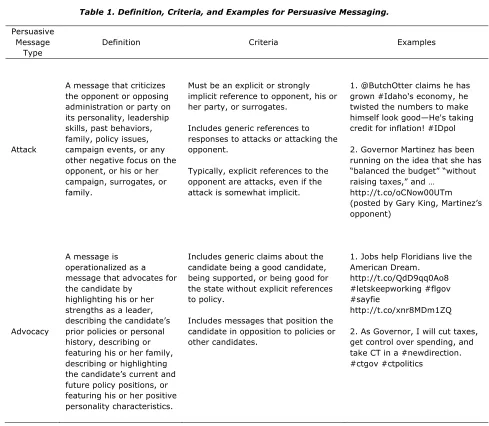
In this study, we focus only on persuasive messages. We operationalize these as any message that is about the candidate or his or her opponent that focuses on policy and issues or character and personality, including policy messages around voting and standing in public opinion polls. They also include messages from incumbents about events happening in the state. We defined two subcategories under persuasive messages: attack messaging and advocacy messaging. An attack message is operationalized as a message that criticizes the opponent or opposing administration or party on its personality, leadership skills, past behaviors, family, policy issues, campaign events, or any other negative focus on the opponent, or his or her campaign, surrogates, or family. An advocacy message is operationalized as a message that advocates for the candidate, highlighting his or her strengths as a leader, describing the candidate’s prior policies or personal history, describing or featuring his or her family, describing or highlighting the candidate’s current and future policy positions, or featuring his or her positive personality characteristics. This operationalization is similar to the ways that other studies have differentiated positive and negative messages (e.g., Bekafigo & Pingley, 2017; Evans et al., 2014, 2017). See Table 1 for a summary of the criteria for and examples of persuasive messaging.
3 For a more detailed description of the categories, see Illuminating 2016 (http://illuminating.ischool
Table 1. Definition, Criteria, and Examples for Persuasive Messaging.
Persuasive Message
Type
Definition Criteria Examples
Attack
A message that criticizes the opponent or opposing administration or party on its personality, leadership skills, past behaviors, family, policy issues, campaign events, or any other negative focus on the opponent, or his or her campaign, surrogates, or family.
Must be an explicit or strongly implicit reference to opponent, his or her party, or surrogates.
Includes generic references to responses to attacks or attacking the opponent.
Typically, explicit references to the opponent are attacks, even if the attack is somewhat implicit.
1. @ButchOtter claims he has grown #Idaho's economy, he twisted the numbers to make himself look good—He's taking credit for inflation! #IDpol 2. Governor Martinez has been running on the idea that she has “balanced the budget” “without raising taxes,” and …
http://t.co/oCNow00UTm (posted by Gary King, Martinez’s opponent)
Advocacy
A message is operationalized as a message that advocates for the candidate by
highlighting his or her strengths as a leader, describing the candidate’s prior policies or personal history, describing or featuring his or her family, describing or highlighting the candidate’s current and future policy positions, or featuring his or her positive personality characteristics.
Includes generic claims about the candidate being a good candidate, being supported, or being good for the state without explicit references to policy.
Includes messages that position the candidate in opposition to policies or other candidates.
1. Jobs help Floridians live the American Dream.
http://t.co/QdD9qq0Ao8 #letskeepworking #flgov #sayfie
http://t.co/xnr8MDm1ZQ 2. As Governor, I will cut taxes, get control over spending, and take CT in a #newdirection. #ctgov #ctpolitics
message was persuasive or another type and 0.77 agreement on persuasive subcategories using Krippendorff’s alpha. According to Lombard, Snyder-Duch, and Bracken (2002), for the coding of a variable to be considered reliable, Krippendorff’s alpha must be 0.70 or higher. Therefore, our intercoder reliability suggests good validity and reliability of the assigned categories in the data set.
After achieving satisfactory intercoder reliability, we asked coders to code the sample data independently. This yielded 1,197 persuasive messages (33.7% of the focused data set), with 401 attack (33.5% of persuasive messages data) and 796 advocacy (66.5% of persuasive messages data). Candidates generated many more advocacy than attack messages. We used this final data set of persuasive tweets to test the hypotheses and answer our research questions.
[image:9.612.158.460.380.578.2]Figure 1 presents the distribution of the number of persuasive tweets sent by candidates (first row) and the number of candidates by party in the data set (second row), all grouped by incumbency status. The data contain tweets from 67 candidates: 32 Republicans, 29 Democrats, and six third-party candidates (Libertarian, Independent and Green Party). The first row shows that for incumbents, the tweet distribution is similar, and for challengers, the median number of tweets is higher for Democrats than it is for incumbents or third-party candidates. The distribution is much larger for third-party candidates. The figure also shows the total number of tweets sent by each group. It should be noted that the outlier in the data was Tom Corbett, an incumbent Republican. The bottom row shows the number of candidates in each grouping.
Logistic Regression Analysis
We test our hypotheses and answer our research questions using logistic regression. This type of modeling allows us to test relationships between various factors and discrete phenomena. The discrete phenomena we are interested in are whether a tweet is an attack (Model 1) and whether the tweet is retweeted (Model 2).
The requirements of logit models are: (1) the dependent variable is coded as 0 or 1, where 1 is the desired outcome; (2) larger sample sizes, with a minimum of 10 observations per variable, though 30 is often recommended for stable solutions; (3) independent variables that are not highly correlated; and (4) models should not be over- or underfitted. This means that only theoretically meaningful variables are included.
We report and interpret the results of variable coefficients for both models. The reported coefficients of a logit model “show the change in the predicted logged odds of experiencing an event” (Pampel, 2000, p. 19). While we report the model coefficients and their confidence intervals, we also report and interpret the more easily understood percentage change in odds for a unit increase in the coefficient (Pampel, 2000). We verified that the variance inflation factor values for the independent variables for both models were all under 4, which validates the model assumption that the independent variables are not highly correlated (Faraway, 2005). For model validation, we use a holdout test method, where we use 60% of the data to build the models and then use the models to predict the results of the remaining 40%. As is typical, we report the resulting F1 scores, a weighted average of two measures: precision and recall. Precision measures the correctness of the classification (e.g., messages predicted as attack are indeed attack as per the training data), and recall measures the model’s ability to include all relevant observations (e.g., all attack messages in the training data are classified as attack). An F1 score of 1 represents perfect precision and recall. An F1 score of 0 indicates no correct classifications and no real observations were included. We include control variables for the retweet model, as suggested in recent literature (Hemsley, Tanupabrungsun, & Semaan, 2017). Two models are shown below:
Model 1: ATTACK = β0 + β1CHALLENGER + β2LIKELY + β3LEANS + β4TOSSUP + β5DEMOCRAT + β6THIRD + β7STATE_TWEETERS + β8FOLLOWERS + ɛ
Model 2: RT = β0 + β1ADVOCACY + β3CHALLENGER + β5DEMOCRAT + β6THIRD +
β7Log10(STATE_TWEETERS) + β7Log10(FOLLOWERS) + β2LIKELY + β2LEANS + β4TOSSUP + β7MENTIONS + β7URLS + ɛ
The variables are defined as follows:
Attack: Dichotomous dependent variable for Model 1 equals 1 if the message is an attack and 0 if it is an advocacy message.
Advocacy: Dichotomous variables 1 if the persuasive message is of type advocacy and 0 otherwise. In model 2, attack is the base state with which this variable is compared.
Challenger: Dichotomous variable is 1 if the tweet came from a challenger and 0 if the tweet came from an incumbent.
Lean, Likely, Tossup: All dichotomous variables. We used The Cook Political Report (“2014 Governor Race Ratings,” 2014) to categorize the competitiveness of each race. We identify 12 solid, 3 lean, 8 likely, and 10 toss-up states. Each variable uses solid as the base state, which means that if the race was categorized as being solidly Republican (or Democrat), all three variables are 0, but if the race is a toss-up, then toss-up is 1 and the others 0.
Democrat: Dichotomous variable is1 if the tweet is from a Democratic Party candidate. Republican is the base case with which this variable is compared.
Third: Dichotomous variable is1 if the tweet is from a Libertarian, Independent, or Green Party candidate; Republican is the base case.
State_Tweeters: This control is a continuous variable that represents the number of Twitter accounts in the state of the candidate who posted the tweet. Although this variable is highly skewed, logistic models do not assume a normal distribution, and thus transformation is not required. However, in developing the models, an F test (Faraway, 2005) showed that for Model 2, using logarithmic transformation significantly improved the models’ performance, which we did for this model.
Followers: This control is a continuous variable of the number of followers the candidate had at the time he or she posted the tweet. This variable is also highly skewed, but only transformed when it significantly improves the model.
Mentions, URLs: Dichotomous variables is1 if an @mention or URL is present in the tweet. The presence of hashtags was also tested, but it was not significant and its inclusion did not improve model performance so it was excluded from the models.
We added structural variables because we recognize that context matters (Rossini et al., in press), such as the amount candidates raised through fundraising given that it can be another predictor variable of attack messaging (Bekafigo & Pingley, 2017).4 We initially included fundraising in both models, but it was not significant in any of them, it did not change the significance or direction of any of the variables, and the holdout F1 scores were lower with a fundraising variable present. We also tried various ways to control for a candidate’s retweetability. Using the average number of retweets each candidate received in our data set was significant in the attack model, though including it did not change the significance or direction of any of the other variables, and the holdout F1 scores were lower for the model with the variable than for the model without it. After careful consideration, we opted not to include these two variables in the models.
Results
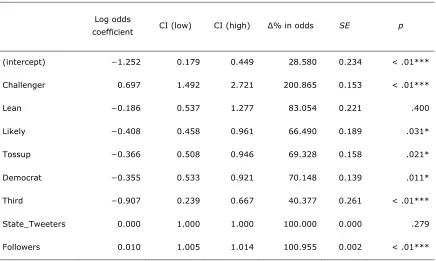
[image:12.612.93.529.277.538.2]For Model 1, with attack as the dependent variable, we first tested the predictive power of our independent variables. Using 60% of the data to build the model (n = 719), we achieve an F1 score of 84% and use the model to predict the remaining 40%. This indicates that the independent variables are capable of predicting attack messages. Thus, we rebuilt the model using the whole data set. The chi-square likelihood ratio test returns a test statistic of 64.49 (df = 8, p < 0.01), indicating that the model fits the data significantly better than the null model. Table 2 presents the findings of Model 1.
Table 2. Model 1: Logistic Regression for Examining Variables Relevant With Attack Messaging (Yes = 1, No = 0).
Log odds
coefficient CI (low) CI (high) Δ% in odds SE p
(intercept) −1.252 0.179 0.449 28.580 0.234 < .01***
Challenger 0.697 1.492 2.721 200.865 0.153 < .01***
Lean −0.186 0.537 1.277 83.054 0.221 .400
Likely −0.408 0.458 0.961 66.490 0.189 .031*
Tossup −0.366 0.508 0.946 69.328 0.158 .021*
Democrat −0.355 0.533 0.921 70.148 0.139 .011*
Third −0.907 0.239 0.667 40.377 0.261 < .01***
State_Tweeters 0.000 1.000 1.000 100.000 0.000 .279
Followers 0.010 1.005 1.014 100.955 0.002 < .01***
Note. CI = confidence interval. * p < .05. *** p < .001.
70% when posted from a Democrat (β = −0.372, p < .01) and decrease by about 26% for a third-party candidate (β = −1.336, p < .01). Therefore, H3 is rejected, because the predicted relationship is in the opposite direction for third-party candidates. Because of the small number of candidates, however, the results should be viewed as exploratory.
In examining control variables related to the Twitter platform, the number of followers that a candidate has is positively related to posting attack tweets. Although the effect for each additional follower is small, the odds of candidates posting an attack tweet increases the more followers they have (β = 0.01, p < .01). The control variable for the number of Twitter users in the state is not a significant predictor of attack tweets, however.
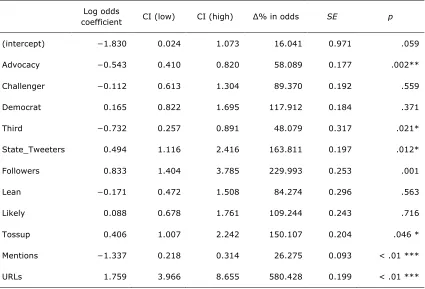
[image:13.612.100.525.351.640.2]For the second model, 60% of the data (n = 719) gave an F1 score of 81.3%, which suggests that the independent variables are capable of predicting messages’ retweetability. Thus, we rebuilt the model using the whole data set. The chi-square likelihood ratio test returns a test statistic of 657.06 (df = 11, p < .01), indicating that the model fits the data significantly better than the null model. Table 3 presents the findings of Model 2.
Table 3. Model 2: Logistic Regression for Examining Variables Relevant With Retweeting (Yes = 1, No = 0).
Log odds
coefficient CI (low) CI (high) Δ% in odds SE p
(intercept) −1.830 0.024 1.073 16.041 0.971 .059
Advocacy −0.543 0.410 0.820 58.089 0.177 .002**
Challenger −0.112 0.613 1.304 89.370 0.192 .559
Democrat 0.165 0.822 1.695 117.912 0.184 .371
Third −0.732 0.257 0.891 48.079 0.317 .021*
State_Tweeters 0.494 1.116 2.416 163.811 0.197 .012*
Followers 0.833 1.404 3.785 229.993 0.253 .001
Lean −0.171 0.472 1.508 84.274 0.296 .563
Likely 0.088 0.678 1.761 109.244 0.243 .716
Tossup 0.406 1.007 2.242 150.107 0.204 .046 *
Mentions −1.337 0.218 0.314 26.275 0.093 < .01 ***
URLs 1.759 3.966 8.655 580.428 0.199 < .01 ***
Considering message types, the odds of a retweeted advocacy message was 58% less than attack messages (β = −0.543, p = .002). Therefore, H4, that attack messages posted on Twitter by candidates are more likely than advocacy messages to be spread by the public, is supported. The variables for incumbency status and for Democrats were not significant. Although there appears to be no difference between the retweets of Democrats’ and Republicans’ messages, the odds of a retweet drop by about 48% when posted by a third-party candidate (β = −0.732, p = .021). With competitiveness, candidates in races categorized as likely and lean are not significantly different than candidates in solid races, but in toss-up races, the odds of a tweet being retweeted increase by 150% (β = 0.406, p = .046). As expected, the four control variables are all significant, though it is a surprise that the presence of @mentions reduces the odds of a retweet by 26% (β = −1.337, p < .01), because previous work has found a positive relationship (Hemsley et al., 2017).
Discussion
Political scholars have long been concerned about the nature and effect of negative messages during political campaigns. Studies have examined negative ads in broadcast media and their effects on the electorate. As political communication has expanded to include online channels and political candidates have increasingly used social media applications to adapt their campaign strategies to the changing communication landscape (Stromer-Galley, 2014), it is important to understand politicians’ attacking behavior on social media. This study investigates the variables that are related to attacking behaviors and their spread on Twitter during the final campaign period leading up to the 2014 gubernatorial election.
We find that challengers are more likely than incumbents to attack on Twitter in governors’ races (H1), which comports with prior studies (Bekafigo & Pingley, 2017; Druckman et al., 2009; Evans et al., 2014). As campaigns have adapted digital media as part of their communication repertoire, it seems they have adapted the same strategies on Twitter. Lau and Pomper (2002) demonstrate that politicians engage in negative campaigning on television because they believe negative messages can help them win the election, while incumbents are risk-averse. They also argue that negative campaigning can be more beneficial for challengers if it helps convey the impression that they are strong and have the capacity to be a leader. Given that campaigns use Twitter to shape public perceptions of key events during the campaign (Kreiss, 2016; Stromer-Galley, 2014), for challengers that construction may focus more on negatively characterizing opponents than on positively characterizing their own candidacy.
In line with previous research, this study found partisan differences in terms of attacks, but not in the same direction as hypothesized in H3. Republican candidates for governor are more likely than Democrat and third-party candidates to attack, with third-party candidates attacking the least. The difference between our conclusions and those of Evans et al. (2014) about third-party candidates likely stems from the different sampling and inclusion strategies of the two studies. Our findings suggest that the strategies that viable third-party candidates deploy are not shaped by the same structural and contextual factors that shape major-party candidates. It may be that they are outsiders who are working hard to define their positions and build name recognition. Our results also run counter to Skaperdas and Grofman’s (1995) model of federal House races, which predicts party candidates will attack their opponents. In our study, third-party candidates were more likely to be known political insiders or to run in the primaries, be defeated, and then form third-party candidacies. The number of viable third-party candidates in the 2014 gubernatorial election cycle was small; thus, individual differences in campaign style and other factors make it challenging to detect patterns, if there are any, that explain third-party candidates’ campaign styles. More attention is needed to examine other factors, such as the amount of campaign funding and the climate of campaigning, that might further drive different strategic choices among the political parties, especially third-party candidates.
We also looked at whether variables related to the Twitter platform help predict campaign attacking behaviors (RQ1). We find that the number of followers a candidate has is positively related to attack tweets. Barberá (2015) suggests that the followers of candidates might already be supporters. When candidates consider that they have many more followers than other candidates, they may choose to take some risks given perceptions of a favorable audience regardless of other structural and contextual variables, such as competitiveness, incumbency status, and party.
Relatedly, and with regard to the negativity effect, our results suggest that attack messages are more likely than advocacy messages to be spread by the public on Twitter (H4). This result is in keeping with other studies that have examined the spread of nonpolitical Twitter messages. Petrovic, Osborne, and Lavrenko (2011) found that tweets on novel topics are significantly more likely to be retweeted. Stieglitz and Dang-Xuan (2014) found that tweets with negative sentiment are more likely to be retweeted. Similar investigations have been conducted in other contexts as well. Our research contributes to the theoretical framework building on the negativity effect in political campaigns by advancing understanding of individuals’ reactions to campaign messages and campaign information diffusion.
Our examination of variables that predict message retweeting (RQ2) finds that incumbent-generated messages are no more likely than challenger-incumbent-generated messages to be retweeted when other variables are controlled. This suggests the playing field on Twitter does not advantage incumbents over challengers. Thus, Twitter may offer a way for campaigns to drive an agenda and counter the inequalities that Farnsworth and Lichter (2007) identify in terms of news coverage. Campaigns may see Twitter as offering a new way to gain advantage in a system where the already-elected are more likely to get reelected.
Results suggest partisan differences in terms of message spread. We found no retweeting differences between Democrats and Republicans; however, third-party candidates’ messages are less likely to be spread, even when controlling for account popularity (as measured by number of Twitter account followers). Farnsworth and Lichter (2007) suggest that third-party candidates receive substantially less TV news coverage than major-party candidates. This principle may extend to social media, even though the Internet promotes user independence from traditional media brokers (Ryan, 2010).
The number of followers candidates have is significantly related to having their messages retweeted—a finding that aligns with prior work on information diffusion that suggests that followership is an important variable on retweeting (Uysal & Croft, 2011; Zaman et al., 2010). Followers amplify a campaign message, which may feed into all campaigns’ desire to use the platform for strategic purposes, regardless of incumbency status.
Finally, we initially included a variable related to fundraising levels by each candidate, but we removed this variable when it had no predictive value and reduced the explanatory power of the model. It is a noteworthy result that fundraising totals, which might serve as a proxy for a campaign’s size and level of professionalism, do not predict message spread. The potential implication is that even campaigns with a great deal of money are no more able to effectively spread their messages than a poorly funded candidate. More research is needed.
Conclusion
Political communication scholars have long raised concerns about the level of negativity and attack in election campaigns. The concerns are backed by research that suggests negative messaging can suppress voter turnout and contribute to greater cynicism in the electoral process. Because social media such as Twitter create an amplification of candidate messages that can be shared broadly within the platform and beyond it to other news outlets, research is needed to understand the extent to which political candidates are going on the attack and the public’s reaction to politicians’ attack and advocacy campaign messages. Our analysis of campaign tweets generated from gubernatorial candidates during the final weeks leading up to the 2014 election finds that challengers are more likely to attack on Twitter. Compared with the two major parties, third-party candidates attacked the least, and their messages were less likely to be spread. One platform-relevant variable—the number of followers a candidate has—is negatively related to a candidate producing attack tweets. In terms of messaging tone, attack messages are more likely than advocacy messages to be spread by the public. These findings shed light on the current attacking behavior of candidates and advance collective understanding of the negativity effect on social media. The practices of political elites, the news media, and public are in flux as technical affordances and user demographics shift. Thus, our work also lays the groundwork for future comparative work.
References
Ansolabehere, S., & Iyengar, S. (1995). Going negative: How attack ads shrink and polarize the electorate. New York, NY: Free Press.
Barberá, P. (2015). Birds of the same feather tweet together: Bayesian ideal point estimation using Twitter data. Political Analysis, 23(1), 76–91. doi.10.1093/pan/mpu011
Bekafigo, M., & Pingley, A. C. (2017). Do campaigns “go negative” on Twitter? In Y. Ibrahim (Ed.), Politics, protest, and empowerment in digital spaces (pp. 178–192). Hershey, PA: IGI-Global.
Benoit, W. L. (1999). Seeing spots: A functional analysis of presidential television advertisements, 1952– 1996. Santa Barbara, CA: Greenwood.
Bode, L., Lassen, D., Kim, Y. M., Shah, D., Fowler, E., Ridout, T., & Franz, M. (2016). Coherent
campaigns? Campaign broadcast and social messaging. Online Information Review, 40(5), 580– 594. doi:10.1108/OIR-11-2015-0348
Bor, S. E. (2014). Using social network sites to improve communication between political campaigns and citizens in the 2012 election. American Behavioral Scientist, 58(8), 1195–1213.
boyd, d., Golder, S., & Lotan, G. (2010). Tweet, tweet, retweet: Conversational aspects of retweeting on Twitter. In 2010 43rd Hawaii International Conference on System Sciences (pp. 1–10). New York, NY: IEEE. doi:10.1109/HICSS.2010.412
Buell, E. H., & Sigelman, L. (2008). Attack politics: Negativity in presidential campaigns since 1960. Lawrence, KS: University Press of Kansas.
Chadwick, A. (2013). The hybrid media system: Politics and power. New York, NY: Oxford University Press.
Damore, D. (2002). Candidate strategy and the decision to go negative. Political Research Quarterly, 55(3), 669–685. doi:10.1177/106591290205500309
Doherty, D., & Adler, E. S. (2014). The persuasive effects of partisan campaign mailers. Political Research Quarterly, 67(3), 562–573. doi:10.1177/1065912914535987
Druckman, J. N., Kifer, M. J., & Parkin, M. (2009). Campaign communications in U.S. congressional elections. American Political Science Review, 103(3), 343–366.
doi:10.1017/S0003055409990037
Evans, H. K., Cordova, V., & Sipole, S. (2014). Twitter style: An analysis of how house candidates used Twitter in their 2012 campaigns. PS: Political Science and Politics, 47(2), 454–462.
doi:10.1017/S1049096514000389
Evans, H. K., Smith, S., Gonzales, A., & Strouse, K. (2017). Mudslinging on Twitter during the 2014 election. Social Media and Society, 3(2), 1–9. doi:10.1177/2056305117704408
Faraway, J. J. (2005). Extending the linear model with R: Generalized linear, mixed effects and nonparametric regression models. Boca Raton, FL: Chapman and Hall/CRC.
Farnsworth, S. J., & Lichter, S. R. (2007). The nightly news nightmare: Television’s coverage of U.S. presidential elections, 1988–2004. Lanham, MD: Rowman & Littlefield.
Fowler, E., & Ridout, T. (2013). Negative, angry, and ubiquitous: Political advertising in 2012. The Forum, 10(4), 51–61. doi:10.1515/forum-2013-0004
Fowler, E., & Ridout, T. (2015). Political advertising in 2014: The year of the outside group. The Forum, 12(4), 663–684. doi:10.1515/for-2014-5030
Franz, M., & Ridout, T. (2007). Does political advertising persuade? Political Behavior, 29(4), 465–491. doi:10.1007/s11109-007-9032-y
Geer, J. G. (2006). In defense of negativity: Attack ads in presidential campaigns. Chicago, IL: University of Chicago Press.
Geer, J. G., & Geer, J. H. (2003). Remembering attack ads: An experimental investigation of radio. Political Behavior, 25(1), 69–95. doi:10.1023/A:1022904428357
Goldstein, K., & Freedman, P. (2002). Lessons learned: Campaign advertising in the 2000 elections. Political Communication, 19(1), 5–28. doi:10.1080/105846002317246461
Greenwood, S., Perrin, A., & Duggan, M. (2016). Social media update 2016. Washington, DC: Pew Research Center. Retrieved from http://www.pewinternet.org/2016/11/11/social-media-update-2016/
Hassell, H. J., & Oeltjenbruns, K. R. (2016). When to attack: The trajectory of congressional campaign negativity. American Politics Research, 44(2), 222–246. doi:10.1177/1532673X15589613
Hemsley, J., Ceskavich, B., & Tanupabrungsun, S. (2014). STACK (Version 1.0). Syracuse University, School of Information Studies. doi:10.5281/zenodo.12388
Hemsley, J., Tanupabrungsun, S., & Semaan, B. (2017). Call to retweet: Negotiated diffusion of strategic political messages. In Proceedings of the 8th International Conference on Social Media and Society (article 9). New York, NY: ACM. doi:10.1145/3097286.3097295
Jackson, R., Mondak, J., & Huckfeldt, R. (2009). Examining the possible corrosive impact of negative advertising on citizens’ attitudes toward politics. Political Research Quarterly, 62(1), 55–69. doi:10.1177/1065912908317031
Jamieson, K. H. (1992). Dirty politics. Deception, distraction, and democracy. New York, NY: Oxford University Press.
Jamieson, K. H., Waldman, P., & Sherr, S. (2000). Eliminate the negative? Defining and refining categories of analysis for political advertisements. In J. Thurber, C. Nelson, & D. Dulio (Eds.), Crowded airwaves (pp. 44–64). Washington, DC: Brookings Institution Press.
Johnston, A., & Kaid, L. L. (2002). Image ads and issue ads in U.S. presidential advertising: Using videostyle to explore stylistic differences in televised political ads from 1952–2000. Journal of Communication, 52(2), 281–300. doi:10.1093/joc/52.2.281
Kreiss, D. (2016). Seizing the moment: The presidential campaigns’ use of Twitter during the 2012 electoral cycle. New Media & Society, 18(8), 1473–1490. doi:10.1177/1461444814562445
Krippendorff, K. H. (2003). Content analysis: An introduction to its methodology (2nd ed.). Thousand Oaks, CA: SAGE Publications.
Krupnikov, Y. (2011). When does negativity demobilize? Tracing the conditional effect of negative campaigning on voter turnout. American Journal of Political Science, 55(4), 797–813. doi:10.1111/j.1540-5907.2011.00522.x
Krupnikov, Y., & Piston, S. (2015). Accentuating the negative: Candidate race and campaign strategy. Political Communication, 32(1), 152–173. doi:10.1080/10584609.2014.914612
Kwak, H., Lee, C., Park, H., & Moon, S. (2010). What is Twitter, a social network or a news media? In Proceedings of the 19th International Conference on the World Wide Web (pp. 591–600). New York, NY: ACM. doi:10.1145/1772690.1772751
Lau, R. R. (1982). Negativity in political perception. Political Behavior, 4(4), 353–377. doi:10.1007/BF00986969
Lau, R. R. (1985). Two explanations for negativity effects in political behavior. American Journal of Political Science, 29(1), 119–138.
Lau, R. R., & Pomper, G. M. (2002). Effectiveness of negative campaigning in U.S. Senate elections. American Journal of Political Science, 46(1), 47–66.
Lau, R. R., & Pomper, G. M. (2004). Negative campaigning: An analysis of U.S. Senate elections. Lanham, MD: Rowman & Littlefield.
Lombard, M., Snyder-Duch, J., & Bracken, C. C. (2002). Content analysis in mass communication: Assessment and reporting of intercoder reliability. Human Communication Research, 28(4), 587– 604. doi:10.1093/hcr/28.4.587
Lovett, M., & Peress, M. (2010). Targeting political advertising on television. Rochester, NY: University of Rochester Press.
Major, M., & Andersen, D. (2016). Swift boating reconsidered: News coverage of negative presidential ads. Presidential Studies Quarterly, 46(4), 891–910. doi:10.1111/psq.12324
Mattes, K., & Redlawsk, D. P. (2015). The positive case for negative campaigning. Chicago, IL: University of Chicago Press.
Nahon, K., & Hemsley, J. (2013). Going viral. New York, NY: Polity Press.
Neuman, W. R., Guggenheim, L., Jang, S. M., & Bae, S. Y. (2014). The dynamics of public attention: Agenda-setting theory meets big data. Journal of Communication, 64(2), 193–214.
doi:10.1111/jcom.12088
Pampel, F. C. (2000). Logistic regression: A primer (Vol. 132). Thousand Oaks, CA: SAGE Publications.
Petrovic, S., Osborne, M., & Lavrenko, V. (2011). RT to win! Predicting message propagation in Twitter. In Proceedings of the Fifth AAAI Conference on Weblogs and Social Media (pp. 586–589). Palo Alto, CA: Association for the Advancement of Artificial Intelligence.
Ridout, T., Franz, M., Goldstein, K. M., & Feltus, W. (2012). Separation by television program: Understanding the targeting of political advertising in presidential elections. Political Communication, 29(1), 1–23. doi:10.1080/10584609.2011.619509
Ridout, T., & Smith, G. R. (2008). Free advertising: How the media amplify campaign messages. Political Research Quarterly, 61(4), 598–608. doi:10.1177/1065912908314202
Rossini, P. G. C., Stromer-Galley, J., Kenski, K., Hemsley, J., Zhang, F., & Dobresky, B. (forthcoming). The relationship between race competitiveness, standing in the polls, and social media
communication strategies during the 2014 U.S. gubernatorial campaigns. Journal of Information Technology and Politics.
Ryan, J. (2010). The history of the Internet and the digital future. Islington, UK: Reaktion Books.
Skaperdas, S., & Grofman, B. (1995). Modeling negative campaigning. American Political Science Review, 89(1), 49–61. doi:10.2307/2083074
Soroka, S., & McAdams, S. (2015). News, politics, and negativity. Political Communication, 32(1), 1–22. doi:10.1080/10584609.2014.881942
Stieglitz, S., & Dang-Xuan, L. (2014). Emotions and information diffusion in social media—sentiment of microblogs and sharing behavior. Journal of Management Information Systems, 29(4), 217–248. doi:10.2753/MIS0742-1222290408
Theilmann, J., & Wilhite, A. (1998). Campaign tactics and the decision to attack. Journal of Politics, 60(4), 1050–1062. doi:10.2307/2647730
Trent, J. S., & Friedenberg, R. V. (1995). Political campaign communication. Westport, CT: Praeger.
2014 governor race ratings. (2014, September 4). The Cook Report. Retrieved from https://www.cookpolitical.com/ratings/governor-race-ratings/139237
Uysal, I., & Croft, W. B. (2011). User oriented tweet ranking: A filtering approach to microblogs. In Proceedings of the 20th ACM International Conference on Information and Knowledge Management (pp. 2261–2264). New York, NY: ACM. doi:10.1145/2063576.2063941
West, D. M. (2001). Air wars (3rd. ed.). Washington, DC: Congressional Quarterly Press.
Zaman, T. R., Herbrich, R., Van Gael, J., & Stern, D. (2010, December). Predicting information spreading in Twitter. In Computational Social Science and the Wisdom of Crowds Workshop (collocated with NIPS 2010). Retrieved from