copy, particle size, f-potential, specific surface area, differen-tial scanning calorimetry (DSC), impedance spectroscopy, and secondary-ion mass spectrometry. The doped samples were pre-pared by two different methods: (1) coating powders with chlo-rides and (2) mixing chlochlo-rides in a hydrothermal reactor. Different distribution profiles of the dopant atoms were ob-served for the two incorporation methods. Two TC peaks
were detected by DSC for samples doped by coating. Analysis of electrical measurements revealed time constant distri-butions that were more spread in samples that had a core–shell structure.
I. Introduction
D
OPINGof barium titanate (BT) ceramics by aliovalentdo-pants leads to many changes in the material properties, such as conductivity, especially at high temperatures, morphol-ogy, dielectric behavior, etc. As impurities and the lattice im-perfections play a crucial role in these phenomena and also in peculiarities of other properties such as the positive temperature coefficient of resistivity (PTCR) effect,1 their investigation has attracted considerable attention. The mutual influence of impu-rities and lattice defects follows from the necessity of excess charge compensation. Barium titanate doped with donors is usually an n-type semiconductor1; however, its conductivity (and even the majority charge carriers) is considerably influ-enced by intrinsic defects. Some of these intrinsic defects, the metal vacancies, and at low temperature the oxygen vacancies as well, have very low mobility.2–4Therefore, not only the equilib-rium behavior of these defects but also the defect formation and the sample history play an important role with respect to semi-conducting properties. It is known that the addition of a small amount of Nb has significant effects on the properties of BT.5 However, how Nb is distributed locally and what structural variations it causes have not been studied in depth.
Addition of donor dopants such as Nb51at a relatively low concentration results in room-temperature semiconductivity with PTCR,6,7whereas higher donor contents lead to insulat-ing materials with a low concentration of oxygen vacancies and improved resistance to dielectric breakdown.7,8The transition from semiconductor behavior to insulator behavior beyond a critical donor concentration is due to a shift from electron com-pensation to cation vacancy comcom-pensation. There are
discrep-ration into the BT lattice and a narrow temperature range at which the processing is effective.3 Core–shell-structured BT is intentionally formed in X7R materials,9which require a maxi-mum deviation in the dielectric constant of 715% from the 251C value over the temperature range of551–1251C. This can
be achieved when the dopants are purposefully added to create a non-homogeneous crystal.3,9A concentration gradient paraelec-tric shell that contains most of the dopants surrounds a core of almost chemically pure, ferroelectric BT. Such a material is not in thermodynamic equilibrium and is obtained only under cer-tain sintering conditions. Higher temperature or long sintering may promote a more homogenous distribution of dopants and cause a collapse of the core–shell structure.10In this work, we investigated the effect of the incorporating method on the prop-erties of BT doped with various Nb concentrations. Our ap-proach is to work on simple systems with as few as possible degrees of freedom, to elucidate the role of the method of prep-aration and the concentration of Nb in the system.
II. Experimental Procedure
BT powders were prepared by hydrothermal synthesis using a mixture of BaCl22H2O (CARLO ERBA, Rodano, MI, 99.6% purity) and TiCl4 (Aldrich, Milwaukee, WI, 99.9% purity) in deionized water. The solution resulted in a white colloidal sol after the addition of NaOH (2N, Ridel deHaen, Seelze, Ger-many). NaOH was added to form a basic medium according to the stability conditions of BT in a solution (pH412).11,12Then, the sol was transferred to a Teflon liner in a 300 mL stainless-steel vessel. The sealed vessel was heated to 1001C for 5 h. The resultant precipitate was cooled to room temperature, centri-fuged, washed with water to remove excess Ba21, and dried at 801C for 12 h in an evacuated oven. After this, the powder was pressed into pellets and sintered either at 13001C for 5 h or at 13501C for 2 h, at a heating ratio of 31C/min in air.
The doped powders were prepared by two methods: (1) Preparing the doped powders under hydrothermal con-ditions while adding the dopant atoms (Nb51) from the
begin-ning of the reaction. This method is hereafter referred to as ‘‘chloride mixing.’’
(2) Precipitation coating of niobium penta chloride (NbCl5, Fluka, Neu-Ulm, Switzerland) onto the fine BT particles prior to sintering. BT particles were first dispersed in an aqueous so-lution. An additive solution was prepared from NbCl5and then slowly poured into the BT slurry. Precipitation coating was per-formed in basic medium by adding Ba(OH)2(Fluka) to ensure the entry of niobium into the matrix in the titanium sites and to prevent oxidation of niobium ions. This method is hereafter re-ferred to as ‘‘coating.’’
A series of doped powders with Nb concentrations between 0.1 and 3 mol% were examined. X-ray powder diffraction was carried out using a Philips X’pert powder diffractometer (Eind-hoven, the Netherlands), with Cu karadiation working at 40 kV and 40 mA, and a step size of 0.0331/step. Particle size distri-1584
S. Trolier-McKinstry—contributing editor
Based in part on the thesis submitted by H. Yaseen for the M.Sc. degree in chemical engineering, Technion, Israel.
Supported by the Israel Science Foundation (Grant no.107/01-12.6), the Center for Absorption in Science – Ministry of Immigrant Absorption, the NFM consortium admin-istered by the Ministry of Industry Trade and Labor, and the Technion’s Catalysis Centre.
*Member, American Ceramic Society.
w
bution by dynamic light scattering (DLS) andz-potential by la-ser Doppler and phase analysis were measured using axPALS (Brookhaven Instruments Corporation, Brookhaven, NY) par-ticle sizer, equipped with a 35 mW,l5635 nm solid-state laser and an avalanche diode. Specific surface area was measured by multipoint BET, using ASAP 2010 (Micromeritics Instruments Corp., Norcross, GA). Scanning and high-resolution scanning electron microscopy (SEM and HR-SEM) were performed using a JEOL JSM-5400 microscope (Tokyo, Japan) with EDS, work-ing at 15 kV, and with a LEO 982 microscope (Cambridge, UK) at an accelerating voltage of 5 kV, respectively. TEM was per-formed on a Philips CM120 transmission electron microscope (Eindhoven, the Netherlands) working at 120 kV. The shrinkage behavior of the samples was investigated using a dilatometer model DIL801 (Ba¨hr, Hu¨llhorst, Germany). Electrical measure-ments were performed using an Agilent 4294A impedance analyzer (Palo Alto., CA) and an SR830 lock-in amplifier (Stan-ford Research, Sunnyvale, CA). The electrical measurements were performed on disks of dense ceramic samples with approx-imate dimensions of 9.8 mm diameter and 1.2 mm width. Elec-trodes of silver paste were applied on both sides of the disks and annealed at 2501C for 2 hours.
III. Results and Discussion
The prepared BT powder had a cubic crystalline structure before sintering. Its average effective diameter (derived by light scat-tering using the sixth moment, which is the standard in particle correlation spectroscopy) was 24 nm, mono-dispersed, and with a narrow distribution of73 nm. Figure 1 presents the volume distribution, i.e., the fourth moment, which is always somewhat smaller than the effective diameter. These two averaging proce-dures yielded close results when the distribution was narrow.
The specific surface area of the pure BT powder was 62 m2/g. Figure 2 shows an HR-SEM image of almost spherical and ho-mogenous distributed particles of the as-prepared powder.
From z-potential measurements of the powders in different pH values, the isoelectric point (i.e.p.) was found at pH1170.5 for all the as-prepared samples. This relatively high pH value was probably a result of barium carbonate on the particle surface.13,14The stability of colloids depends in part on thez-potential. As a rule of thumb, when the absolute value ofz -potential is above 30 mV, the dispersions are stable due to elec-trostatic repulsion, while when the z-potential is close to zero fast coagulation and as a result fast sedimentation is likely to occur. Therefore, the z-potential is an important parameter characterizing colloidal dispersion. Figure 3 shows thez -poten-tial as a function of pH for as-prepared undoped BT and nom-inally 1 mol% Nb-doped BT. It seems that the only difference is due to the ionic strength of the solution, and there is no signif-icant effect of the Nb on the i.e.p. of the sample. After calcina-tion, there is a significant shift in the i.e.p. toward lower pH values, from11 to 4, probably due to less barium carbonate on the surface,15and perhaps also due to barium leaching,14as the value of 4 is also typical for TiO2.
[image:2.594.324.561.41.222.2]Nitrogen adsorption isotherms were measured at 77 K for all the samples; see the results in Table I. Figure 4 presents the ad-sorption isotherm for samples doped with 1 mol% Nb by the two methods. The BET isotherms indicated that the adsorbent had relatively large pores. The adsorption curves had the same general shape, except that the adsorbed volume increased faster in the intermediate zone in samples doped by chloride mixing. Figure 5 showst-plot curves (which represent the adsorbed vol-ume as a function of the thickness calculated by the Harkins and
Fig. 1. Particle size distribution of pure BaTiO3powder.
[image:2.594.67.293.42.180.2]Fig. 2. High-resolution electron microscopy micrograph of polycrys-talline pure BaTiO3powder.
[image:2.594.64.299.555.731.2]Fig. 3. z-Potential of barium titanate powders: pure and doped with 1 mol% Nb.
Table I. Surface Area and Pore Distribution Values of Pure and Doped Samples in the Green Form
Sample
Surface area ( m2
/g) Pore distribution
Pure 62 Micropores
0.1 mol% Nb-coating 23 Micro to nanopores
0.3 mol% Nb-coating 22 Micro to nanopores
1 mol% Nb-coating 11 Micro to nanopores
0.1 mol% Nb-chloride mixing
30 Micro1mesopores
0.3 mol% Nb- chloride mixing
39 Micro1mesopores
1 mol% Nb- chloride mixing
[image:2.594.325.564.619.751.2]Jura equation)16 for 1 mol% Nb-doped samples. From these and similar t-plots, we can learn about the pore size of each sample as represented in Table I. The presence of niobium on the surface of samples doped by coating caused a decrease in the adsorption capability. This suggests that niobium fills the pores and hence decreases the adsorption volume.
[image:3.594.32.271.40.214.2]Curie points for the pure and doped samples are displayed in Table II. The general trend was that the Curie point was shifted to a lower temperature with increasing concentration of Nb.
which describe the phase transition peak at the Curie point for samples doped with 0.3 mol% Nb by the two methods. The 0.3 mol% doping is of particular interest here, as for samples pre-pared by chloride mixing one peak was detected (at 1161C), whereas two peaks were detected for samples doped by coating: a broad one at 1121C and another one at 1211C. This could be
explained by the core–shell structure that is formed in the sam-ple. The Nb concentration at the shell was higher than the nom-inal concentration, while at the core it was lower than the nominal concentration. The Curie point is known to be a very sensitive probe for various changes in the bulk material; hence, the two different noticeable peaks suggest a noticeable core– shell structure.
In order to investigate the sintering process, shrinkage meas-urements were performed using a dilatometer. In all the per-formed shrinkage measurements, it was observed that in samples doped by coating, where the concentration of Nb at-oms is higher on the surface (shell), the shrinkage began later. The presence of niobium atoms on the surface of the BT grains hinders the sintering process.17For instance, in samples doped with 0.1 mol% Nb by chloride mixing, appreciable shrinkage began at 8501C, while in samples doped by coating, the shrink-age began at 11001C. Figure 7 shows the shrinkage–temperature diagram of nominally 1 mol% Nb-doped BT specimens pre-pared by the two methods. For samples doped by chloride mix-ing, appreciable shrinkage began at 11001C. For samples doped
by coating, no appreciable shrinkage was observed until 13001C.
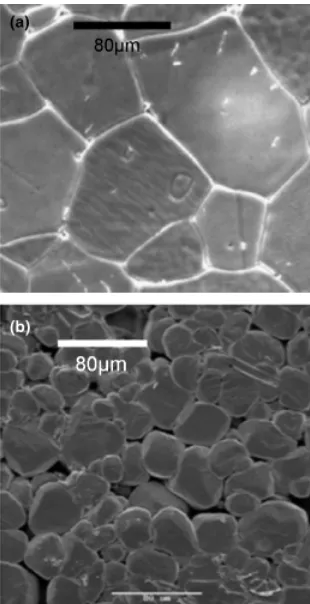
From SEM images, abnormal grain growth was noticed in the samples doped by coating with a low Nb concentration (0.1 and 0.3 mol%). This was assumed to be due to the inhomoge-neity of the dopant distribution. When the dopant concentra-tions were higher, the microstructures were quite different and a more homogenous structure was obtained for samples doped with 1 mol% Nb. Figure 8 shows SEM images of samples doped with 0.1 mol% Nb, prepared by the two methods and sintered at 13001C for 5 h in air. The differences in the grain growth between these samples were caused because of the different dis-tributions of dopant atoms and internal defects due to self-compensation.18,19This is in accord with our observation that
Fig. 4. Nitrogen adsorption isotherms of barium titanate doped with 1 mol% Nb.
(a)
(b)
Fig. 5. t-plot of samples doped with 1 mol% Nb prepared by (a) chlo-ride mixing and (b) coating.
[image:3.594.293.535.62.145.2] [image:3.594.32.269.358.727.2] [image:3.594.312.514.579.728.2]oxygen vacancies are crucial in the early stage of the sintering of nano-BT.20
Figure 9 shows secondary-ion mass spectrometry (SIMS) measurements, revealing the depth profile concentrations of Nb, Ba, and residual carbon in BT samples doped with 1 mol% Nb and sintered at 13001C. The grain size, as estimated
from SEM image, was approximately 1mm. The concentration of Nb atoms was constant for samples doped by chloride mix-ing. In the case of samples doped by coating, the concentration at the surface was higher, and decreased until a constant value was obtained at a depth of approximately 50 nm. This is a direct confirmation of the fact that different incorporation methods give rise to different profiles of the dopants. The concentration of niobium in chloride mixing samples was lower than in
sam-ples doped by coating with the same initial concentration, as expected. This is because niobium ions that were not incorpo-rated into the lattice during the hydrothermal reaction in the chloride mixing samples were removed as excess Ba12and Cl1 during the washing steps.
Figure 10 shows TEM images for samples sintered at 13001C for 5 h, doped by (a) chloride mixing and (b) coating. Crystal-lites of comparable sizes, around 200 nm, were chosen for the imaging. A difference in the microstructures for samples with the same nominal dopant concentration prepared by the two different methods was observed; in (b), the core–shell structure can be seen. In both Figs. 9(b) and 10(b), it is shown that a core– shell structure with about a 50 nm shell was obtained by coating after the sintering process. The core dimensions seemed to be of the same order (Fig. 10(b)) or even larger (Fig. 9(b)). Recalling that the grain size of the as-prepared hydrothermal powder was 20–40 nm (see Figs. 1 and 2) suggests that the crude coating technique results in coating of agglomerates that later become grains during the sintering.
Electrical measurements were obtained by an impedance an-alyzer and a lock-in amplifier at different frequencies and tem-peratures.21Figure 11 shows the capacitance as a function of temperature at different frequencies within the range of 100 Hz– 1 MHz, for samples doped with 1 mol% Nb by chloride mixing (Fig. 11(a)) and by coating (Fig. 11(b)). These samples were sintered at 13001C for 5 h. The capacitance was measured on disks with silver electrodes as described in the Experimental Procedure section. These samples behaved within the measured frequency and temperature ranges to first approximation as ca-pacitors with dissipation factors of about 0.1. Therefore, the capacitance is calculated from the imaginary part of the
imped-Fig. 7. Shrinkage behavior of samples doped with 0.1 mol% Nb heated to 11001C.
[image:4.594.61.297.43.209.2]Fig. 8. Scanning electron microscope images of samples doped with 0.1 mol% Nb after sintering at 13001C for 5 h in air prepared by (a) chloride mixing and (b) coating. The bars are 80mm.
[image:4.594.102.257.418.720.2]ance, assuming a model of capacitor in series with resistor. The addition of niobium by coating resulted in a flatter C(T) curve. A larger temperature dependence could be seen for chloride mixing samples. The relative densities of these samples as meas-ured by the Archimedes method were 80% for the chloride mix-ing and 90% for the coatmix-ing samples.
Figure 12 shows the distribution of the relaxation time con-stants for samples doped with 1 mol% Nb (as an example) by the two methods at 3001C. The analysis of these impedance
spectroscopy measurements was performed by a technique that retrieves a time constant distribution function,g.22,23The meas-ured impedanceZ(o) is represented by
ZðoÞ ¼R
Z 1 1
gðlogtÞ 1þiotdðlogtÞ
Z 1 1
gðlogtÞdðlogtÞ ¼1 (1)
whereRis a normalization constant andois the angular fre-quency. The assumption is thatghas a Gaussian shape in the logt domain. Excellent fittings were obtained using this tech-nique for dense ceramic samples. In this presentation, the wider peak was due to a less homogenous structure. For samples doped by chloride mixing, the peaks were narrower compared with samples doped by coating. This behavior is in agreement with Fig. 11, where larger relative differences in the capacitance at 3001C between different frequencies were detected for samples doped by coating.
IV. Summary and Conclusions
In this work, the microstructural development and electrical properties of Nb-doped BT ceramics were analyzed, focusing on the effects of the doping method on the properties. Beyond a critical concentration, niobium inhibited the grain growth of BT. Different microstructures were observed in samples that had
[image:5.594.72.230.39.335.2]the same nominal dopant concentration, but are prepared by different methods, and for those doped by coating, a core–shell structure was obtained. The fact that the core–shell structure of the sintered coated samples was also obtained after grain growth suggests coating of agglomerates rather than coating of individ-ual primary particles. Differential scanning calorimetry detected two TC peaks for samples doped by coating when the Curie point at lower temperature referred to the shell and the other
Fig. 12. Distribution of time constants for samples doped with 1 mol% Nb by the two methods at 3001C.
(b)
Fig. 11. Capacitance as a function of the temperature in samples doped with 1 mol% Nb by (a) chloride mixing and (b) coating (on the same scale as (a); the inset shows the same data on a different scale).
[image:5.594.294.534.41.385.2] [image:5.594.295.535.550.727.2]peak referred to the core. Electrical measurements showed more a distributed time constant in samples doped by coatings that had a core–shell structure. Samples doped by chloride mixing had a narrower time constant distribution. It was shown that the incorporation method greatly influences the properties of the sintered samples, suggesting strong kinetic effects.
Acknowledgements
We would like to thank C. Cytermann for performing the SIMS measurements and Alex Berner for helping with the TEM measurements. We also thank Char-melle Phillips for help with editing the manuscript.
References
1
J. Daniels, K. H. Ha¨rdtl, and R. Wernicke, ‘‘The PTC Effect of Barium Ti-tanate,’’Philips tech. Rev.,38[3] 73–82 (1978/79).
2
J. Sasaki and K. Maier, ‘‘Low Temperature Defect Chemistry of Oxides,’’J. Eur. Ceram. Soc.,19[6–7] 741–5 (1999).
3
K. Kowalski, M. I. Ijjaali, T. Bak, B. Dupre, J. Nowotny, M. Rekas, and C. C. Sorrell, ‘‘Kinetics of Nb Incorporation into Barium Titanate,’’J. Phys. Chem. Sol., 62[3] 531–5 (2001).
4
Y. Tsur, ‘‘Kinetic Considerations in the Formation of Electrical Active Grain Boundaries in Barium Titanate and Similar Perovskites,’’Inter. Sci.,9[3–4] 163–7 (2001).
5
M. Kahn, ‘‘Influence of Grain Growth on Dielectric Properties of Nb-Doped BaTiO3,’’J. Am. Ceram. Soc.,54[9] 455–7 (1971).
6
Q. Jianquan, G. Zhilun, W. Yongli, Z. Qing, W. Yajing, and L. Longtu, ‘‘The PTCR Effect in BaTiO3Ceramics Modified by Donor Dopant,’’Ceram. Int.,28[2]
141–3 (2002).
7
G. H. Jonker, ‘‘Some Aspects of Semiconducting Barium Titanate,’’Solid. State. Electron.,7[12] 895–903 (1964).
8
A. M. Slipenyuk, M. D. Glinchuk, V. V. Laguta, I. P. Bykov, A. G. Bilous, and O. I. V’Yunov, ‘‘Impurity and Intrinsic Defects in Barium Titanate
Ceramics and Their Influence on PTCR Effect,’’ Ferroelectrics, 288, 243–51 (2003).
9
Y. Park, H. G. Kim, and Y. H. Kim, ‘‘The Effect of Grain Size on Dielectric Behavior of BaTiO3Based X7R Materials,’’Mater. Lett.,28[1–3] 101–6 (1996).
10
H. Chazono and H. Kishi, ‘‘Sintering Characteristics in BaTiO3–Nb2O5–
Co3O4 Ternary System: II, Stability of So-Called ‘Core–Shell’ Structure,’’ J. Am. Ceram. Soc.,83[1] 101–6 (2000).
11
M. M. Lencka and R. E. Riman, ‘‘Thermodynamic Modeling of Hydrother-mal Synthesis of Ceramic Powders,’’Chem. Mater.,5[1] 61–70 (1993).
12
S. Venigalla and J. H. Adair, ‘‘Theoretical Modeling and Experimental Ver-ification of the Electrochemical Equilibria in the Ba–Ti–C–H2O System,’’Chem. Mater.,11[3] 589–99 (1999).
13
M. C. Blanco Lo´pez, B. Rand, and F. L. Riley, ‘‘The Isoelectric Point of BaTiO3,’’J. Eur. Ceram. Soc.,20[1] 107–13 (2000).
14
U. Paik, S. Lee, and V. A. Hackley, ‘‘Influence of Barium Dissolution on the Electrokinetic Properties of Colloidal BaTiO3in an Aqueous Medium,’’J. Am. Ceram. Soc.,86[10] 1662–8 (2003).
15
M. C. Blanco Lo´pez, G. Fourlaris, B. Rand, and F. L. Riley, ‘‘Characteriza-tion of BaTiO3Powders: Identification of BaCO3Impurity,’’J. Am. Ceram. Soc.,
82[7] 1777–86 (1999).
16
A. W. Paul and O. Clyde,Analytical Methods in Fine Particle Technology, Chapter 3, pp. 53–152. Micromeritics Inst. Corp., 1977.
17
W. R. Buessem and M. Kahn, ‘‘Effects of Grain Growth on the Distribution of Niobium in Barium Titanate Ceramics,’’J. Am. Ceram. Soc.,54[9] 458–61 (1971).
18
Y. Tsur and I. Riess, ‘‘Self-Compensation in Semiconductors,’’Phys. Rev. B, 60[11] 8138–46 (1999).
19
Y. Tsur and C. A. Randall, ‘‘Point Defect Concentrations in Barium Titanate Revisited,’’J. Am. Ceram. Soc.,84[9] 2147–9 (2001).
20
R. D. Levi and Y. Tsur, ‘‘The Effect of Oxygen Vacancies in the Early Stages of BaTiO3Nanopowder Sintering,’’Adv. Mater.,17[13] 1606–8 (2005).
21
Y. Melman, S. Baltianski, and Y. Tsur, ‘‘A Device for Measuring Electrical Properties of Dielectric Materials,’’Instrum. Sci. Technol.,33[3] 279–87 (2005).
22
S. Baltianski and Y. Tsur, ‘‘Analysis of Impedance Spectroscopy Data—Find-ing the Best System Function,’’J. Electroceram.,10[2] 89–94 (2003).
23