Creative Components Iowa State University Capstones, Theses and Dissertations
Fall 2018
Practical SIEM tools for SCADA environment
Practical SIEM tools for SCADA environment
Steven Perez
Iowa State University, [email protected]
Follow this and additional works at: https://lib.dr.iastate.edu/creativecomponents
Part of the Power and Energy Commons
Recommended Citation Recommended Citation
Perez, Steven, "Practical SIEM tools for SCADA environment" (2018). Creative Components. 93. https://lib.dr.iastate.edu/creativecomponents/93
Practical SIEM tools for SCADA
environment
By
Steven Perez
MASTER OF SCIENCE
Program of Study Committee:
Manimaran Govindarasu, Major Professor
Iowa State University
Ames, IA
ii
TABLE OF CONTENTS
LIST OF FIGURES ... iii
ABSTRACT...iv
CHAPTER 1 INTRODUCTION ...1
1.1 What is SIEM? ...1
1.2 Capabilities and challenges of SIEM solutions………2
CHAPTER 2 SECURITY ONION...3
2.1 What is Security Onion? ...3
2.2 Security Onion Tools...4
CHAPTER 3 IMPLEMENTATION...5
3.1 Topology...5
3.2 Installing Security Onion...6
CHAPTER 4 DNP3 AND INTRUSION DETECTION……….………8
4.1 DNP3 Protocol...8
4.2 Intrusion Detection...9
4.3 Snort...10
4.3.1 Writing Snort Rules in Sguil ...11
4.3.2 How a Rules is created...11
4.3.2 Attacks In SCADA……… ...11
CHAPTER 5 EXPERIMENT AND EVALUATION……….12
CHAPTER 6 CONCLUSION...15
iii
LIST OF FIGURES
Figure 1 SIEM typical functions...2
Figure 2 Experiment Topology...6
Figure 3 Kibana Dashboard...7
Figure 4 Squert View...8
Figure 5 DNP Packet Structure...9
Figure 6 Function Code………...10
Figure 7 Sguil Window...11
Figure 8 Snort rule...13
Figure 9 Wireshark………...13
Figure 10 Control Code for Tripping...14
Figure 11 Nmap alert in Sguil...17
Figure 12 Unauthorized Trip alert in Sguil...13
Figure 13 Unauthorized Trip alert in Kibana...13
Figure 14 Unauthorized Trip alert in Squert...14
Figure 15 Anomaly Trip alert in Squert……...13
Figure 16 Unauthorized Trip alert in Kibana...13
Figure 17 Timing of Rules...13
iv
Abstract
Supervisory Control and Data Acquisition (SCADA) and Industrial Control Systems
(ICS) are increasingly under attack in recent years. Every year we developed more secure
architectures. Security Information and Event Management (SIEM) systems are getting
widely popular nowadays for different sectors of the industry but few for ICS/SCADA
systems. We are lacking monitoring and alerting systems in the Power Grid. In today
world business in different sectors of the industry use common defenses such as firewalls,
two factor authentication, egress filtering and others to try to prevent attackers from
getting into the network. While these defenses provide some security for known attacks
other kinds of attacks are not detected. Anomaly behavior is difficult to detect and the
previous defenses are not helping once an attacker is inside the network.
Typical SCADA systems lack monitoring systems in the OT network as is not part
of the IT network. This paper provides an easy way to step up a monitoring and alerting
system for substation in the OT network. Security onion is a free open source software
that is deployed as a NIDS (Network Intrusion Detection System) on the OT network. The
experiment was conducted using the Power Grid Lab in Iowa State using Siemens
Relays.
In this paper, we provide a solution that incorporates a SIEM solution using well
known free open source tools on the Security Onion Linux Distribution for monitoring and
logging. We first understand why a SIEM solution is a good choice to be implemented in
a ICS. Its advantages and capabilities and other cases where a SIEM solution have
proved to help security. Later we also provide with a three-layer detection system for
intrusion for Substations based on anomaly and signature detection using Snort as well
1
CHAPTER 1
INTRODUCTION
1.1 What is SIEM?
SIEM products are the merging of two different approaches of security; SIM
(Security Information Management) and SEM (Security Event Management). One key
advantage of SIEM products from traditional log management software is the ability of
alerting and event correlation. Some of the reasons why SIEM products were developed
are because of Compliance, Insider Treats, Incidents are Costly, Complex Problems
needs multifaceted solution and Hard to measure cost and benefit. As with any new
solution SIEM also has some challenges to address. False positives are very typical and
can take a lot of time to search an analyze using resources. Lack of cooperation from the
organization itself can prove costly when logging data.
ICS systems are more prone to cyber-attacks since some of their communication
protocols were not created with security in mind. DNP3 is one of the protocols more widely
using in today SCADA systems. More detail information about DNP3 will be discussed in
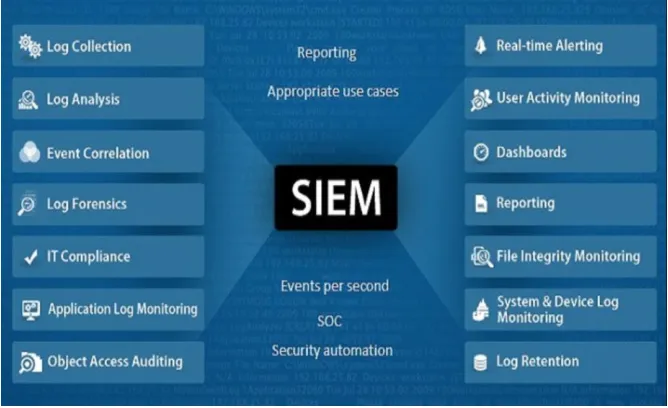
detail later. SIEM solutions gives the user the power to analyze the traffic and look for
event in real time. Figure 1 show some of the typical features of a SIEM solution. Our
solution later discuss on this paper will grab the main functions and adding intrusion
2
Figure 1 SIEM typical functions
SIEM solutions at its core provides with:
1. Event and Log Collection
2. Event and Flow Correlation
3. Reporting and Alerting
4. Log Management
Some of the benefits the SIEM provides provide are:
1. Centralized Analysis and reporting
2. Detection of Attacks
3. Real time Monitoring of the network
4. Fast incident handling
1.2 Capabilities and Challenges of SIEM solutions
Security Management is an important critical issue in the IT industry. SIEM has
provided much needed capabilities to help provided automated reporting for compliance
and centralized reporting. In one paper [1], it mentions behavior profiling which is when
3
Another capability is data and user monitoring, application monitoring and analytics. SIEM
solutions have also face challenges. One of these challenges that the system cannot pick
up or detect an attack that was never logged [2]. Attackers now are using evasion
techniques to further disguise themselves in the system. They could also attempt to
disable logging and also able to delete any existing local log trails. Because SIEM solutions deal with a lot of alerts and logs it sometimes don’t have enough resources to
investigate all the alerts that are coming and make a decision on whether a legitimate
attack is or not. As we start looking more deeply into SIEM solutions we can combine it
with another important security solution: Intrusion detection.
Intrusion detection has been on the research area for a long time [3]. With the
development of TCP/IP, new security problems have risen leading to the development of
new security techniques. The lack of insufficient access control measures in for example
the military environments have led to the creation of Intrusion Detection Systems (IDS).
What we proposed in this paper is to have the capabilities of a SIEM solution plus
the added security of a IDS all into one. While there are numerous vendors for SIEM
solution such as Arc Sight, IBM Security, Splunk [1] we proposed a free open source
called Security Onion which have both features, log management and intrusion detection.
In the next chapter we are going to look in more depth at Security Onion, their tools and
how we can set it up in a ICS architecture to provide security.
CHAPTER 2
SECURITY ONION
2.1 What is Security Onion?
Security Onion [4] is a Linux distribution for IDS an NSM (Network System
Monitoring). NSM is the collection, detection, analysis, and escalation of indications and
warnings to detect and respond to intrusions. NSM is a way to find intruders on your
4
Onion is based on Xubuntu 14.04 and contains different analysis tools such as Sguil,
Kibana, Squert as well as two Intrusion Detection Systems, Snort and Bro.
With security onion data can be collected and analyzed. It provides visibility into
the network and anomalous events with a vast majority of capabilities and tools.
The following three core functions:
● Full packet capture
● Network based and host based detection systems ● Powerful analysis tools
2.2 Security Onion Tools
In this step, up we are going to use the following analysis tools to help us monitor
our OT network and look for events or any kind of unusual behavior. Some of the tools
Security onion provides are:
1. Sguil
The analysis console for Network Security Monitoring. It provides visibility to the
event data that is being collected and also provides context to validate the detection. Its
GUI provide real time access to real time events, session data, and packet captures.
1. Kibana
Allows the user to quickly analyze and pivot between all the different data types:
DNP3, HTTP, generated by Security Onion. With Kibana, you can easily perform
advanced data analysis and visualize your data in a variety of charts, tables and maps.
5
Squert goes in hand with Sguil. It lets you interface with the Sguil database so you
can search for data stored (usually IDS alerts) Some visualizations options are time series
representation, weighted and logical group results sets.
1. Snort
Snort[5] is an open source network intrusion detection system. It looks at the
network traffic for fingerprints and identifiers that match known malicious traffic. Custom
rules can be added into Sguil. Custom rules are created later for the substation.
1. Bro
Unlike Snort, Bro gives you all the data that it sees in the network. It monitors and
logs any connections, DNS requests, HTTP, FTP, SSH, DNP3 and syslog activities that
it sees. Bro provides analyzers for many common protocols.
CHAPTER 3
Implementation
3.1 Topology
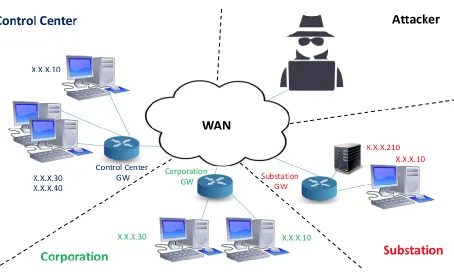
Security Onion is easy to set up in any network. We used the topology that we use
for training for business and also for students at Iowa State. In Figure 2 we can see a
typical topology of a SCADA network. For testing purposes, we have separated the
devices into different networks. Control Center and Substation will be part of the OT
(Operation Technology) Network, Corporation will be part of IT (Information Technology)
Network and the attacker will be the outsider. This architecture model real SCADA
systems found in the industry. Security onion will be sitting on the substation network after
6
Figure 2 Experiment Topology
3.1 Installing Security Onion
Security Onion can be deployed as standalone or server-sensor. For this
experiment we selected standalone deployment since we are only working on the
substation part of the OT network. During the installation we need to have some
requirement met when creating the virtual machine. Two virtual NIC cards, two CPUs,
8gb of memory and 10gb of hard drive.
During installation we need to configure both ethernet devices. One of these
devices is used for management of the tools and connecting to security onion. The other
one is use to sniffing the traffic that is coming through the gateway of the OT network.
Port mirroring need to be enabled on the internet device so that it can see the traffic
coming in to the substation network. For the management devices we can let it at DHCP
7
After setting up passwords for Sguil, Kibana and Squert we are ready to use
Kibana to monitor traffic on the substation network. They are times that Once you Open
Kibana it won’t load up because the server is not running. To make sure that all the
processes are running go to Terminal and give yourself root privileges. To do this type “sudo su” then type your password powercyber. Next type so-status. Make sure that of
them say okay. If not then type so-restart to restart everything.
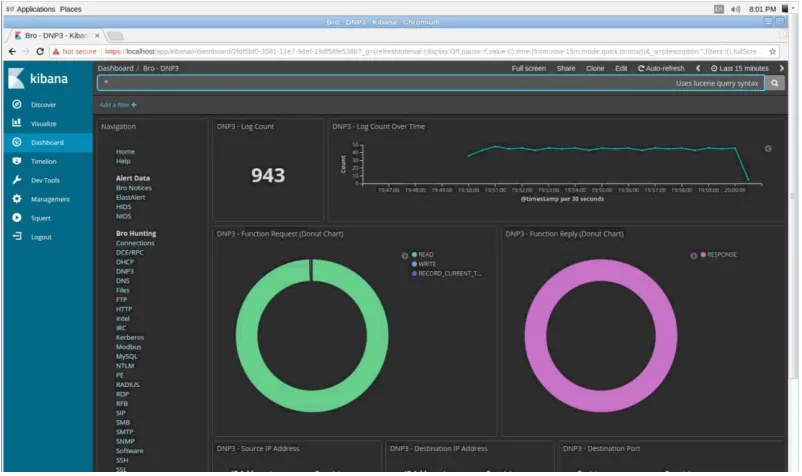
With Kibana we can look at all the packets that the sniffer sensor sees in the
substation network. It provides with multiple options to analyze and collect all logs
analyzed by Bro. With Dashboard we can select a particular bro connection and look at
[image:12.612.106.507.320.558.2]a particular protocol. For example DNP3.
Figure 3 Kibana Dashboard
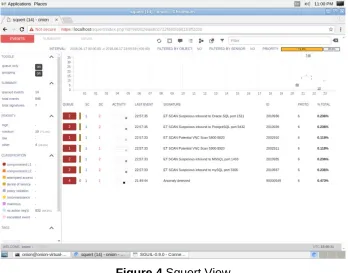
Along with Kibana Squert can let us also look at the events in real time. It displays
8
Figure 4 Squert View
CHAPTER 4
DNP3 AND INTRUSION DETECTION 4.1 DNP3 Protocol
The Distributed Network Protocol or Dnp3 [6] is one of the several standards that
was developed that allows communication within SCADA. It is an efficient protocol that
allows for the delivery of measurement data from a substation or client to the control
center or server.
While the Dnp3 is widely used in today SCADA systems many vulnerabilities and
deficiencies have been found [7][8]. One of the most common vulnerabilities is man in the
middle attack. This happens when an unauthorized person sends a packet with a
command to the substation to perform a task. This can be detected by writing a rule into
9
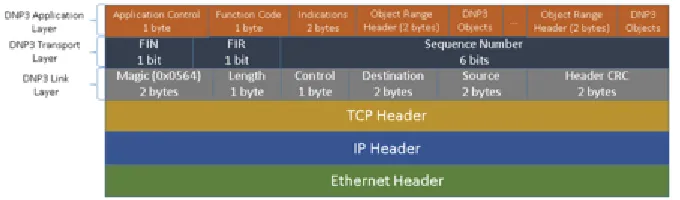
The DNP3 protocol is composed of three main layers, link layer, transport layer and
application layer. It sits on top of the TCP/IP network. structure. In Figure 5 we can see
[image:14.612.147.487.160.260.2]the graphical representation.
Figure 5 DNP Packet Structure
Knowing the structure of the DNP3 protocol we can start writing rules at different
levels of the protocol. The first layer is the Link layer and is similar to the Ethernet layer.
A DPN3 packet always starts with two magic bytes at the start, the length of all the
fields, a control byte, source and destination addresses and a header CRC field. The
transportation layer is mainly used to fragmenting large DNP3 packets. The FIN and
FIR bits indicate whether this is the final and/or first fragment in the sequence. The last
six bits sequence number is used for fragment reassembly.
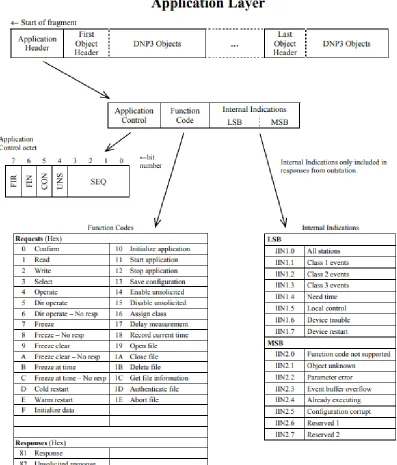
One layer that can be used to determine if we are receiving valid requests is the
Application Layer. This layer is responsible for performing operations on data objects
defined by the device. Some examples of operations include returning values after a
read function, arming and energizing the output point after a select and operate. We can
check whether we are sending a warm or a cold restart from the control center. Based
on how the DNP3 packet is supposed to behave we could also right rules that can verify
if the magic number (0x0564) is the correct one on the Data Link Layer. Figure 6 show
the different function codes on the Application layer that we can put rules to detect bad
10
The transportation layer is mainly used to fragmenting large DNP3 packets. The
FIN and FIR bits indicate whether this is the final and/or first fragment in the sequence.
[image:15.612.119.516.164.629.2]The last six bits sequence number is used for fragment reassembly.
11
4.2 Intrusion Detection
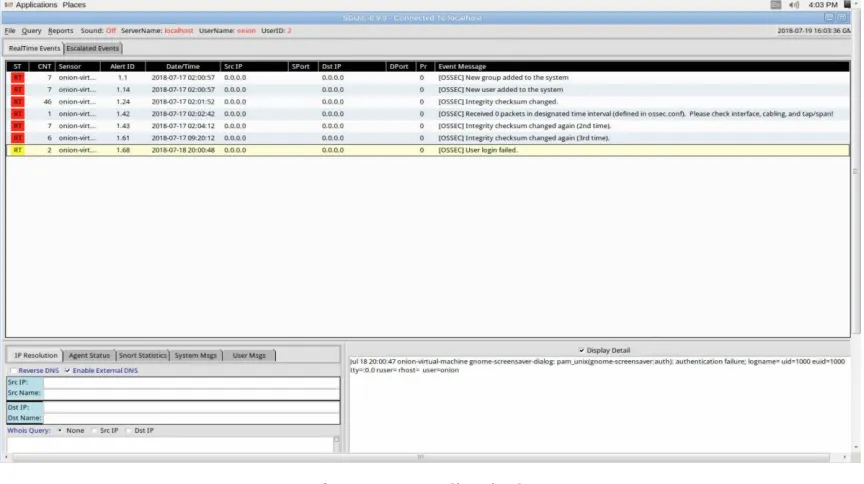
The sniffing Nic that is part of Security onion will be responsible monitor all the
activities and provide timely and accurate alerting if any rules is triggered. Rules are
created and run using the Snort engine. The community of snort have also provided rules
for many common malicious activities. Digital Bond, a security consulting firm, have
provided researchers with some custom rules to detect DNP3 malicious commands. They
[image:16.612.91.523.260.502.2]are downloaded and added to Snort for this report.
Figure 7 Sguil Window
Many research papers have been written about intrusion detection in Process
Control systems [9]. Model based detection is one of the most common used detection
techniques. Since we know that certain computer in the system are allow to talk to each
other we can create rules to detect if we deviate from a normal behavior.
In this paper two method of detection were used:
12
○ Attacks are detected based on specific patterns in the packet such as byte
sequences or known malicious intrusion sequences used by attackers.
● Anomaly-based
○ Normally used with machine learning to create a model of trusted activity. It compares new behavior with old to determine if it’s an attack
Our solution provides a mixture of both methods. Squil and Snort are used in
together to deploy both methods in Security Onion.
4.3 Snort
Snort is configured to monitor network traffic. To make changes to Snort it need to
be edited on the file /etc/nsm/HOSTNAME-INTERFACE1/snort.conf. In this file we can
change our HOME_NET and EXTERNAL_NET address. Preprocessors can be enabled
and disabled and what rules files are going to be enabled.
Custom rules are added to local.rules in
/etc/nsm/HOSTNAME-INTERFACE1/rules/. After we added a new rule in local.rules file we need to perform a
command rule-update. This rule restarts Snort and Barnyard. The later one is an output
spool reader for Snort.
4.3.1 Writing Snort Rules in Sguil
13
Figure 8 Snort rule
Here is a rule example to detect a relay tripped 3 unders 60 seconds:
Alert tcp any any -> any 20000 (msg:”Anomaly: Relay Tripped 3 times under 60 seconds”;content:”|00 81|”;threshold: type threshold, track by src, count 6 ,seconds 60;sid:1000003)
4.3.2 How a rule is created
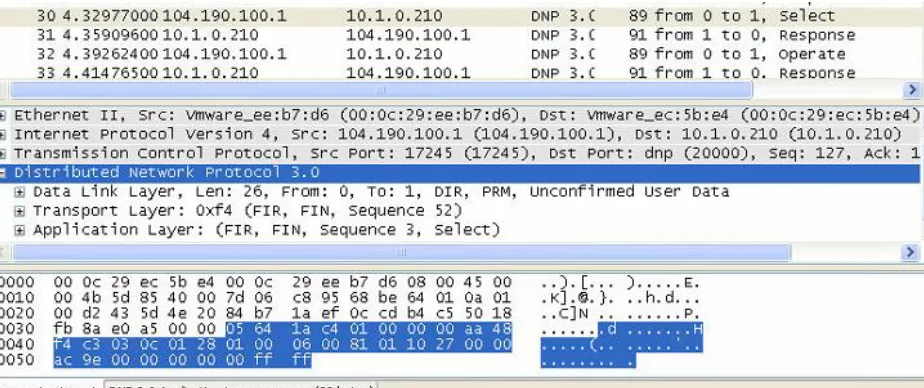
When writing a rule with snort is very simple. We first look at the DNP3 packet
using a pretty well know tool called Wireshark. This tool always the capture of packet on the network and let us see what’s inside the packet, Figure 8 we can see a snapshot of a
DNP3 packet.
[image:18.612.77.539.491.685.2]14
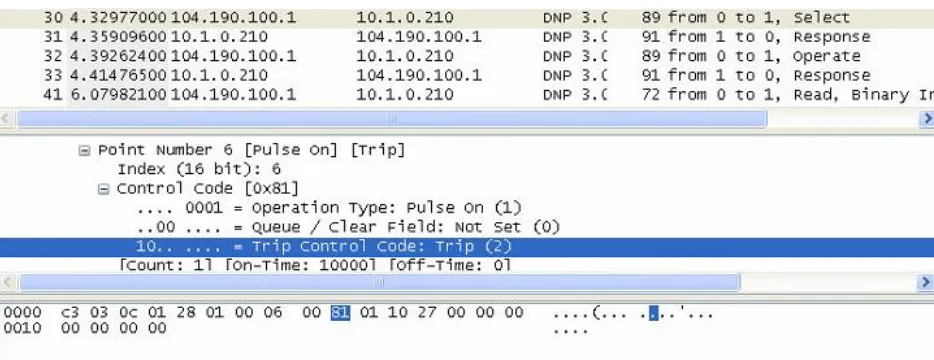
In order to write a rule to detect a Trip we need to look into the request data
object and look for what byte is telling the Substation to trip the relay. This can be found
in Figure 9. We can see the Control code to trip the relay is in byte inside the application
[image:19.612.73.540.167.347.2]layer.
Figure 10 Control code for tripping
After knowing what are we looking for to detect a tripping command we can start
writing our rule. Our action will be alerting, Next the protocol is TCP because dnp3 is
built on that protocol. Next since we are detecting a Tripping command from an
unauthorized user we can put our trusted source IP address and putting a “!” in front of
it. This will be triggered when an unknown source sends the command. Next, we write “any” for the source port. Direction is “->”. Next, we put our local substation IP with the 2000 port number. We write a message “Incoming Trip command from Unknown Control Center”. For our content we type the byte what we found in the Wireshark capture “|00 81|”. This will make snort look for this pattern in the data object. Last thing
we need to ad is the sid
15
4.3.3 Attacks In SCADA
We have identified different kinds of attacks based on the type. We can have
attacks that attack the relays, attack the substation authorized access and other more
attacks. Attack usually start with reconnaissance first. During this stage the attacker finds
information about the whole topology and machines in the network. In the second phase
the attacker starts getting access to the substation. Once the Attacker knows where the
substation is located he can start do malicious tripping of the relay. Malicious tripping can
be done via static or dynamic attacks. Finally, the attacker start disabling the substation
by performing a denial or service so no one can try to resolve the issue in a timely matter.
Attack Reconnaissance
o Alert icmp $EXTERNAL_NET any -> (IP of your substation) any (msg:” ICMP
to Substation”; content: “|10 11 12 13 14 15 16 17 18|; sid: 900547; rev:1;)
o Alert tcp any any -> $HOME_NET 23 (msg:”TCP Port Scanning”; sid:900555;
rev:1;)
Unauthorized Access
o Alert tcp $EXTERNAL_NET any -> (IP of your substation) 23 (msg:”
Incoming Telnet root connection”; content:”root”; nocase; sid: 900546;
rev:1;)
DoS Attacks
o Alert tcp $EXTERNAL_NET any -> (IP of your substation) 80 (msg:”
Warning DoS attack incoming”; flow: stateless; threshold: type both, track
16
Malicious Tripping
Static Attack
o Alert tcp !(IP from your control center) any -> (IP of your substation) 20000
(msg:”Incoming Tripping command from unauthorized Control Center ; content :”|00 81|”; sid: 900547; rev:1;)
Dynamic Attack
o Alert tcp !(IP from your control center) any -> (IP of your substation) 20000
(msg:” Anomaly detected: Relay Tripped 2 times under 3 min” ; content :”|00 81”|; threshold:type threshold, track by src, count 4, seconds 3; sid: 900547;
rev:1;)
CHAPTER 5
EXPERIMENT AND EVALUATION 5.1 Experiments
5.1.1 NMap Scans
Performing a nmap form an outsider attacker towards the Substation Network.
We can see all the different alerts that were triggered in Sguil. We can see in the figure
17
Figure 11 Nmap alert in Sguil
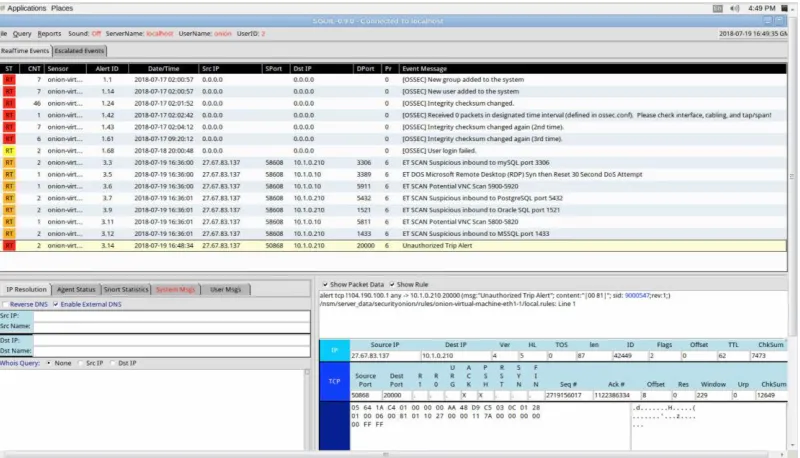
5.1.2 Tripping from Unauthorized Source
Tripping from unexpected place can be a problem if firewalls are not
implemented correctly. We can have rules to fix that in Snort.
[image:22.612.108.508.424.653.2]18
Not only we can see the alert in Sguil but we can also go back to Kibana and Squert for
looking at the log. If we look closely we can see that we event detected the source
address form the unauthorized source Figure. If we go to Squert we can see the
previous alerts from the Nmap and the trip alert. By clicking in the summary we can see
[image:23.612.111.502.191.400.2]more detail information about each of the alerts.
[image:23.612.115.498.445.656.2]Figure 13 Unauthorized Trip alert in Kibana
19
5.1.3 Anomaly detection from Authorized Source
[image:24.612.116.498.145.381.2]For this part a rule was created that will be triggered once the relay has been tripped 3 time under 30 seconds
Figure 15 Anomaly Trip alert in Squert
5.2 Evaluation of Security onion
Security Onion is a powerful tool. It comes with so many functions and software. It
provides the user with an easy to learn environment. It makes the interaction between the
IDS such as Snort easier to see and to keep track of the alerts in files to go back to. It
also lets you easily configure option to the user liking. It has a great community so if you
get stuck in an application you can find the answer online. Easy to install in any
environment as long as the connections are connected right. It lets you to fast update
your rules for detection.
Some of the disadvantages of Snort is that it takes some time to load the rules fast
enough and you end up triggering previous rules. It takes a little time for first time users to get used to all the tools. Some of the tools don’t have a guide so you need to go online
20
Timing was taken for each of the rules we created to evaluate how fast we can get
the alerts. We triggered 4 of the rules. As we can see in figure 14 Security Onion did a
pretty good job at alerting. What took the most time was nmap figure 15 since it looks for
[image:25.612.108.469.169.386.2]all the ports in the substation.
[image:25.612.105.470.176.638.2]Figure 16 Timing of rules
21
We then did a test with more relays connected to the RTU. We can see from figure
16 that there is a small bump in the detection since it takes longer to look for the pattern
because of more packets going back in forward between the RTU and the control center.
[image:26.612.108.467.187.404.2]
Figure 18 Trip alert detection with 4 relays
CHAPTER 6 Conclusion
We have provided an easy solution to help detect and monitor traffic for SCADA
systems. Having a system that can provide visualization of data can help the operator
inside the substation be ready to respond to anomalous behavior is key to safe and secure
environment. While Security Onion is not a SIEM solution it mirrors one that can also be
integrated with a Intrusion detection system such as Snort. More open source tools are
available online such as Grass marlin can be added to this system to strengthen
22
References
[]Karlzen, Henrik. An Analysis of Security Information and Event Management Systems (Master’s Thesis) University Of Gothenburg, January 2009
[1] Kabita Agrawal, Hemant Makwana. A Study on Critical Capabilities for Security
Information and Event Management, 2015
[2] J. Glenn, „Security beyond the SIEM,“ 2015. [Võrgumaterjal]. Available:
http://pages.arbornetworks.com/BeyondtheSIEMOnDemand-View.html.
[3] Debar H. and Viinikka J., Intrusion Detection: Introduction to Intrusion Detection and
Security Information Management, France Telecom Division R&D, FOSAD 2004/2005,
LCNS 3655, pp.207-236, Springer-Verlag, 2005
[4] https://snort.org
[5] https://securityonion.net
[6] www.DNP3.org
[7] Samuel East, Jonathan Butts, Mauricio Papa, and Sujeet Shenoi, A Taxonomy of
Attacks on the DNP3 Protocol, Critical Infrastructure Protection III, Springer Berlin
Heidelberg, 2009.67-68.
[8] Ihab Darwish, Obinna Igbe, Orhan Celebi, Tarek Saadawi, Joseph Soryal, Smart Grid
DNP3 Vulnerability Analysis and Experimentation, 2015 IEEE 2nd International
Conference on Cyber Security and Cloud Computing, 2015
[9] Juan Enrique Rubio, Cristina Alcaraz, Rodrigo Roman, Javier Lopez, Analysis of
Intrusion Detection Systems in Industrial Ecosystems, 14th International Conference on