HIGH RECOVERY BRACKISH WATER DESALINATION PROCESS David Hasson, Dmitry Lisitsin, Raviv Segev, Raphael Semiat
Rabin Desalination Laboratory,
Technion – Israel Institute of Technology, Technion City, Haifa 32000
E-mail: David Hasson <hasson@tx.technion.ac.il>, Rafi Semiat <cesemiat@tx.technion.ac.il>
ABSTRACT
The main objective of the present project is to improve the economics of reverse osmosis brackish water desalination processes by developing techniques enabling higher water recoveries than currently possible. The potential benefits of an increased water recovery are both economic and environmental. Increased recovery augments the desalinated water production and acts to lower costs. More important, increased recovery reduces the waste volume, thus alleviating the environmentally problematical and costly issue of safe waste discharge.
The limitation which restricts the water recovery level arises from the presence of sparingly soluble salts in the raw water, notably CaSO4 and CaCO3. Such scaling salts can
easily exceed their solubility limits during the permeation of salt free water and precipitate on the RO membrane, leading to unacceptable losses in water production. To allow meaningful water recoveries, the precipitation thresholds of scaling salts are extended by pretreating the raw feed waters with trace concentrations of inhibiting compounds (“anti-scalants”) capable of delaying the onset of precipitation.
The basic principle of the GWRI approach for augmenting water recovery levels is to extract additional permeate from the brine concentrate after precipitating and separating the scaling salts held in solution by the anti-scalant. The major obstacle to overcome is the stabilizing effect of the anti-scalant which prevents precipitation of scale forming ions from supersaturated solutions. The main research efforts were directed to the development of viable techniques enabling effective precipitation and separation of scaling salts from anti-scalant stabilized solutions. Several techniques for destabilizing supersaturated solutions of scale forming ions were identified.
The industrial potential of promising a high recovery process is currently investigated in field tests carried out jointly with two prominent Israeli desalination companies – GES and IDE. A pilot plant has recently been constructed at the site of the Atlit Desalination Plant.*
1. INTRODUCTION
It is widely recognized that alleviation of the water shortage problem afflicting Israel and numerous other countries depends on the availability of affordable desalination processes. Brackish water desalination which is less expensive than sea water desalination has a special potential for more widespread use through process improvements. The objective of this project is to improve the economics of brackish water desalination by developing a process enabling increased water recovery (i.e. increased fractional yield of the water extracted from the raw water feed). The potential benefits of an increased water recovery are both economic and environmental. Increased recovery augments the desalinated water production and acts to lower costs. More important, increased water recovery reduces the concentrate volume, thus alleviating the environmentally problematical and costly issue of safe concentrate discharge.
The limitation which restricts the water recovery level arises from the presence of sparingly soluble salts in the raw water, notably CaSO4 and CaCO3. Such scaling salts can
[image:2.595.90.524.474.725.2]easily exceed their solubility limits and precipitate on the RO membrane, leading to unacceptable losses in water production. To allow meaningful water recoveries, the precipitation thresholds of scaling salts are extended by pretreating the raw feed waters with trace concentrations of inhibiting compounds (“anti-scalants”) capable of delaying the onset of precipitation. Currently, the maximum water recovery is constrained by the maximum supersaturation level that can be maintained in the presence of an anti-scalant.
Fig. 1. Schematic diagram of enhanced water recovery desalination process. Brackish
Water
Scale Precipitation AS Dosage
Secondary RO
AS Dosage Primary
Permeate
Secondary Permeate Final
Product
Concentrate Discharge
Scale Discharge
An increase in the water recovery level can be achieved by neutralizing the anti-scalant ability to hold the scaling species in a stable supersaturated state, precipitating the scaling salts and extracting additional permeate from the concentrate (Fig. 1). The main problem to overcome is the considerable stability imparted to the dissolved scaling species by the anti-scalant molecules. Thus, to achieve an improved brackish desalination process of high water recovery it is necessary to develop techniques enabling effective neutralization of the inhibitory capacity of the anti-scalant and suitable precipitation of the scaling salts in a morphology that allows easy separation of the crystallized particles.
Research efforts were directed to the exploration of promising techniques for destabilizing solutions of ions forming CaCO3 and CaSO4 scales, held in a stable
supersaturation state by the anti-scalant molecules. The techniques investigated included pH increase, seeded precipitation, use of coagulating agents, use of destabilizing surfactants and electrolytic precipitation of CaCO3.
2. STUDY OF ANTI-SCALANT DESTABILIZATION PHENOMENA
[image:3.595.80.516.423.523.2]Three widely used anti-scalants listed in Table 1 were utilized to stabilize solutions of CaCO3 and CaSO4.
Table 1. Tested anti-scalants.
Anti-scalant Denoted by Composition
Acumer 5000 (Rohm and Haas) AS1 Carboxylate-sulfonate balanced hydrophile-lipophile multi polymer Calgon, SHMP (BDH) AS2 Sodium hexa-metaphosphate Permatreat 191 (Houseman) AS3 Phosphonate
2.1 Destabilization of CaCO3 solutions
The experiments were carried out with solutions simulating concentrates emanating from the “Gat” desalination plant at 88% recovery (Table 2). Initial solution supersaturation levels investigated were in the range of LSI=1.8-2.8, obtained by adjusting the pH to values of 7.0-7.8. The de-supersaturation process was characterized by measurements of ΔCa, the amount of precipitated calcium in units of PPM as CaCO3, versus time.
Table 2. Simulated "Gat" concentrate solution. PPM Ion
PPM Ion
1.3 CO3-2
680 Ca+2
2890 HCO3-
540 Mg+2
5300 Cl-
2708 Na+
[image:3.595.173.422.649.737.2]Destabilization by seeding
Seeding experiments were carried out with analytical reagent grade CaCO3 powder
having a mean surface diameter D3,2 of 1.5 μm. The data in Fig. 2 illustrate the
de-supersaturation achieved by a seeds concentration of 10 g/L in solutions stabilized by the addition of 25 PPM of each of the tested anti-scalants. It is seen that that seeding was able to supersaturate solutions of all the tested inhibitors but at different rates. The slowest de-supersaturation process was obtained with AS2 (Calgon) which we have found, in many of our researches, to impart the highest stability to CaCO3 solutions. The data in Fig. 3,
measured in solutions stabilized by 25 PPM Calgon (SHMP), show that the effectiveness of the precipitation process can be appreciably enhanced by increasing the seeds concentration. Destabilization by surfactants
Exploratory experiments disclosed that the cheap and widely used anionic surfactant Sodium Dodecyl Sulphate (SDS) CH3(CH2)11OSO3Na can induce a marked destabilization
effect. The desupersaturation of solutions containing 25 PPM of each of the three tested anti-scalants was monitored by measuring ΔCa, the calcium concentration decrease with time at various surfactant concentrations. The data of Figs. 4 and 5 show that the most stabilizing anti-scalant is Calgon which required over 300 PPM SDS for accomplishing a significant degree of destabilization; the least stabilizing anti-scalant is AS1 (Acumer 5000), which was effectively deactivated by an SDS concentration as low as 30 PPM.
600 700 800 900 1000 1100 1200 1300 1400
0 5 10 15 20 25 30
AS2, 10 gr/L seeds AS1 , 10 gr/L seeds
AS3 , 10 gr/L seeds
Δ
Ca,
PP
M
a
s
C
aC
O
3
Time , hr
0 200 400 600 800 1000 1200
0 5 10 15 20 25 30
AS2 , 2.5 gr/L seeds
AS2, 5 gr/L seeds
AS2, 10 gr/L seeds
AS2 , 20 gr/L seeds
Δ
Ca
,
PP
M
as
C
aCO
3
[image:4.595.314.530.470.688.2]Time , hr
Fig. 2. Addition of CaCO3 seeds to solutions
stabilized by different antiscalants.
[image:4.595.78.297.470.691.2]0 200 400 600 800 1000 1200 1400
0 5 10 15 20 25 30
Blank
20 PPM
15 PPM
74 PPM
30 PPM
Δ
Ca ,
PP
M
as
C
aCO3
Time, hr
0 100 200 300 400 500 600 700
0 50 100 150 200 250
Blank
25 PPM
101 PPM
201 PPM
300 PPM
Δ
Ca
, PP
M
a
s CaCO3
[image:5.595.60.285.73.300.2]Time , hr Fig. 4. Effect of surfactant on the rate of
precipitation in the presence of Acumer 5000 Fig. 5. Effect of surfactant on the rate of precipitation in the presence of Calgon
Destabilization by coagulants
Destabilization by coagulants was found to be fairly ineffective in the case of CaCO3.
Destabilization by alkali addition
A very effective way for inducing the precipitation of CaCO3 in the presence of an
anti-scalant is to increase the supersaturation level of the solution beyond the inhibition capability of the anti-scalant. Thus, one way of precipitating the CaCO3 is by dosage of an alkali such as
NaOH, which can readily induce a very high CaCO3 supersaturation level by converting the
HCO3-1 ion to the CO3-2 form. Table 4 shows the degree of precipitation achieved by dosage
of increasing amounts of NaOH to solutions of Table 2 stabilized by 50 PPM of the anti-scalant AS1.
Table 3. CaCO3 precipitation induced by NaOH addition.
NaOH added
Mmol/L
Initial solution
pH
Dissolved calcium
Mmol/L
Precipitate d CaCO3
Mmol/L
NaOH added/ CaCO3
precipitated
Mmol/Mmol
0 7.76 17 0 -
20 8.82 9.5 7.5 2.7
27 9.23 6 11 2.5
[image:5.595.309.527.74.302.2] [image:5.595.140.456.594.722.2]Destabilization by CO2 desorption
For concentrate solutions having high carbonate content, there is an interesting possibility for a pH increase without usage of chemicals. Desorption of the acidic CO2
component from the dissolved carbonate species by air sparging acts to raise the pH level of the solution. Fig. 6 illustrates the development of alkaline conditions by CO2 desorption from
a solution having the following initial composition: Ca2+ = 112 PPM, TAlk = 350 PPM as
CaCO3, pH = 7, Ionic Strength = 0.036 mol/L and LSI = 0.1. The initial total carbon of the
solution is 8.29 mM. It is seen that desorption of less than 2 mmol/L of CO2, which represents
less than 25% of the initial CT, increases the pH level from 6.9 to 9.0 thereby increasing the
CO32- concentration by a factor as high as 100. The end effect is an increase of the
supersaturation level by the same factor (from LSI = 0.1 to LSI = 2.1).
Fig. 7 shows pH values that can be achieved by air sparging of CO2 in solutions having
total carbonate alkalinities in the range of 250 to 2500 PPM as CaCO3. The higher pH values
plotted in Fig. 7 are maximum levels corresponding to the theoretical condition of solution equilibrium with the CO2 content of ambient air ([CO2]residual/[CO2]eq = 1). In this ideal case, a
total alkalinity exceeding 400 PPM is sufficient for inducing a pH level above 9. The lower pH values plotted in Fig. 7 are for the more realistic case of partial CO2 desorption
corresponding to the condition of [CO2] residual/[CO2]eq= 5. In this case, a pH value above 9
can only be obtained with a total alkalinity exceeding 2500 PPM as CaCO3.
0.001 0.01 0.1 1 10
0 0.5 1 1.5 2
Amount of desorbe d CO2 (mmol)
C
a
rb
o
n
sp
eci
es co
n
c
. (
m
m
o
l/
li
t)
6.5 7 7.5 8 8.5 9 9.5
p
H
l
evel
C O2 C O3 Total carb on pH level
8.0 8.4 8.8 9.2 9.6
0 500 1000 1500 2000 2500
Tota l a lkalinity (PPM a s CaCO3)
M
a
x
im
a
l pH
v
a
lue
[image:6.595.310.544.488.710.2][CO2]/[CO2]e q = 1 [CO2]/[CO2]e q = 5
Fig. 6. Effect of CO2 desorption on the pH and on
the carbon species distribution (TAlk = 350 PPM as
CaCO3).
Fig. 7. Theoretical and actual pH levels that can be achieved by CO2 desorption from solutions of
[image:6.595.52.280.489.709.2]2.2 CaSO4 anti-scalant destabilization phenomena
The concentrate stream emanating from the "Ktziot" desalination plant has a potential for CaSO4 scaling (Table 4). Anti-scalant destabilization tests were carried out with simulated
[image:7.595.70.537.458.660.2]"Ktziot" solutions stabilized by 25 PPM of the anti-scalant AS3 (Table 1). Table 4. Simulated "Ktziot" concentrate solution. Component Concentration
(PPM)
Component Concentration (PPM)
Ca+2 2674 SO42- 8387
Mg2+ 1242 Cl- 25139
Na+ 14726 SiO2 207
K+ 350 AS3 25
pH = 6.55 ; T = 30–310C ; SI (Gypsum) = 3.87
It is interesting to note that destabilization by surfactants which was very effective in case of CaCO3 failed to destabilize CaSO4 solutions. Other approaches were, therefore, tried.
Destabilization by seeding
Destabilization experiments were performed by adding to the solution 5 g/L of CaSO4
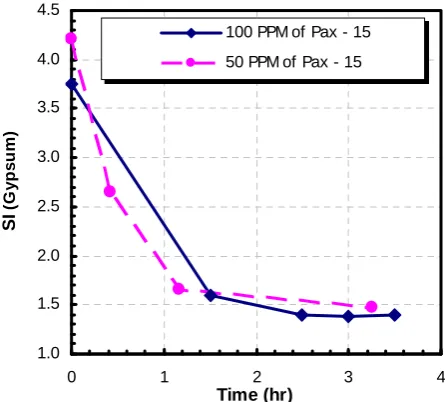
seeds – either fresh seeds or seeds contaminated by the anti-scalant AS3. Measurements of the Ca2+ ion depletion with time (Fig. 8) show that both fresh and contaminated seeds induced rapid precipitation. However, the saturation ratio data plotted in Fig. 9 indicate that that precipitation was arrested at a pseudo steady state of SI = 1.4 – 1.5.
0 500 1000 1500 2000 2500 3000
0 1 2 3 4 5
Time (hr)
D
iss
o
lve
d
C
a
2+ (P
P
M
)
5 g/L fresh CaSO4 seeds
5 g/L contaminated CaSO4 seeds
1.0 1.5 2.0 2.5 3.0 3.5 4.0 4.5
0 1 2 3 4 5
Time (hr)
SI
(
G
yp
su
m
)
5 g/L fresh CaSO4 seeds
5 g/L contaminated CaSO4 seeds
Fig. 8. Ca2+ depletion in the presence of fresh and contaminated CaSO4 seeds.
Fig. 9. Supersaturation level decay in the presence of fresh and contaminated CaSO4 seeds.
Destabilization by coagulant addition
supersaturated solutions of scale forming ions might be due to the creation of a charged nano-size colloidal solution.
Colloidal solutions are commonly destabilized by coagulating agents. Treatment of the solutions by dosage of the most common flocculating agents - AlCl3 and FeCl3 – resulted in a
rather slow precipitation process. However, dosage of 50 and 100 PPM of the coagulant poly-aluminum chloride PAC-16S showed rapid precipitation similar to that obtained by seeds addition (Figs. 10-11). In this case also, the precipitation process was again arrested at the same SI level of 1.4 – 1.5.
3. CONTINUOUS FLOW CaCO3 PRECIPITATION
3.1 Electrolytic precipitation of CaCO3
The scale removal principle of the electrochemical technique is based on the creation of a high pH environment around the cathode by water and oxygen reduction reactions which release hydroxyl ions. The alkaline environment induces precipitation of the calcium hardness in the form of CaCO3 and of the magnesium hardness, in the form of Mg(OH)2.
Although the possibility of electrolytic scale removal has long been recognized, industrial application of this technique is rather limited and technical information in the literature is scant. Our study of electrolytic removal of various scale species yielded results indicating a marked potential for this technology to expand the rather limited scope of viable scale control techniques.
Below is a summary of results demonstrating the effectiveness of the electrolytic technique in precipitating CaCO3 from anti-scalant stabilized solutions. Fig. 12 shows the
0 500 1000 1500 2000 2500 3000 3500
0 1 2 3 4
Time (hr)
D
iss
o
lved
C
a
2+
(P
P
M
)
50 PPM of Pax - 16
100 PPM of Pax - 16
1.0 1.5 2.0 2.5 3.0 3.5 4.0 4.5
0 1 2 3 4
Time (hr)
SI
(
G
yp
su
m
)
100 PPM of Pax - 15
[image:8.595.328.551.249.450.2]50 PPM of Pax - 15
Fig. 10. Ca2+ depletion in the presence of
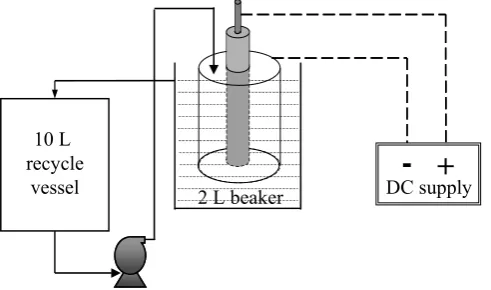
[image:8.595.78.309.250.455.2]bench scale system used in these tests. The electrolytic cell was constructed from a stainless steel tube having an internal diameter of 56.1 mm serving as a cathode and a central titanium rod of 25.3 mm diameter, serving as a Dimensionally Stable Anode. The cell was immersed in a 2 L glass beaker. Tests were carried out by recycling a solution held in a 10 L vessel. The solution entered the top of the annular passage of the electrolytic cell, drained into the 2 L glass beaker and overflowed into the 10L recycle vessel. The tests were conducted at room temperature (25-28oC). The scale deposition rate was determined by periodic analyses of the recycling solution.
+
-DC supply 2 L beaker
10 L recycle
[image:9.595.176.422.238.383.2]vessel
Fig. 12. Bench scale electrolytic scale removal system.
A series of experiments was carried out in order to obtain design data for an electrochemical cell treating a typical carbonate concentrate recycle solution containing a high anti-scalant concentration. The anti-scalant used was Calgon (SHMP). The effect of current intensity on the specific area requirement and the specific energy consumption was determined from runs conducted at various currents in the range of 0.08 – 2.5 A obtained by DC supply of 2.5 V at the lowest current and 8.4 V, at the highest current.
The initial solution composition was as follows: Ca+2 = 11.8 mmole/L, Talk = 1900 PPM
as CaCO3, Na+ = 105.2 mmole/L, Cl- = 92.0 mmole/L, LSI = 1.4, SHMP = 30 PPM. The
solution was kept at a pH of 7.6 throughout the test by pH controlled CO2 sparging. The flow
rate of the solution recycling through the annular passage of the cell was 2.3 L/min corresponding to a Reynolds number of 700.
Important design information is given in Fig. 13 which relates current density with both the specific cathodic area requirement (m2 per kg CaCO3/hr) and with the specific energy
requirement (kWh per kg CaCO3 precipitated). As anticipated, increase of the current density
0 3 6 9 12 15 18 21 24
0 0.02 0.04 0.06 0.08 0.1 0.12 0.14 0.16
0 20 40 60 80 100 120
E [k
W
*h
r/
k
g
C
a
C
O
3
]
W [
m
2*h
r/
g
r Ca
CO
3
]
i [A/m2]
m2*hr/gr CaCO3 kW*hr/kg CaCO3
Fig. 13. Effect of current density on the specific energy consumption and the specific electrode area.
3.2 Continuous CaCO3 crystallization system
[image:10.595.132.458.71.338.2]The continuous flow precipitator system consisted of a 120 L feed tank holding the tested supersaturated solution and a 20 L MSMPR crystallizer enabling operation over a wide range of retention times (Fig. 14). The feed solution simulated a concentrate emanating from the “Gat” desalination plant at 88% recovery (Table 2). The system was simplified by excluding the Mg+2 ion which can affect the kinetics and morphology of CaCO3 precipitation.
[image:10.595.76.482.500.712.2]Characterization of different treatments
The destabilization effect obtained by alkali dosage was tested by carrying a series of runs at increasing pH levels obtained by different NaOH dosage rates. The runs were conducted at a constant retention time of 4.3-4.4 hr and a constant AS2 (Calgon) feed concentration of 10 PPM. Fig. 15 shows that the increased supersaturation induced by NaOH dosage had indeed a very substantial effect on the degree of conversion of the CaCO3
precipitation reaction. The addition of 0.91 g/L of NaOH provides almost full conversion of the precipitation reaction; the residual Ca++ of 78% obtained in the absence of NaOH dosage is reduced to the level of 2%.
0 200 400 600
0 1 2 3 4 5 6
Dimensionles residence time t/τ
Ca
++
(
PPM
)
No NaOH addition NaOH 0.23 gr/lit NaOH 0.91 gr/lit
0 200 400 600
0 1 2 3 4 5 6
Dimensionles residence time t/τ
Ca
++ (
PPM
)
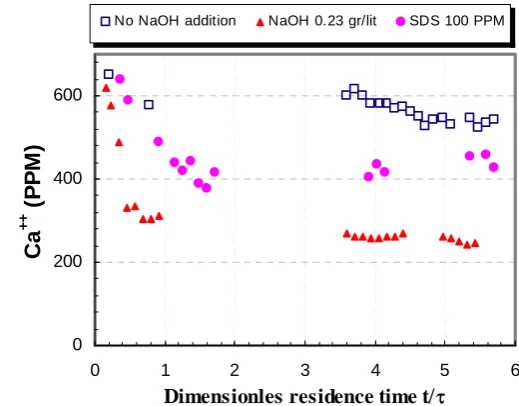
[image:11.595.28.562.176.461.2]No NaOH addition NaOH 0.23 gr/lit SDS 100 PPM
[image:11.595.302.562.260.463.2]Fig. 15. Effect of NaOH addition rate on the residual Ca2+ level.
Fig. 16. Residual Ca2+ levels under different conditions.
Fig. 16 compares destabilization effects of different processes. Addition of 100 PPM of the surfactant SDS lowered the residual Ca2+ from 78% to 63%. Alkali addition was much more effective– dosage of 0.23 g/L NaOH lowered the residual Ca2+ from 78% to 37%.
Continuous flow experiments conducted in an air stripping crystallizer with "Gat" concentrate solutions confirmed that pH increase by aeration can also induce effective precipitation of CaCO3 in the presence of anti-scalants. This is illustrated in Fig. 17 which
displays residual Ca and TAlk levels in continuous flow precipitation of "GAT" concentrate at
a retention time of 2 hr.
4. CONCLUDING REMARKS
[image:11.595.36.291.261.459.2]0 100 200 300 400 500 600 700 800
0 1 2 3 4 5
Dim ensionle ss time (t/τ)
R
esi
d
u
a
l C
a
++
(P
P
M
)
0 500 1000 1500 2000 2500
Resi
d
u
al
T
Al
k
(
P
P
M
as CaC
O
3
)
Re s idual Ca2+
Re s idual Talk
[image:12.595.170.423.96.328.2]120-130 PPM Ca2+ 1000-1060 PPM as CaCO3
Fig. 17. Residual Ca2+ and TAlk for "GAT" concentrate
solution at a retention time of 2hr.
They are participating in a joint project aiming to explore the industrial potential of Technion's results and are contributing complimentary funding to the R&D budget provided by the BMBF - MOST program. A pilot plant has recently been constructed at the site of the Atlit Desalination plant. The concentrate emanating from the Atlit plant is used for testing the increased water recovery level that can be achieved by the process improvements developed at Technion.
Acknowledgments