Ionospheric storm effects in the nighttime E region caused
by neutralized ring current particles
R. Bauske1, S. Noe¨l2, and G. W. Pro¨lss
Institut fu¨r Astrophysik und Extraterrestrische Forschung, Universita¨t Bonn, Auf dem Hu¨gel 71, D-53121 Bonn, Germany
1Now at: Space Physics Research Laboratory, Department of Atmospheric, Oceanic and Space Science, University of Michigan, 2455
Hayward Street, Ann Arbor, Michigan, 48109–2143, USA
2Now at: Institut fu¨r Fernerkundung, Physik und Elektrotechnik, Fachbereich 1, Universita¨t Bremen, Postfach
33 04 40, D-28334 Bremen, Germany
Received: 13 May 1996 / Revised: 18 November 1996 / Accepted: 19 November 1996
Abstract. During magnetic storms an anomalous in-crease in the ionization density of the nighttime E region is observed at low and middle latitudes. It has been suggested that this effect is caused by the precipitation of neutralized ring current particles. Here a coupled ring current decay–ionosphere model is used to confirm the validity of this explanation.
1 Introduction
The electron density in the lower ionosphere is known to increase during magnetically disturbed nights (e.g. Haubert, 1959; Wakai, 1967; Rowe, 1973, 1974; Shen
et al., 1976; Voss and Smith, 1979; Batista et al., 1991;
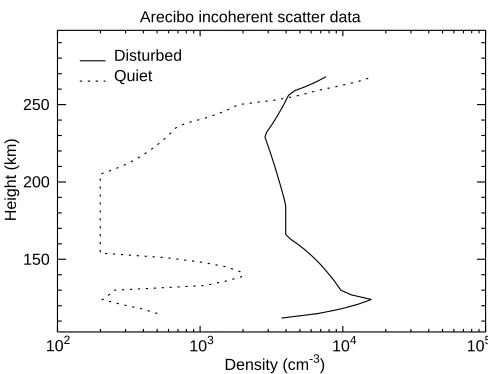
Morton and Mathews, 1993). Figure 1 illustrates this effect using incoherent scatter data from Arecibo (Rowe, 1974). Compared are electron density profiles obtained near midnight during quiet and severely disturbed conditions. As is evident, there is a very significant storm induced increase of the ionization density in the 110 to 250 km altitude range.
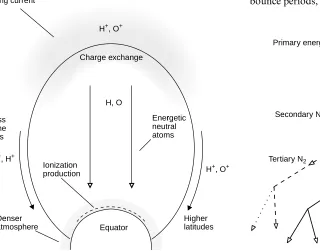
Hirao et al. (1965) suggested energetic particle pre-cipitation as a possible cause of these density enhance-ments, however without specifying the particle species, their energy or origin. Later Lyons and Richmond (1978) and Tinsley (1979) argued that these particles are most likely neutral atoms in the energy range 1–100 keV which originate from the ring current. The disturbance scenario envisaged by these authors is illustrated in Fig. 2. During magnetic storms a considerable amount of energy is injected into the ring current of the inner magnetosphere. Part of this energy is transmitted to the upper atmosphere by neutralized ring current particles. It is the precipitation of these neutralized ring current particles which is held responsible for the ionization density enhancements at middle and lower latitudes. The
associated production rate was estimated by Lyons and Richmond (1978) to be of the order of 10–100 cm)3s)1at 30°magnetic latitude during the main phase of a larger storm. This estimate was based on particle flux measure-ments by Mizera and Blake (1973) and model calcula-tions by Pro¨lss et al. (1973) and Pro¨lss (1973). Production rates of this magnitude were previously shown to be sufficient to explain the E-region density enhancements observed at Wallops Island (Smith et al., 1974).
The present study combines a ring current decay model and an ionospheric model to investigate the disturbance scenario mentioned above more closely. First, a Monte Carlo type simulation is used to calculate the ionization produced by precipitated neutralized ring current particles. Subsequently, this production rate is fed into an ionospheric model to determine the resulting density enhancements at E region heights.
Correspondence to: G. W. Pro¨lss
Arecibo incoherent scatter data
102 103 104 105
Density (cm )-3 150
200
250
Height
(km)
Disturbed
[image:1.612.307.551.503.690.2]Quiet
2 Ionization production by neutralized ring current particles
To determine the ionization production by neutralized ring current particles, the decay of the magnetospheric ring current is simulated using a Monte Carlo type calculation. The details of this simulation were already discussed by Noe¨l and Pro¨lss (1993). To summarize briefly, at the beginning of a simulation a large number of ring current ions is located in the inner magneto-sphere. Here, these particles gyrate around and oscillate along the magnetic field lines until they are neutralized in a charge exchange collision. Once neutralized, they are no longer constrained to follow the magnetic field lines but continue their travel along a straight trajectory away from the ring current. If they head towards Earth, they impinge upon the denser atmosphere and interact with gas particles via elastic and inelastic collisions. In each of these collisions, they lose some of their energy, part of which is consumed in ionizing collisions. This way the ring current particles random walk through the upper atmosphere until they have dissipated their energy or until they have escaped from the denser atmosphere. Complications arise from the fact that the incident particles themselves may be reionized, upon which they resume their spiral motion along the local magnetic field line until they are neutralized again, see Fig. 3. Further-more, the energy transfer in a collision may be so large that a secondary energetic particle is generated which in turn may produce a tertiary energetic particle, and so on, see Fig. 4. These higher order energetic particles play an important role in the energy dissipation process and are treated in the same manner as the primary particles. The most recent version of our simulation algorithm contains a number of improvements over our earlier
model (Noe¨l and Pro¨lss, 1993). For example, the initial radial distribution of the ring current ions is now taken directly from satellite measurements. Also the pitch angle distribution is now assumed to be isotropic at all points along the magnetic field line, in agreement with the observations. Furthermore, the initial position of the ring current particles is fixed by choosing, within the bounce periods, the time at which the particles first cross
Higher
latitudes
Denser
atmosphere Equator
H, O H , O+ +
O , H+ +
H , O+ + Charge exchange
Enerrgetic
neutral
atoms
Loss cone
ions
Ionization production
[image:2.612.309.540.56.331.2]Ring current
Fig. 2. Ionization production by neutralized ring current particles
H
H H
H+
H+
N+2
e
-e
-O+
B B
Primary energetic
particle
Charge exchange collision
Charge exchange collision
Ionizing collision
Ionizing collision
Electron loss
[image:2.612.58.378.468.719.2]Electron loss
Fig. 3. Energetic hydrogen particle trajectory in the upper atmosphere. The vector B indicates the direction of the local magnetic field
Primary energetic oxygen particle, O
Secondary O Tertiary O Secondary N2
Tertiary N2
e
-Ionizing collision
ESCAPE
[image:2.612.257.523.502.724.2]N+2
the equatorial plane at random. This determines the location of the particles along the magnetic field line at time t0. We have also updated our charge exchange cross sections. Instead of extrapolating the measure-ments of Fite (1964) to higher energies, we now use the cross sections given in Fok et al. (1993). Finally, we now also allow for the ionization of H, O, and N2particles by energetic H and O ions. The changes above lead to a general reduction of the rate of energy deposition in the upper atmosphere and also shift the location of maxi-mum energy injection towards higher latitudes.
To run the Monte Carlo model, the properties of the ring current have to be specified. Our first simulation is based on AMPTE satellite measurements recorded du-ring the magnetic storm on April 20/21, 1985 at about 22 : 00 local time (see Gloeckler and Hamilton, 1987). These measurements refer to Dst indices in the range
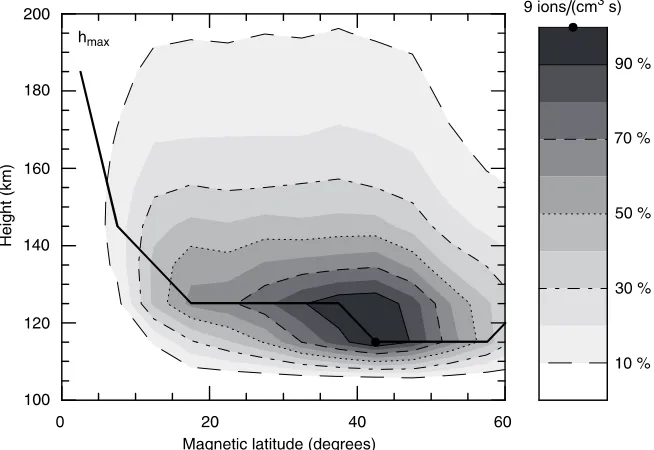
)89 to)127 nT. The result of this simulation is shown in Figure 5. The average ionization production rates presented in this figure apply to the first 4 hours of the simulation excluding the initial five minutes which are dominated by the decay of loss cone ions. As is evident, significant production rates are attained in an extended region between 25 and 50 degrees magnetic latitude and 115 to 135 km altitude. Here the production rate exceeds 6 ions/cm3s. The exact distribution depends somewhat on the time interval considered. Thus during the first 55 minutes, the time averaged maximum production rate is approximately 15 ions/cm3s, whereas during the last two hours it decreases to about 7 ions/cm3s. At the same time, the center of ionization production moves from 57.5°to 42.5°magnetic latitude.
The relatively low altitude of the maximum indicates that it is mostly the hydrogen particle component which is responsible for the ionization production. This is understandable since the hydrogen particles carry most of the ring current energy at the time of the AMPTE measurements (22 : 00–01 : 00 UT) and their ionizing
cross sections are larger than those of the oxygen particles.
3 E region effects
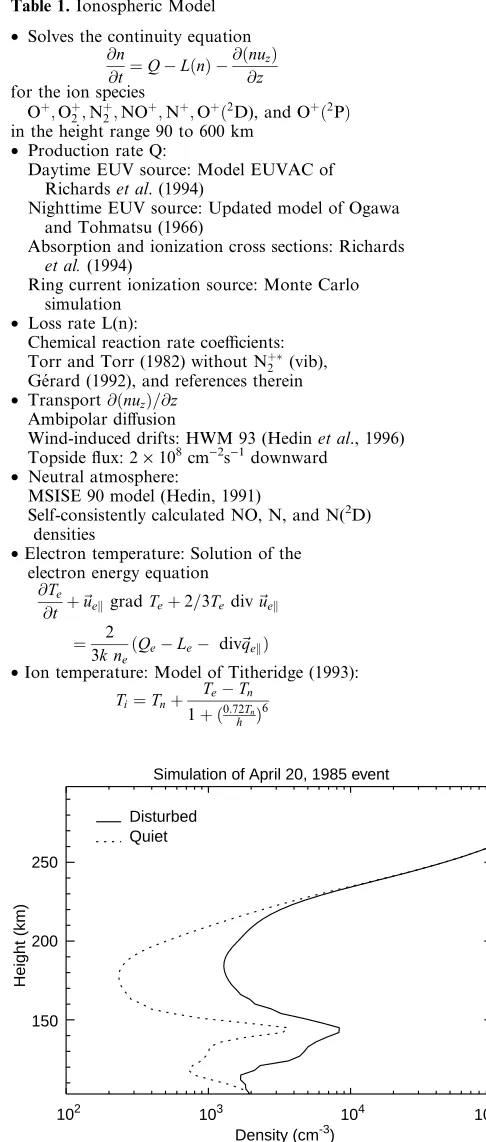
To evaluate the significance of the ionization production by precipitated neutralized ring current particles, the results of the Monte Carlo simulation are fed into an ionospheric model. The general properties of this model are summarized in Table 1. The ionospheric simulation is performed for a location near Arecibo at 30°magnetic latitude and for conditions on April 20, 1985, the day of the ring current measurements. Since these measure-ments refer to 22 : 00 LT, this time was chosen to switch on the ring current ionization source. One and a half hours later (i. e. at the time of the Arecibo measurements at 23 : 30 LT) the ionization density in the E and F1 regions has increased significantly, as is illustrated in Fig. 6. For comparison, this figure also shows the results of a model run for the same general conditions but without the additional ring current ionization source. Obviously, there is good qualitative agreement with the observations. By adjusting the wind profile and the nighttime radiation source, this agreement could be further improved. This, however, is not of interest here. What is important is that our simulation reproduces the storm-induced enhancement of the ionization density in E and F1 regions, which at 180 km altitude reaches a factor of more than five. The temporal development of this density increase is illustrated in Figure 7.
[image:3.612.47.374.60.285.2]current particles enhances these layers and also reduces their downward motion. In fact, a slight stabilization at heights near 130 km may be noticed in Fig. 7.
Compared with the observations shown in Fig. 1, the simulated storm time ionization density appears to be somewhat too small. It should be noted, however, that during the Arecibo measurements the Dst index reached values of nearly)200 nT, whereas our simulation results are based on ring current data recorded at Dst values between )89 and )127 nT. To check on the magnetic activity dependence of our results, an additional simu-lation is performed. This time, AMPTE satellite mea-surements obtained during the storm of February 9, 1986 are used as input to the Monte Carlo simulation. These measurements refer to Dst indices in the range between )202 and)286 nT. The model ring current is injected at 21 : 00 LT, i.e. at the time of the AMPTE measurements. Again, the ionization production rates predicted by the Monte Carlo simulation are fed into the ionospheric model. In Fig. 8 the resulting ionization densities at 21 : 30 LT are compared to the results of a reference simulation performed without the ring current ionization source. As is evident, the ionization density now even exceeds that observed at Arecibo during the October storm. Again, it is primarily the quiet-time be-haviour which is not reproduced very well.
4 Summary
This study investigates the effect neutralized ring current particles have on the ionization density of the nighttime E region. First, a Monte Carlo type simulation is used to determine the additional ionization produced by these particles. It is found that the production rate maximizes in an extended region between 25 and 50 degrees mag-netic latitude and in an altitude range between 115 to 135 km. For moderate magnetic activity ()89 nT≥Dst≥
)127 nT), peak production rates exceed 15 ions/cm3s. Fed into an ionosphere model, these production rates cause the nighttime E-region density to increase by a factor of up to 5. For more severely disturbed conditions ()202 nT ≥ Dst ≥ )286 nT), the E region density becomes larger than 5× 103 cm)3, in good agreement with the observations. It is concluded that indeed the precipitation of neutralized ring current particles is responsible for the positive ionospheric storm effects observed in the nighttime E region at middle and lower latitudes, as was suggested by Lyons and Richmond (1978) and Tinsley (1979).
Acknowledgements. We thank George Gloeckler and the World Data Center-A for Rockets and Satellites for providing the AMPTE/CCE data. This research was supported by the Deutsche Forschungsgemeinschaft under grants Pr 276/6-2, Pr 276/3-1,2 and No 285/1-1.
Topical Editor D. Alcayde´ thanks R. L. Lyons and M. -C. Fok for their help in evaluating this paper.
Simulation of April 20, 1985 event
150
200 250
Height
(km)
Disturbed
Quiet
102 103 104 105
[image:4.612.40.283.58.629.2]Density (cm )-3
Fig. 6. Electron density profiles calculated for a location near Arecibo at 30°magnetic latitude with (disturbed) and without (quiet) the ring current ionization source. The model ring current decay was assumed to begin at 22 : 00 LT, and the electron density profiles were obtained 1 1/2 hours later at 23 : 30 LT. The general conditions apply to the day of the ring current measurements, i.e. April 20, 1985
Table 1. Ionospheric Model
• Solves the continuity equation @n
@tQÿL n ÿ @ nuz
@z for the ion species
O;O2;N2;NO;N;O 2
D), and O 2P in the height range 90 to 600 km
• Production rate Q:
Daytime EUV source: Model EUVAC of Richards et al. (1994)
Nighttime EUV source: Updated model of Ogawa and Tohmatsu (1966)
Absorption and ionization cross sections: Richards et al. (1994)
Ring current ionization source: Monte Carlo simulation
• Loss rate L(n):
Chemical reaction rate coefficients: Torr and Torr (1982) without N32 (vib), Ge´rard (1992), and references therein
• Transport@ nuz=@z Ambipolar diffusion
Wind-induced drifts: HWM 93 (Hedin et al., 1996) Topside flux: 2×108cm)2s)1downward
• Neutral atmosphere:
MSISE 90 model (Hedin, 1991)
Self-consistently calculated NO, N, and N(2D) densities
•Electron temperature: Solution of the electron energy equation
@Te
@t ~uekgradTe2=3Tediv~uek 3k n2
e
QeÿLeÿ div~qek
•Ion temperature: Model of Titheridge (1993): TiTn
TeÿTn
[image:4.612.45.290.326.620.2]References
Batista, I. S., E. R. de Paula, M. A. Abdu, N. B. Trivedi, and M. E. Greenspan, Ionospheric effects of the March 13, 1989, magnetic storm at low and equatorial latitudes, J. Geophys. Res., 96, 13943–13952, 1991.
Fite, W. L., Charge exchange transfer and ion-atom interchange collisions above thermal energies, Ann. Geophys., 20, 47–73, 1964.
Fok, M.-C., J. U. Kozyra, A. F. Nagy, C. E. Rasmussen, and G. C. Khazanov, Decay of equatorial ring current ions and associated aeronomical consequences, J. Geophys. Res., 98, 19381–19393, 1993.
Ge´rard, J. C., Thermospheric odd nitrogen, Planet. Space Sci., 40, 337–353, 1992.
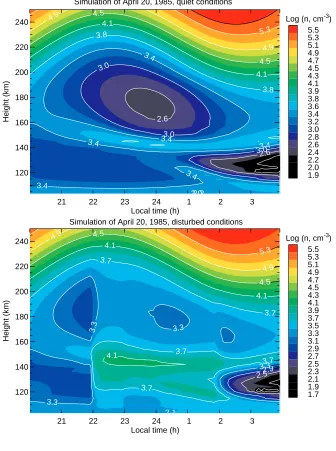
Simulation of April 20, 1985, quiet conditions
21 22 23 24 1 2 3
Local time (h) 120 140 160 180 200 220 240 Height (km) 2.2 2.6 3.0 3.0 3.4 3.4 3.8 3.8 4.1 4.1 4.5 4.5 4.9 5.3 4.9 3.4 3.4 3.4 3.4 3.0 3.0 2.6
Log (n, cm )-3 5.5 5.3 5.1 4.9 4.7 4.5 4.3 4.1 3.9 3.8 3.6 3.4 3.2 3.0 2.8 2.6 2.4 2.2 2.0 1.9
Simulation of April 20, 1985, disturbed conditions
21 22 23 24 1 2 3
Local time (h) 120 140 160 180 200 220 240 Height (km) 2.1 2.52.9 3.3 3.3 3.7 3.7 3.7 3.7 3.7 4.1 4.1 4.5 4.5 4.9 5.3 4.9 4.1 3.3 3.3
[image:5.612.40.514.35.732.2]Log (n, cm )-3 5.5 5.3 5.1 4.9 4.7 4.5 4.3 4.1 3.9 3.7 3.5 3.3 3.1 2.9 2.7 2.5 2.3 2.1 1.9 1.7
Fig. 7. Contour plots of the electron densities obtained in the simulations for April 20, 1985. A tidal layer moves from an altitude of 180 km downward to an altitude of 115 km. The density of this layer is enhanced due to the additional ionization production by precipitated ring current particles. Also the valley between this layer and the lower F-region is filled in by this additional ionization
Simulation of February 9, 1986 event
150 200 250 Height (km) Disturbed Quiet
102 103 104 105
Density (cm )-3
[image:5.612.44.380.61.512.2]Gloeckler, G., and D. C. Hamilton, AMPTE ion composition results, Phys. Scr., T18, 73–84, 1987.
Haubert, A., L’ionisation nocturne de la re´gion-E et l’activite´ ge´omagne´tique, J. Atmos. Terr. Phys., 15, 84–87, 1959. Hedin, A. E., Extension of the MSIS thermosphere model into the
lower and middle atmosphere, J. Geophys. Res., 96, 1159–1172, 1991.
Hedin, A. E., E. L. Fleming, A. H. Manson, F. J. Schmidlin, S. K. Avery, R. R. Clark, S. J. Franke, G. J. Fraser, T. Tsuda, F. Vial, and R. A. Vincent, Empirical model for the upper, middle and lower atmosphere, J. Atmos. Terr. Phys., 58, 1421–1447, 1996. Hirao, K., N. Wakai, K. Sawada, T. Hikosaka, K. Yano, and K. Maeda, Some evidences of the particle effects on the ionosphere at middles latitudes, Space. Res., 5, 1058–1070, 1965.
Lyons, L. R., and A. D. Richmond, Low-latitude E region ioni-zation by energetic ring current particles, J. Geophys. Res., 83, 2201–2204, 1978.
Mizera, P. F., and J. B. Blake, Observations of ring current protons at low latitudes, J. Geophys. Res., 78, 1058–1062, 1973. Morton, Y. T., and J. D. Mathews, Effects of the 13-14 March 1989
geomagnetic storm on the E-region tidal ion layer structure at Arecibo during AIDA, J. Atmos. Terr. Phys., 55, 467–485, 1993. Noe¨l, S., and G. W. Pro¨lss, Heating and radiation production by neutralized ring current particles, J. Geophys. Res., 98, 17317– 17325, 1993.
Ogawa, T., and T. Tohmatsu, Photoelectronic processes in the upper atmosphere, II. The hydrogen and helium ultraviolet glow as an origin of the nighttime ionosphere, Rep. Ionosph. Space. Res. Japan, 20, 395–417, 1966.
Pro¨lss, G. W., Radiation production and energy deposition by ring current protons dissipated by the charge-exchange mechanism, Ann. Geophys., 29, 503–508, 1973.
Pro¨lss, G. W., K. Najita, and P. C. Yuen, Heating of the low-latitude upper atmosphere caused by the decaying magnetic storm ring current, J. Atmos. Terr. Phys., 35, 1889–1901, 1973. Richards, P. G., J. A. Fennelly, and D. G. Torr, EUVAC: A solar EUV flux model for aeronomic calculations, J. Geophys. Res., 99, 8981–8992, 1994.
Rowe, J. F., Jr., A statistical summary of Arecibo nighttime E region observations, J. Geophys. Res., 78, 6811–6817, 1973. Rowe, J. F., Jr., Magnetic activity variations of the nighttime E
region at Arecibo, Radio Sci., 9, 175–182, 1974.
Shen, J. S., W. E. Swartz, D. T. Farley, and R. M. Harper, Ionization layers in the nighttime E region valley above Arecibo, J. Geophys. Res., 81, 5517–5526, 1976.
Smith, L. G., M. A. Geller, and H. D. Voss, Energetic electrons in the mid-latitude nighttime E-region, J. Atmos. Terr. Phys., 36, 1601–1612, 1974.
Tinsley, B. A., Energetic neutral atom precipitation during mag-netic storms: Optical emission, ionization, and energy deposi-tion at low and middle latitudes, J. Geophys. Res., 84, 1855– 1864, 1979.
Titheridge, J. E., Atmospheric winds calculated from diurnal changes in the mid-latitude ionosphere, J. Atmos. Terr. Phys., 55, 1637–1659, 1993.
Torr, M. R., and D. G. Torr, The role of metastable species in the thermosphere, Geophys. Res. Lett., 6, 771–774, 1982.
Voss, H. D., and L. G. Smith, Nighttime ionization by energetic particles at Wallops Island in the altitude region 120 to 200 km, Geophys. Res. Lett., 6, 93–96, 1979.