www.ann-geophys.net/32/99/2014/ doi:10.5194/angeo-32-99-2014
© Author(s) 2014. CC Attribution 3.0 License.
Annales
Geophysicae
Statistical visualization of the Earth’s magnetotail and the implied
mechanism of substorm triggering based on superposed-epoch
analysis of THEMIS data
S. Machida1, Y. Miyashita1, A. Ieda1, M. Nosé2, V. Angelopoulos3, and J. P. McFadden4 1Solar Terrestrial Environment Laboratory, Nagoya University, Aichi, Japan
2World Data Center for Geomagnetism, Kyoto University, Kyoto, Japan
3Institute of Geophysics and Planetary Physics/Department of Earth, Planetary and Space Sciences, University of California, Los Angeles, CA, USA
4Space Sciences Laboratory, University of California, Berkeley, CA, USA
Correspondence to: S. Machida ([email protected])
Received: 2 September 2013 – Revised: 5 December 2013 – Accepted: 3 January 2014 – Published: 17 February 2014
Abstract. To investigate the physical mechanism responsible for substorm triggering, we performed a superposed-epoch analysis using plasma and magnetic-field data from THEMIS probes. Substorm onset timing was determined based on au-roral breakups detected by all-sky imagers at the THEMIS ground-based observatories. We found earthward flows as-sociated with north–south auroral streamers during the sub-storm growth phase. At aroundX= −12 Earth radii (RE), the northward magnetic field and its elevation angle de-creased markedly approximately 4 min before substorm on-set. Moreover, a northward magnetic-field increase associ-ated with pre-onset earthward flows was found at aroundX= −17RE. This variation indicates that local dipolarization oc-curs. Interestingly, in the region earthwards ofX= −18RE, earthward flows in the central plasma sheet (CPS) reduced significantly approximately 3 min before substorm onset, which was followed by a weakening of dawn-/duskward plasma-sheet boundary-layer flows (subject to a 1 min time lag). Subsequently, approximately 1 min before substorm on-set, earthward flows in the CPS were enhanced again and at the onset, tailward flows started at aroundX= −20RE. Fol-lowing substorm onset, an increase in the northward mag-netic field caused by dipolarization was found in the near-Earth region. Synthesizing these results, we confirm our pre-vious results based on GEOTAIL data, which implied that significant variations start earlier than both current disruption and magnetic reconnection, at approximately 4 min before substorm onset roughly halfway between the two regions of interest; i.e. in the catapult current sheet.
Keywords. Magnetospheric physics (magnetotail; storms and substorms) – space plasma physics (magnetic reconnec-tion)
1 Introduction
In this context, Nishimura et al. (2010) reported that a spe-cific sequence of events determines substorm onsets; i.e. they are initiated by a poleward boundary intensification (PBI) and flow through north–south arced motion equatorwards (“N–S streamers”), towards the quiet arc at the onset’s lat-itude. This suggests the importance of earthward transport of new plasma during a substorm’s onset. Recently, these au-thors also reported that the earthward plasma flows which are associated with N–S streamers must originate from the dis-tant neutral line (DNL) rather than the NENL, based on ob-servations with the ARTEMIS probe in conjunction with au-roral observations using the THEMIS ground-based all-sky imager (ASI) array. They suggested that the NENL is not related to either pre-onset flow or auroral activity, but that it becomes active during the expansion phase (Nishimura et al., 2013).
Meanwhile, our superposed-epoch analyses of GEOTAIL data have shown that magnetic reconnection and dipolar-ization in the near-Earth magnetotail occur simultaneously (within a 2-minute time interval, which is equivalent to our time resolution) with auroral breakup, and we also found the variations commonly regarded as precursors to substorm on-set halfway between the NENL and the dipolarization re-gion. Guided by this result, we proposed a new mechanism of substorm triggering: the catapult (slingshot) current-sheet relaxation model (Machida et al., 2009). In this model, the DC Poynting flux towards the central plasma sheet (CPS) is enhanced during the substorm’s growth phase. Approx-imately 4 min before its onset, the catapult current sheet relaxes, causing earthward plasma flows which accompany low-frequency electromagnetic waves just prior to substorm onset. The catapult current sheet couples strongly with the near-Earth region, producing large perturbations that initiate current disruption and magnetic-field dipolarization. At the same time, the tailward edge of the catapult current sheet be-comes very thin, so that a magnetic neutral line, specifically the NENL, forms and magnetic reconnection starts. The most important feature of this model is that the cause of substorm triggering is located halfway between the CD regions and the NENL.
our previous studies has the advantage that it enables us to investigate both temporal and spatial variations in var-ious parameters based on a minimum number of assump-tions, and that it offers a perspective view of substorms. Here we focus on both the structure in theX–Z plane and tem-poral evolution in the equatorial plane using data from the five THEMIS probes (Angelopoulos et al., 2008a) to per-form a superposed-epoch analysis. Magnetic-field data and plasma-moment data obtained with the Flux Gate Magne-tometer (FGM) (Auster et al., 2008), Electrostatic Analyzer (ESA) and Solid State Telescope (SST) (McFadden et al., 2008) instruments onboard the THEMIS probes (each with 3 s time resolution) are used. Using these data is advanta-geous in the sense that the THEMIS probes explore the mag-netosphere inside 10RE, where CD and dipolarization occur, and significant auroral activity is mapped onto that region. In addition, the use of simultaneous observations from five probes increases the data volume. To further improve the re-liability of our superposed-epoch analysis, we used the auro-ral substorm onset list prepared by Nishimura et al. (2010), who obtained substorm onset times from auroral breakups, and the THEMIS ASI data with its remarkably short single-frame time resolution, typically 3 s. Our analysis covers the period from November 2007 to April 2009, which in-cludes both the period investigated by Nishimura et al. (2010) and also an extended period publicly accessible on the Web at http://www.atmos.ucla.edu/~toshi/files/paper/Toshi_ THEMIS_GBO_list_distribution.xls. Those events which were preceded by pseudo-breakups, as well as those compris-ing multiple onsets, were kept, but we selected only the first substorm onset for our analysis in these cases. Events accom-panied by clear N–S streamers and those without clear N–S streamers were both contained as was done by Nishimura et al. (2010). However, they found that streamers are commonly seen several minutes prior to auroral substorm onset.
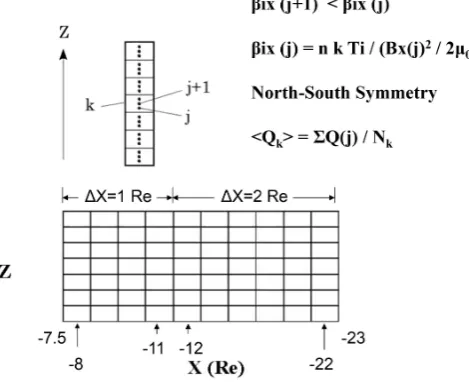
We selected data from the intervals when each THEMIS probe was located individually in the region defined by
−7.5> X(RE) >−23 and −2.5< Y (RE) <7.5, where
Fig. 1. Schematic illustration of our method of obtaining structures in the meridional (X–Z)plane.
earthwards of−11.5RE, just like we did with the GEOTAIL data (Machida et al., 2000). BeyondX= −11.5RE, we set the column width to 2RE, so as to adjust for the limited num-ber of THEMIS observations on the tailward side (see Fig. 1). A total of 642 events were analysed; we assigned multiplicity orders ofNwhen the data fromNdifferent probes were used for a given event. (The net number of substorms detected was 195.) We assigned the data to the appropriate column depending on theXcoordinate of each probe. The numbers of events assigned to each column were 43, 74, 111, 201, 122, 19, 24, 35, 6 and 7 for the columns centred at−8,−9,
−10,−11,−12,−14,−16,−18,−20 and−22RE, respec-tively. Next, we sorted the data into 3 s resolution units for every 1 min (i.e. one event is composed of 20 data points), assuming that events with largerβiX=nkTi/(B
2
X/2µ0)
val-ues were located closer to the plasma sheet’s centre. Here,n,
Ti,BX,kandµ0are the plasma density, the ion temperature, theXcomponent of the magnetic field, Boltzmann’s constant and the magnetic permeability of free space, respectively.
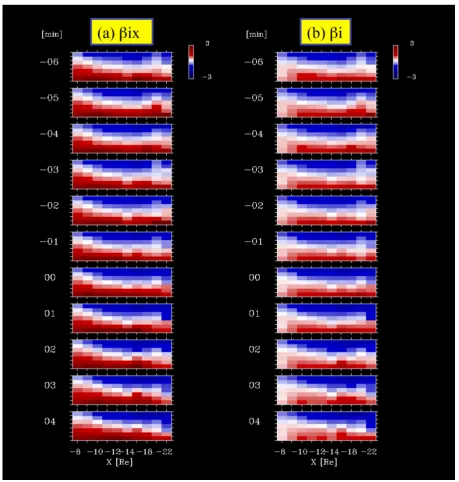
We separated each column into seven bins to homogenize the number of data points in each bin. We subsequently eval-uated the physical parameters in each bin by averaging the 3 s resolution data, such as the ion number density, temperature and velocity vector, as well as the magnetic-field vector, over 1 min intervals. An advantage of this method, compared with that in whichβiX is taken as the ordinate, is that it provides information regarding the scale length (thickness) in theZ
direction. (The probability of detecting a particular struc-ture is approximately proportional to its thickness.) We show the distribution ofβiX in theX–Z (proxy) plane in Fig. 2a and that ofβi=nkTi/(B2/2µ0)for the three components of the magnetic field in Fig. 2b, for reference. The inclina-tions of the five THEMIS probes were 7.0◦ for P1 and P2, 9.0◦ for P3 and P4, and 4.5◦ for P5; they are distributed
around an inclination of 7.5◦, the value of the GEOTAIL in-clination. The apogees are 31.6, 19.8, 12.1, 12.1 and 10.0RE for THEMIS P1 through P5, respectively, and all THEMIS probes have perigees in the range between 1.1REand 1.4RE. In contrast, the GEOTAIL apogee is 30.0REand its perigee is 10.0RE. According to the model of Tsyganenko and Fair-field (2004), the approximate upperZ limit scanned by the THEMIS probes is 6RE, which is almost the same as that pertaining to the GEOTAIL data.
3 Results
3.1 Temporal evolution of the meridional structure
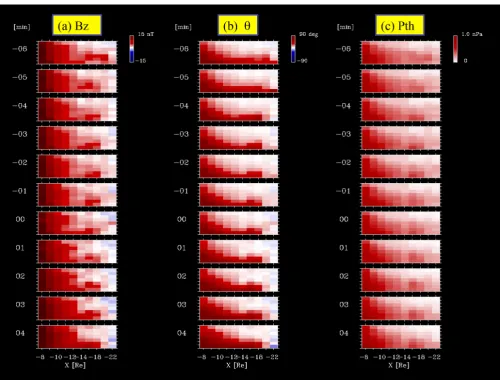
Figure 3a shows the northward magnetic field BZ in the
X–Z (proxy) plane. The contribution from the Earth’s dipole magnetic field is significant on the earthward side of X ∼ −12RE. Beyond X ∼ −12RE, a BZ ∼0 region is
present on the side of the lobe. The nonzero BZ field
ex-tends from the inner dipole magnetic field toX ∼ −20RE. Near X ∼ −14RE, BZ becomes smaller than in both its
earth- and tailward neighbours in the CPS. Figure 3b shows the elevation angle of the local magnetic-field vec-torθ=atan[BZ/sqrt(BX2+BY2)], which has similar
charac-teristics to those of the northward magnetic field, BZ. The
earthward side ofX ∼ −12RE is affected by a large con-tribution from the Earth’s dipole magnetic field, to which a relatively thin layer of nonzero θ (corresponding to the thin plasma sheet) is added. The tailward boundary of this layer approaches Earth untilt= −3 min and the layer is thin aroundX= −14RE, reflecting the smallBZfield in that
re-gion. TheBZvalues are very small beyondX∼ −20RE(not shown). The thickness of the nonzeroθ layer in the region
−12 >X(RE) >−20 seems to become smaller untilt=0, causing magnetic-field stretching.
Figure 3c shows the plasma pressure, Pth (i.e. the sum of the ion thermal pressure measured by ESA and SST) and the electron thermal pressure measured by ESA. Inside
X ∼ −12RE, the plasma sheet is thick. In the vicinity of
X= −14RE, there is a gap similar toBZ andθ. The other
high-pressure area covers the region fromX∼ −15REtoX
∼ −19RE.
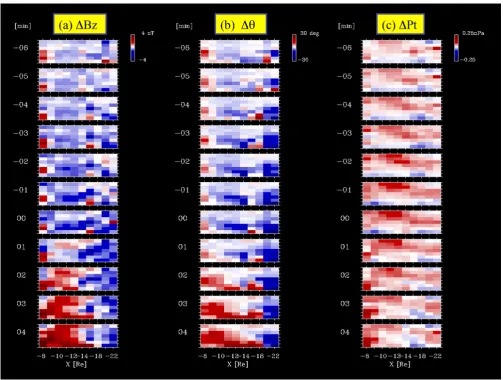
Figure 4a–c shows the time evolution of 1BZ, 1θ and
1Pt; i.e. the deviations of the northward magnetic field, the
elevation angle and the total pressure (i.e. the sum of the plasma pressure and the magnetic pressure), respectively, us-ing average values (t= −12 min tot= −10 min). As shown in Fig. 4a, the increase caused by dipolarization starts at
t=1 min and progresses to a very wide area earthwards of
X= −12REat t=2 min. A small positive1BZ region in
the CPS at X∼ −16RE is related to the earthward flows. Negative1BZ variations, however, appear along almost the
Fig. 2. Temporal evolution of (a)βiXand (b)βi, as defined in the text.
X ∼ −20RE. ThisBZ decrease is one of the most
distinc-tive signatures to occur in the near-tail region. TheBZ
de-crease on the earthward side seems to reflect the same vari-ation as that recently reported by Saito et al. (2010). After substorm onset, the earthward side of this negative1BZ
vari-ation is overcome by a positive1BZcontribution. The
varia-tion of the elevavaria-tion angle,1θ, is approximately proportional to1BZ. Therefore, the time evolution shown in Fig. 4b is
similar to that in Fig. 4a. A large increase in1θalso occurs abruptly att=2 min earthwards ofX= −12REand propa-gates tailwards.
The total pressure gradually increases on the side of the lobe untilt= −1 min at−10> X(RE) >−14, which is caused by magnetic pressure enhancement. In contrast, the total pressure decrease is caused by a plasma-pressure de-crease in either the plasma sheet or the near-Earth equato-rial region. After the onset, the total pressure decreases near
Fig. 3. Meridional structure of the magnetotail betweenX=–7.5REandX= −23RE. (a) Northward magnetic field,BZ; (b) elevation
angle of the magnetic field,θ; and (c) thermal plasma pressure,Pth, based on ESA and SST data.
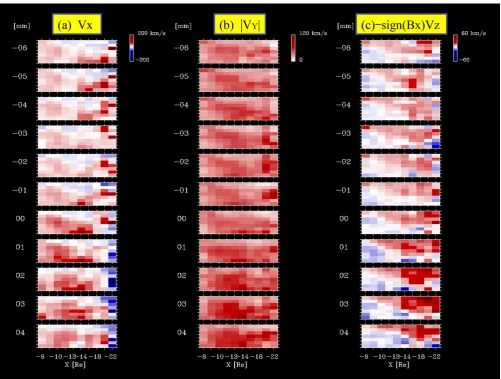
Figure 5a–c shows the ion-flow velocities, which are es-sentially the same as the plasma-flow velocities. Before sub-storm onset, both CPS flows and plasma-sheet boundary-layer (PSBL) flows are present atX <−13RE, as reported previously (Machida et al., 2009), although the latter are not necessarily clear in the region tailwards ofX= −18RE because of limitations inherent to the use of small-number statistics. The appearance of moderate earthward flows at
X <−13RE prior to substorm onset is consistent with the result of a previous case study based on THEMIS data (Xing et al., 2010b). Interestingly, the CPS flows earthwards ofX= −18REbecome weak betweent= −3 min andt= −2 min, and they are enhanced aftert= −1 min. Att=0, tailward flows start to develop at X∼ −20RE. In the present study, substorms of different magnitudes are selected and used in our analysis, but they are all full substorms. Therefore, this is regarded as the typical nature of full substorms. Also note that the values of the flow velocities of individual events
exceed the present value, since the flow channel is relatively confined to within a narrow region, mostly in a given bin in the CPS region consisting of both flow and nonflow events, and the values shown are averages.
The absolute VY value was evaluated, because the flows
bifurcate at X ∼ −11RE and both dawn- and duskward flows are present. These flows, essentially flows perpendic-ular to the magnetic field, are populated in the PSBL from
t= −5 min tot=1 min (compare Fig. 5b with Fig. 2a and b). The large|VY|layer insideX∼ −11REseems to be thin and becomes more distinct att= −2 min. The value of|VY|
subsequently becomes small fromt= −2 min tot=0 in the region earthwards ofX= −18RE, with a∼1 min time de-lay owing to the weakening ofVX. After the substorm onset,
however, that layer spreads again. The lower trace of the large
|VY|layer in the pre-onset phase corresponds to the region
Fig. 4. Meridional displays of the deviations of (a) the northward magnetic field,1BZ; (b) the elevation angle,1θ; and (c) the total pressure, 1Pt, with respect to the relevant average values representative of the interval fromt= −12 min tot= −10 min.
The temporal evolution of−sign(BX)VZshown in Fig. 5c
corresponds to an enhancement of the DC Poynting flux to-wards the CPS. Before the substorm onset, this is caused by plasma convection during the growth phase. However, after the substorm onset, it is enhanced because of magnetic re-connection; i.e. the pronounced structure of −sign(BX)VZ
corresponds to plasma inflow towards the separatrix of the magnetic-reconnection topology. Such distinctive plasma motion was also found in the case studies of Angelopoulos et al. (2008b) and Lyons et al. (2010).
3.2 Time evolution in the equatorial region
Figure 6a shows the time evolution of the earthward flows
VX in the CPS region. It was constructed by selecting two
bins from the bottom of each panel in Fig. 5a and evaluating average values for those bins as a function ofX. Earthward flows (in red) at−13> X(RE) >−23 att= −6 min weaken att= −3 min andt= −2 min. Att= −1 min, they start to
develop at−10> X(RE) >−17. Tailward flows (in blue in Fig. 6a), which appear downtail fromX ∼ −19REatt=0, are consistent with a tailward-flow study based on GEOTAIL and POLAR data (Ieda et al., 2008). If we compare this panel for VX with the panel forBZ in Fig. 7a, we see that these
tailward flows accompany a small negativeBZ
(southward-pointing) magnetic field, which indicates the occurrence of magnetic reconnection. These tailward flows grow into a well-developed plasmoid in the downtail region (e.g. Birn and Hesse, 1991; Machida et al., 1994; Ieda et al., 1998).
Figure 6b shows the value of|VY|at the equator.
Enhance-ment of this parameter occurs atX∼ −14REatt=0. There is an approximately 1 min time lag between the enhancement ofVXin the vicinity of this region associated with substorm
onset. The value of |VY| further increases after t=1 min.
Fig. 5. Meridional displays of (a) the earthward-flow velocity,VX; (b) the dawn-/duskward flow velocity,|VY|; and (c) the flow velocity
towards the CPS,−sign(BX)VZ.
Fig. 6. Time evolution of (a) the earthward-flow velocity,VX; (b) the dawn-/duskward flow velocity,|VY|; and (c) the flow velocity towards
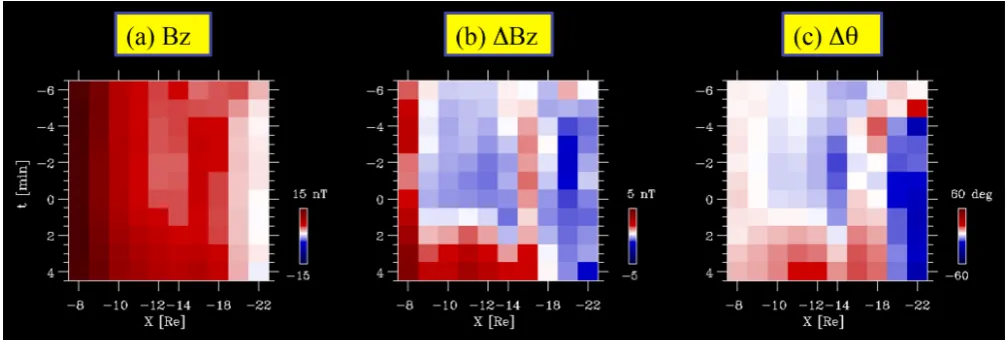
[image:7.595.45.550.487.657.2]Fig. 7. As for Fig. 6, but for (a) the northward magnetic field,BZ; (b) its deviation,1BZ; and (c) the change in elevation angle,1θ, in the
equatorial region.
side. In the present superposed-epoch analysis, the northward magnetic-field increase owing to magnetic-flux pile-up pre-dicted by the flow-braking model (Shiokawa et al., 1997) is not necessarily clear at this boundary. Instead, magnetic-flux pile-up can be seen before the onset aroundX∼ −16RE, as we will explain below.
Similarly, flows diverging from the equator along the magnetic-field line in blue appear aroundX= −14RE af-tert=1 min in Fig. 6c. On the other hand, convective flows towards the CPS are seen aroundX= −14RE before and subsequently atX= −20RE after the onset. The latter cor-respond to the inflow associated with magnetic reconnection. Figure 7a and b show the time evolution ofBZand1BZ
at the equator, respectively. The apparent propagation of the
1BZ<0 region from the earthward to the tailward side
can be seen if we ignore the positive increase aroundX= −16RE. This variation in1BZ is associated with
plasma-sheet thinning. The occurrence of such a signature has been anticipated (Akasofu, 1977; Lui et al., 1977). A significant positiveBZenhancement (1BZ>0) following the onset has
been attributed to dipolarization (Nagai, 1982). Another no-table enhancement aroundX= −16RE att= −6 min and
t= −5 min is caused by magnetic-flux transport and pile-up associated with convective earthward flows tailwards of
X∼ −16RE: see Fig. 5a (Baumjohann et al., 1990; An-gelopoulos et al., 1992; Shiokawa et al., 1997; Slavin et al., 1997; Shue et al., 2008). It is difficult to distinguish the de-crease inBZ beyondX∼ −20REafter the onset from that caused by plasma-sheet thinning. We think that it is caused by magnetic reconnection with the magnetic neutral line at
X∼ −20RE, considering the slightly negative value ofBZin
that region and the fact that tailward flows appear in Fig. 6a. The location of the NENL is relatively close to the Earth compared with the value obtained by Imber et al. (2011) based on the same THEMIS data. This may be attributed to the method of data selection; i.e. all travelling compression
region (TCR) events were used in their study, but only the first full substorm events were used in ours. The time vari-ation of1θ shown in Fig. 7c is similar to that of1BZ. At
two locations,1θexhibits positive values even before the on-set, atX∼ −8REandX∼ −17RE. In terms of theBZ and
θ increases, dipolarization appears to occur atX ∼ −11RE and propagates both earth- and tailwards. The other increase inθ, atX ∼ −17RE, is caused by earthward flows prior to substorm onset. Negative, positive and then negative varia-tions in1BZ and1θ in the catapult current sheet from X
∼ −13REtoX∼ −18REindicate that local dipolarization occurs aroundX∼ −15RE, although the entire current sheet is stretched approximately 4 min before the onset. This vari-ation is critical for our understanding of the destabilizvari-ation of the catapult current sheet and, therefore, of substorm trig-gering.
Figure 8a shows the time evolution of the duskward elec-tric field,EY, at the equator, which we evaluated using the
relationE= −V×B. The largeEY region that appears at
X∼ −20 RE att= −6 min propagates earthwards, which is consistent with the results of Liu et al. (2011), who anal-ysed the earthward-transported magnetic flux and found it to be proportional to the time integral ofEY. As expected,
regions characterized by largeEY correlate well with
signif-icant earthward flows.
Figure 8b showsBrms (i.e. is the root-mean-square value of the magnetic-field deviations from the average value for one spin period, 3 s), which essentially represents the low-frequency wave activity in the 0.33–16 Hz low-frequency range. This parameter exhibits a positive correlation with the earth-and tailward flow velocities, |VX|. In particular, some
Fig. 8. As for Fig. 6, but for (a) the duskward electric field,EY; (b) the root-mean-square value of the magnetic field,Brms; and (c) the
deviation of total pressure,1Pt, in the equatorial region.
substorm onset (t=1 min). This parameter also correlates well withEY.
The deviation of the total pressure,1Pt, in the equatorial
region, in essence equivalent to the variation in the plasma pressure, is shown in Fig. 8c. There are two distinct regions of negative 1Pt, centred at X ∼ −9RE and X∼ −18RE. However, positive 1Pt (i.e. an indication that the plasma
pressure increases) occurs at X ∼ −14RE at t= −1 min, which is associated with an enhancement of earthward flows. After the onset, the region of positive1Ptcoincides with the
region subjected to earthward flows. Earthward flows prior to substorm onset accompany the plasma-pressure decrease. It is possible that they correspond to a structure known as a plasma bubble (Pontius and Wolf, 1990; Chen and Wolf, 1993; Sergeev et al., 1996). ThePt increase atX∼ −8RE aftert=1 min is predominantly caused by high-energy ions with energies in excess of 25 keV. Those variations are con-sistent with the results of recent studies (Miyashita et al., 2009; Dubyagin et al., 2010; Xing et al., 2010a).
4 Summary and discussion
We obtained temporal and spatial variations of the near-Earth magnetotail in the meridional plane as well as their time evo-lution in the equatorial plane. The results can be summarized as follows.
1. We found a minimum structure in BZ and Pth atX
∼ −14REaround substorm onset.
2. Dipolarization and possibly CD start at t= 1 min and progress to a very wide area earthwards of
X= −12REatt=2 min.
3. Associated with plasma convection towards the CPS, the magnetic pressure is enhanced in the lobe. Fol-lowing substorm onset, the total pressure decreases at
X= −14REand it increases both earth- and tailwards of that region.
4. Before substorm onset, both CPS and PSBL flows are present in the region at X <−13RE. The earthward flows in the CPS, as well as the dawn-/duskward flows in the PSBL earthwards ofX= −18RE, become weak just prior to the onset. This seems to be a characteristic of full substorms.
5. Local dipolarization characterized by small positive
1BZwas found aroundX= −17REand is associated with the earthward CPS plasma flow. This may affect the initial location of the NENL.
6. Magnetic reconnection occurs after t=0; its occur-rence can be confirmed by the generation of tailward plasma flows with negativeBZ and significant
earth-ward flows with positiveBZ, as well as enhancement
of the convective flows of the lobe plasma towards the CPS.
7. During the pre- and post-onset phases of a substorm, parameters such asVX,EY,Brms and1Pt show
sim-ilar variations; i.e. the active region approaches the Earth. Substorms start when such active regions reach the region of−12> X(RE) >−15.
8. Following a substorm’s onset, considerable variations inVX,VY,BZ,EY,BrmsandPtspread abruptly across
a wide area earthwards ofX= −12RE.
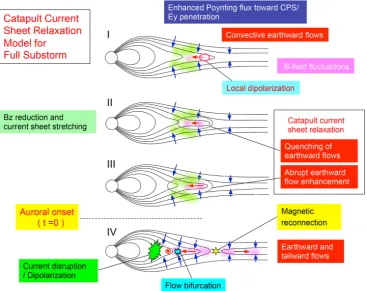
Fig. 9. Schematic illustration of the catapult current-sheet relaxation model. See the text for details.
BZreduction is found at−12> X(RE) >−15 in the present study, whereas it was at−15> X(RE) >−19 in our previ-ous study. In addition, the equatorial BZ peak in the
mid-tail is located atX∼ −19REonly 6 min prior to the onset, whereas closer to the onset moment it shifts closer to Earth atX∼ −16REin the present study. A similar earthward dis-placement in the peak of the earthward-flow velocity can be seen in the equatorial plane associated with that shift. In con-trast, the equatorialBZ peak is located nearX= −20REat 5 min before the onset; it subsequently shifts toX∼ −18RE at the time of the onset. As for the plasma flow, in contrast to the GEOTAIL-based scenario in which the earthward-flow enhancement is seen at all times prior to the onset, in the THEMIS-based scenario it disappears betweent= −3 min andt= −2 min.
The time intervals covered by THEMIS in the context of the present study (November 2007 to April 2009) and by GEOTAIL analysed in our previous study (Machida et al., 2009; April 1996 to December 2002) are different. Solar ac-tivity during the corresponding periods was different. The in-terval covered by THEMIS corresponds to solar minimum. In contrast, the interval covered by GEOTAIL starts at solar minimum and continues to the end of solar maximum. This may cause the differences between the present THEMIS and previous GEOTAIL results.
The determination of the onset time is significant in our superposed-epoch analysis. Substorm onsets were deter-mined based on the THEMIS ASI data in the present study. In contrast, global auroral imager data obtained with the PO-LAR/Ultraviolet Imager (UVI) and IMAGE/Far-Ultraviolet Imager (FUV) instruments were used in our previous study (Machida et al., 2009). The onset time (t=0) corresponds to the start of the initial brightening in which a bead-like struc-ture is formed in the auroral arc, characterized by a dramatic luminosity enhancement. The spatial resolution and optical sensitivity of the ground-based observations is higher than that of the spacecraft data, so it is possible that the onset time of the present study advances to that in our previous study. However, it is within 1–2 min, judging from the results ob-tained for various parameters in both cases. In addition, the different thresholds (e.g. for the luminosity of the emission or the spatial spread of the auroral breakup) used to select the substorm onset events may cause the differences between the present THEMIS and previous GEOTAIL results, in addition to the difference in solar phase. With this in mind, we can interpret the results from our THEMIS data as follows.
conductivity between the feet of the magnetic-field lines which connect the ionosphere to the boundaries of the earthward-moving localized plasma. At the duskward bound-ary, the field-aligned current flows away from the ionosphere; the electrons move in the opposite direction, producing an aurora. It is possible that the N–S auroral streamer reported by Nishimura et al. (2010), as one of the key elements to understanding the triggering of substorms, corresponds to such an earthward-moving localized plasma and associated current system. Recently, Nishimura et al. (2010) confirmed that the flows associated with N–S streamers originate from the DNL. Although we found corresponding earthward flows untilt= −4 min, these flows became weak just a few min-utes before the onset. Att= −1 min, earthward flows with a velocity peak in the region earthwards ofX∼ −14RE devel-oped. Localized tailward flows atX∼ −20REstart att=0. Taking into account the locations of the earthward flows, we conclude that these flows are associated with relaxation of the catapult current sheet. However, they are shortly overtaken by flows produced by magnetic reconnection. The results ob-tained by Nishimura et al. (2010, 2013) for substorm trigger-ing by new plasma intrusion originattrigger-ing from the DNL and those presented in this paper are complementary, and their relationship should be investigated in more detail.
Earthward flows in the CPS are thought to be convective flows that carry the magnetic flux. An increase in the north-ward magnetic field owing to this effect can be seen at around
X= −17REbefore substorm onset. On the other hand, a sig-nificant increase insideX= −11REafter the onset is caused by conventional dipolarization. Therefore, an increase inBZ
in the catapult current-sheet region should be distinguished from equivalent increases inside X= −11RE. Those vari-ations in BZ may indicate local dipolarization in the
cur-rent sheet around X= −15 RE, although the current sheet is stretched, on average.
The magnetic field associated with the earthward flows exhibits large fluctuations, as reported by Angelopoulos et al. (2002) throughout the period examined in this study. The fast flows themselves may excite large-amplitude electro-magnetic waves. Since we did not analyse their frequency spectrum, we cannot determine the mode of these waves, which we therefore leave for future study. Highly struc-tured magnetic fields in the plasma sheet may be carried by plasma flows, producing large variations at the probes’ loca-tions. Again, the formation of such highly structured mag-netic fields is thought to be caused by some plasma instabil-ity.
Use of THEMIS probe data has added new information to the original GEOTAIL data, extending the boundary far-ther inside 10RE. We found earthward flows associated with N–S auroral streamers, which carry the northward-directed magnetic fieldBZ and also cause a reduction inBZ in the
lobe and the PSBL on the earthward-side, shown as Phase I in Fig. 9. Phase II is characterized by a further reduction in
BZ at−10> X(RE) >−12 and, although the plasma sheet
is stretched on average, local dipolarization occurs around
X=–15RE. At the same time, the earthward and the dawn-/duskward flows weaken; the latter continue to weaken dur-ing the next phase. This phase can be regarded as an early phase of catapult current-sheet relaxation. During Phase III, from t= −1 min to t=0, explosive catapult current-sheet relaxation occurs and a force imbalance at the earthward edge of the catapult current sheet causes a drastic structural change. Plasma instabilities, such as tearing instabilities (e.g. Sitnov and Schindler, 2010), ballooning/interchange ities (e.g. Pritchett and Coroniti, 2010) or kink-type instabil-ities (Erkaev et al., 2008) may be involved in this relaxation process. The relaxation of the catapult current sheet produces fast convective earthward flows, and this leads to consider-able perturbations to the instability which already developed in the inner region. The instability thus proceeds fully non-linearly, causing the system to develop into Phase IV, where CD and reconfiguration of the magnetic-field structure (i.e. dipolarization) occur. Meanwhile, the tailward edge of the catapult current sheet thins so much that the magnetic neutral line is formed and magnetic reconnection commences. Cat-apult current-sheet relaxation lasts for approximately 4 min. The plasma in the region of interest is accelerated and evac-uated from its earthward boundary, and the earthward flows produced by magnetic reconnection take over from the pre-cursory flows. Once magnetic reconnection starts, it plays an important role in regulating mass and energy transport in the magnetosphere. In the same manner, CD causes significant variations and signatures in the inner magnetosphere and on the ground through magnetosphere–ionosphere coupling.
Acknowledgements. The authors are grateful to Y. Nishimura for providing a substorm-onset list with second timing accuracy and to K.-H. Glassmeier and H. U. Auster for THEMIS fluxgate magne-tometer data. This work was supported by NASA contract NAS5-02099 and also by GEMSIS-I program at STEL, Nagoya university. Topical Editor I. A. Daglis thanks L. Lyons and one anonymous referee for their help in evaluating this paper.
References
Akasofu, S.-I.: The development of the auroral substorm, Planet. Space Sci., 12, 273–282, 1964.
Akasofu, S.-I.: Physics of magnetospheric substorms (Reidel), Dor-drecht, Netherlands, 1977.
Angelopoulos, V., Baumjohann W., Kennel, C. F., Coroniti, F. V., Kivelson, M. G., Pellat, R., Walker, R. J., Lühr, H., and Paschmann, G.: Bursty Bulk Flows in the Inner Central Plasma Sheet, J. Geophys. Res., 97, 4027–4039, doi:10.1029/91JA02701, 1992.
stantinescu, D., Fischer, D., Fornacon, K. H., Georgescu, E., Harvey, P., Hillenmaier, O., Kroth, R., Ludlam, M., Narita, Y., Nakamura, R., Okrafka, K., Plaschke, F., Richter, I., Schwarzl, H., Stoll, B., Valavanoglu, A., and Wiedemann, M.: The THEMIS fluxgate magnetometer, Space Sci. Rev., 141, 235–264, doi:10.1007/s11214-008-9365-9, 2008.
Baker, D. N., Pulkkinen, T. I., Angelopoulos, V., Baumjohann, W., and McPherron, R. L.: Neutral line model of substorms: Past results and present view, J. Geophys. Res., 101, 12975–13010, doi:10.1029/95JA03753, 1996.
Baumjohann, W., Paschmann, G., and Lühr, H.: Characteristics of High-Speed Ion Flows in the Plasma Sheet, J. Geophys. Res., 95, 3801–3809, doi:10.1029/JA095iA04p03801, 1990.
Birn, J. and Hesse, M.: Substorm features in MHD simulations of magnetotail dynamics, in: Magnetospheric Substorms, Geophys. Monogra. Ser., vol. 64, edited by: Kan, J. R., Potemra, T. A., Kokubun, S., and Iijima, T., p. 177, AGU, Washington, DC, 1991. Chao, J. K., Kan, J. R., Lui, A. T. Y., and Akasofu, S.-I.: A model for thinning of the plasma sheet, Planet. Space Sci., 25, 703–710, 1977.
Chen, C. X. and Wolf, R. A.: Interpretation of high-speed flows in the plasma sheet, J. Geophys. Res., 98, 21409–21419, doi:10.1029/93JA02080, 1993.
Cheng, C. Z. and Lui, A. T. Y.: Kinetic ballooning in-stability for substorm onset and current disruption ob-served by AMPTE/CCE, Geophys. Res. Lett., 25, 4091–4094, doi:10.1029/1998GL900093, 1998.
Dubyagin, S., Sergeev, V., Apatenkov, S., Angelopoulos, V., Naka-mura, R., McFadden, J., Larson, D., and Bonnell, J.: Pres-sure and entropy changes in the flow-braking region during magnetic field dipolarization, J. Geophys. Res., 115, A10225, doi:10.1029/2010JA015625, 2010.
Erkaev, N. V., Semenov, V. S., and Biernat, H. K.: Magnetic double gradient mechanism for flapping oscillations of a current sheet, Geophys. Res. Lett., 35, L02111, doi:10.1029/2007GL032277, 2008.
Haerendel, G.: Equatorward moving arcs and substorm onset, J. Geophys. Res., 115, A07212, doi:10.1029/2009JA015117, 2010. Hones Jr., E. W.: The magnetotail: Its generation and dissipation, in: Physics of Solar Planetary Environments, edited by: Williams, D. J., AGU, Washington, DC, 559–571, 1976.
Ieda, A., Machida, S., Mukai, T., Saito, Y., Yamamoto, T., Nishida, A., Terasawa, T., and Kokubun, S.: Statistical analysis of the
plas-R., McFadden, J. P., Bonnell, J., and Glassmeier, K. H.: Super-posed epoch analysis of magnetotail flux transport during sub-storms observed by THEMIS, J. Geophys. Res., 116, A00I29, doi:10.1029/2010JA015886, 2011.
Lui, A. T. Y.: Current disruption in the Earth’s magnetosphere: Observations and models, J. Geophys. Res., 101, 13067–13088, doi:10.1029/96JA00079, 1996.
Lui, A. T. Y., Meng, C.-I., and Akasofu, S.-I.: Search for the mag-netic neutral line in the near-Earth plasma sheet 2. Systematic study of Imp 6 magnetic field observations, J. Geophys. Res., 82, 1547–1565, doi:10.1029/JA082i010p01547,1977.
Lui, A. T. Y., Mankofsky, A., Chang, C.-L., Papadopoulos, K., and Wu, C. S.: A current disruption mechanism in the neutral sheet: A possible trigger for substorm expansions, Geophys. Res. Lett., 17, 745–748, doi:10.1029/GL017i006p00745, 1990.
Lyons, L. R., Wang, C.-P., and Nagai, T.: Substorm onset by plasma sheet divergence, J. Geophys. Res., 108, 1427, doi:10.1029/2003JA010178, 2003.
Lyons, L. R., Nishimura, Y., Xing, X., Angelopoulos, V., Zou, S., Larson, D., McFadden, J., Runov, A., Mende, S., and Fornacon, K.-H.: Enhanced transport across entire length of plasma sheet boundary field lines leading to substorm onset, J. Geophys. Res., 115, A00I07, doi:10.1029/2010JA015831, 2010.
Machida, S., Mukai, T., Saito, Y., Obara, T., Yamamoto, T., Nishida, A., Hirahara, M., Terasawa, T., and Kokubun, S.: GEOTAIL low energy particle and magnetic field observations of a plas-moid at XGSM= −142RE, Geophys. Res. Lett., 21, 2995–2998, doi:10.1029/94GL02241, 1994.
Machida, S., Miyashita, Y., Ieda, A., Nishida, A., Mukai, T., Saito, Y., and Kokubun, S.: GEOTAIL observations of flow velocity and north–south magnetic field variations in the near and mid-distant tail associated with substorm onsets, Geophys. Res. Lett., 26, 635–638, doi:10.1029/1999GL900030, 1999.
Machida, S., Ieda, A., Mukai, T., Saito, Y., and Nishida, A.: Statistical visualization of Earth’s magnetotail during sub-storms by means of multidimensional superposed epoch anal-ysis with Geotail data, J. Geophys. Res., 105, 25291–25303, doi:10.1029/2000JA900064, 2000.
McFadden, J. P., Carlson, C. W., Larson, D., Angelopoulos, V., Lud-lam, M., Abiad, R., Elliott, B., Turin, P., and Marckwordt, M.: The THEMIS ESA plasma instrument and in-flight calibration, Space Sci. Rev., 141, 277–302, doi:10.1107/s11214-008-9440-2, 2008.
Miyashita, Y., Machida, S., Nishida, A., Mukai, T., Saito, Y., and Kokubun, S.: GEOTAIL observations of total pressure and electric field variations in the near and mid-distant tail associ-ated with substorm onsets, Geophys. Res. Lett., 26, 639–642, doi:10.1029/1999GL900031, 1999.
Miyashita, Y., Machida, S., Mukai, T., Saito, Y., Tsuruda, K., Hayakawa, H., and Sutcliffe, P. R.: A statistical study of vari-ations in the near and middistant magnetotail associated with substorm onsets: GEOTAIL observations, J. Geophys. Res., 105, 15913–15930, doi:10.1029/1999JA000392, 2000.
Miyashita, Y., Machida, S., Liou, K., Mukai, T., Saito, Y., Hayakawa, H., Meng, C.-I., and Parks, G. K.: Evolution of the magnetotail associated with substorm auroral breakups, J. Geo-phys. Res., 108, 1353, doi:10.1029/2003JA009939, 2003. Miyashita, Y., Machida, S., Kamide, Y., Nagata, D., Liou, K.
Fu-jimoto, M., Ieda, A., Saito, M. H., Russell, C. T., Christon, S. P., Nosé, M., Frey, H. U., Shinohara, I., Mukai, T., Saito, Y., and Hayakawa, H.: A state-of-the-art picture of substorm-associated evolution of the near-Earth magnetotail obtained from superposed epoch analysis, J. Geophys. Res., 114, A01211, doi:10.1029/2008JA013225, 2009.
Miyashita, Y., Machida, S., Nosé, M., Liou, K., Saito, Y., and Pa-terson, W. R.: A statistical study of energy release and trans-port midway between the magnetic reconnection and initial dipo-larization regions in the near-Earth magnetotail associated with substorm expansion onsets, J. Geophys. Res., 117, A11214, doi:10.1029/2012JA017925, 2012.
Nagai, T.: Observed Magnetic Substorm Signatures at Syn-chronous Altitude, J. Geophys. Res., 87, 4405–4417, doi:10.1029/JA087iA06p04405, 1982.
Nishida, A.: Geomagnetic Diagnosis of the Magnetosphere (Springer, Heidelberg), 1978.
Nishimura, Y., Lyons, L., Zou, S., Angelopoulos, V., and Mende, S.: Substorm triggering by new plasma intrusion: THEMIS all-sky imager observations, J. Geophys. Res., 115, A07222, doi:10.1029/2009JA015166, 2010.
Nishimura, Y., Lyons, L. R., Xing, X., Angelopoulos, V., Donovan, E. F., Mende, S. B., Bonnell, J. W., and Auster, U.: Identifying the magnetotail source region leading to preonset poleward bound-ary intensifications, J. Geophys. Res. Space Phys., 118, 4335– 4340, doi:10.1002/jgra.50407, 2013.
Pontius Jr., D. H. and Wolf, R. A.: Transient flux tubes in the terrestrial magnetosphere, Geophys. Res. Lett., 17, 49–52, doi:10.1029/GL017i001p00049, 1990.
Pritchett, P. L. and Coroniti, F. V.: A kinetic ballooning/interchange instability in the magnetotail, J. Geophys. Res., 115, A06301, doi:10.1029/2009JA014752, 2010.
Rostoker, G. and Eastman, T.: A boundary layer model for mag-netospheric substorms, J. Geophys. Res., 92, 12187–12201, doi:10.1029/JA092iA11p12187, 1987.
Roux, A., Perraut, S., Robert, P., Morane, A., Pedersen, A., Ko-rth, A., Kremser, G., Aparicio, B., Rodgers, D., and Pellinen, R.: Plasma sheet instability related to the westward traveling surge, J. Geophys. Res., 96, 17697–17714, doi:10.1029/91JA01106, 1991.
Russell, C. T. and McPherron, R. L.: The magnetotail and sub-storms, Space Sci. Rev. 15, 205–266, 1973.
Saito, M. H., Hau, L.-N., Hung, C.-C., Lai, Y.-T., and Chou, Y.-C.: Spatial profile of magnetic field in the near-Earth plasma sheet prior to dipolarization by THEMIS: Feature of minimum B, Geo-phys. Res. Lett., 37, L08106, doi:10.1029/2010GL042813, 2010. Samson, J. C., Wallis, D. D., Hughes, T. J., Creutzberg, F., Ruo-honiemi, J. M., and Greenwald, R. A.: Substorm intensifications and field line resonances in the nightside magnetosphere, J. Geo-phys. Res., 97, 8495–8518, doi:10.1029/91JA03156, 1992. Sergeev, V. A., Angelopoulos, V., Gosling, J. T., Cattell, C. A., and
Russell, C. T.: Detection of localized, plasma-depleted flux tubes or bubbles in the midtail plasma sheet, J. Geophys. Res., 101, 10817–10826, doi:10.1029/96JA00460, 1996.
Shiokawa, K., Baumjohann, W., and Haerendel, G.: Braking of high-speed flows in the near-Earth tail, Geophys. Res. Lett., 24, 1179–1182, doi:10.1029/97GL01062, 1997.
Shue, J.-H., Ieda, A., Lui, A. T. Y., Parks, G. K., Mukai, T., and Ohtani, S.: Two classes of earthward fast flows in the plasma sheet, J. Geophys. Res., 113, A02205, doi:10.1029/ 2007JA012456, 2008.
Sitnov, M. I. and Schindler, K.: Tearing stability of a multiscale magnetotail current sheet, Geophys. Res. Lett., 37, L08102, doi:10.1029/2010GL042961, 2010.
Slavin, J. A., Fairfield, D. H., Lepping, R. P., Szabo, A., Reiner, M.J., Kaiser, M., Owen, C. J., Phan, T., Lin, R., Kokubun, S., Mukai, T., Yamamoto, T., Singer, H. J., Romanov, S.A., Buech-ner, J., Iyemori, T., and Rostoker, G.: WIND, GEOTAIL, and GOES 9 observations of magnetic field dipolarization and bursty bulk flows in the near-tail, Geophys. Res. Lett., 24, 971–974, doi:10.1029/97GL00542, 1997.
Smith, R. A., Goertz, C. K., and Grossman, W.: Thermal catastro-phe in the plasma sheet boundary layer, Geophys. Res. Lett., 13, 1380–1383, doi:10.1029/GL013i013p01380, 1986.
Tsyganenko, N. A. and Fairfield, D. H.: Global shape of the mag-netotail current sheet as derived from Geotail and Polar data, J. Geophys. Res., 109, A03218, doi:10.1029/2003JA010062, 2004. Xing, X., Lyons, L. R., Angelopoulos, V., Larson, D., Carlson, C., Runov, A., and Auster, U.: Plasma sheet pressure evo-lution related to substorms, J. Geophys. Res., 115, A01212, doi:10.1029/2009JA014315, 2010a.