Development and comparison
of artificial neural network and statistical
model for prediction of thermo‑physiological
properties of polyester–cotton plated fabrics
Y. Jhanji
1*, V. K. Kothari
2and D. Gupta
2Introduction
Prediction of functional and performance properties of textiles before the actual com-mencement of fabric production and testing can serve as an effective tool in character-ization and designing of fabrics for any desired application. The thermo-physiological
Abstract
Thermo-physiological properties of textiles play a very crucial role in providing thermal equilibrium to human beings in changing ambient conditions and activity level and in turn dictate the overall wearer comfort. A number of prediction tools like mechanis-tic, statistical and stochastic (artificial neural network) models are finding application in textiles for reasonable prediction of various aspects of textiles before the actual commencement of fabric production and testing. In this study, thermo-physiological properties of polyester–cotton plated fabrics were predicted by two approaches: artifi-cial neural network and response surface equations. A multilayered back propagation artificial neural network was developed with four input nodes corresponding to four selected input parameters: back layer yarn linear density, filament fineness, total yarn linear density and loop length and one output node corresponding to the predicted thermo-physiological property. Four individual networks working in tandem with com-mon set of input parameters and each giving an individual output were developed such that the outputs of four networks were thermal resistance, thermal absorptivity, air permeability and moisture vapour transmission rate respectively. Network architec-ture gave good prediction performance with low values of mean absolute percentage error and high coefficient of determination. Response surface equations were devel-oped to predict the thermo-physiological properties and good agreement between experimental and predicted values for all the properties was found with coefficient of determination over 0.9. Artificial neural network predicted the thermal resistance and air permeability of plated fabrics with good accuracy. However, the response surface equations served better prediction tool for thermal absorptivity and moisture vapour transmission rate prediction.
Keywords: Mean absolute percentage error, Neural network, Plated knitted fabrics, Response surface, Thermo-physiological properties
Open Access
© 2016 The Author(s). This article is distributed under the terms of the Creative Commons Attribution 4.0 International License (http://creativecommons.org/licenses/by/4.0/), which permits unrestricted use, distribution, and reproduction in any medium, provided you give appropriate credit to the original author(s) and the source, provide a link to the Creative Commons license, and indicate if changes were made.
RESEARCH
*Correspondence: [email protected] 1 Department of Fashion & Apparel Engineering, Technological Institute of Textile & Science, Bhiwani, India
properties of textile materials can be predicted by (a) mechanistic models (b) statistical models (c) artificial neural network. Artificial neural network is a stochastic (based on probabilistic method) and heuristic model (action based on prior experience) (Zurada 1997; Bhattacharjee 2007; Kothari and Bhattacharjee 2011). It simulates the function-ing of a biological neuron and every component of the network is analogous to the actual constituents or operations of a biological neuron (Zurada 1997; Majumdar 2011a,
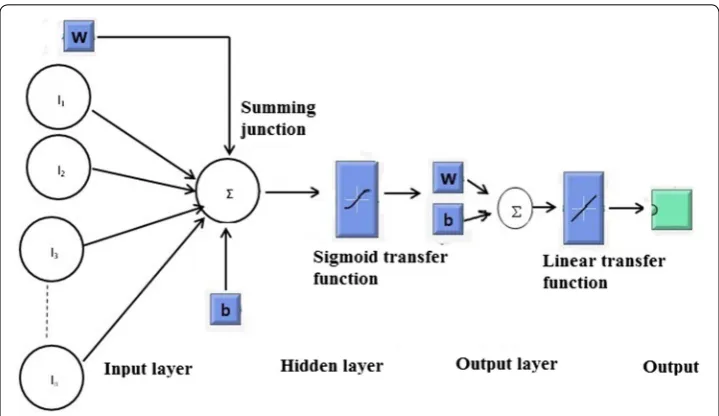
2011b). Network architecture of the neural network determines its prediction efficacy
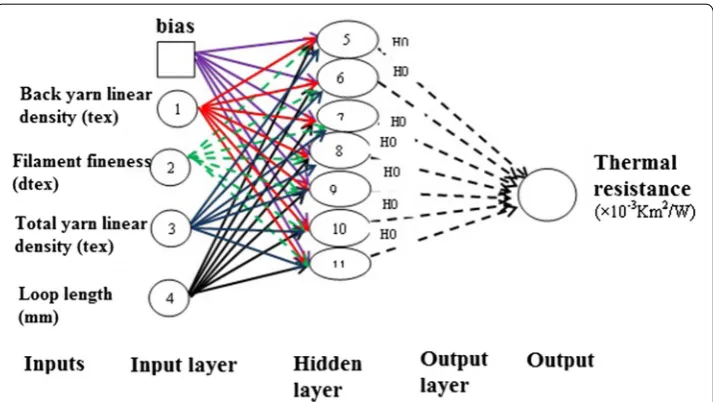
and is composed of several structural parameters as shown in Fig. 1. Number of hid-den layers, number of nodes connected with bias in each of the hidhid-den layers, summa-tion and the transfer funcsumma-tion in hidden and output layers are the important structural parameters of neural network (Yadav and Kothari 2004). Data set presented to neural network is characterized into training and testing set (Majumdar 2011a, 2011b; Yadav and Kothari 2004). Adjusted weights and biases of the network are determined from the training set and the test set is used for calibration to prevent overtraining networks. Optimization of network performance can be ensured during the training process which involves fine tuning the values of weights and biases of the network. Back propagation algorithm is commonly used algorithm for the training of neural network. Back prop-agation algorithm is used to update network weights and biases in direction in which performance function (mse) decreases most rapidly (Demuth and Beale 2004; Bhat-tacharjee and Kothari 2007). One iteration of the algorithm can be expressed by follow-ing equation:
where xk, is the vector of current weight and biases, αk, the learning rate and gk, the cur-rent gradient.
Attempts have been made to predict the physical, mechanical and comfort proper-ties of woven, non-woven and knitted fabrics using various prediction tools. Most of the
(1)
xk+1=xk−αkgk
work is focused on modelling the fibre-yarn relationship, yarn tenacity, fault detection, compression, elastic properties and hand values of woven, nonwoven and knitted fab-rics. Although some studies have discussed prediction of thermal properties i.e. thermal resistance, thermal conductivity of woven and knitted fabrics, none of the studies give a detailed review of the modelling of comfort properties particularly thermal absorptiv-ity and moisture vapour transmission rate of plated knitted fabrics. Moreover, very few studies are devoted to the prediction of thermo-physiological properties: thermal prop-erties, air permeability and moisture vapour transmission rate collectively. An attempt is therefore made to model the thermo-physiological properties of plated knitted fab-rics from constructional parameters like back yarn linear density, filament fineness, loop length and total yarn linear density using statistical and artificial neural network approach and comparison of the developed models in terms of their prediction perfor-mance and robustness.
Methods
Materials
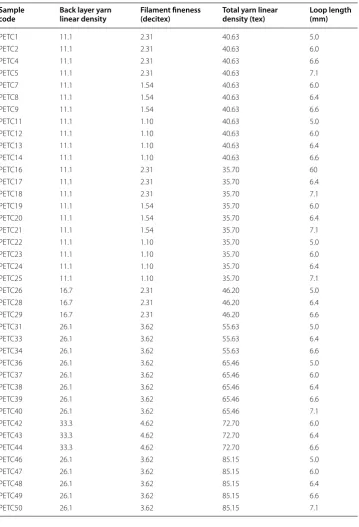
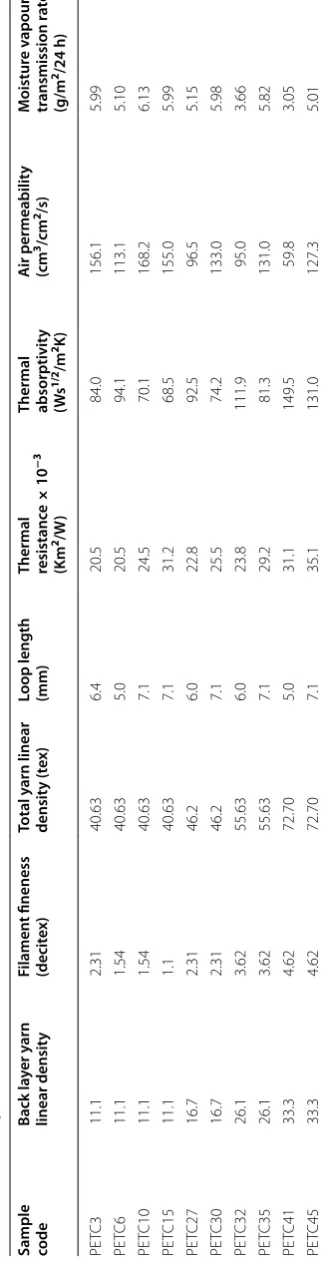
A total of 50 PET/C plated knitted fabrics were used for the study. Out of the 50 samples, 40 samples (80 %) were presented as training set to neural network and remaining 10 samples (20 %) were used as the testing set. The prediction performance and robustness of artificial neural network depends on selection of training data owing to basic nature of neural network to learn from training through back propagation. Larger the training data set, better the training and prediction efficacy of neural network. Accordingly, fifty single jersey plated fabrics with varying combinations of yarn and fabric variables were chosen to formulate a neural network. Fabric specifications of training and test set are shown in Tables 1 and 2.
Thermal properties
Fabric samples were tested for their thermal properties: thermal resistance and thermal absorptivity on Alambeta (Sensora, Czech Republic). In this instrument fabric is kept between hot and cold plate. The heat transfer from hot plate to cold plate through fabric is determined by the instrument.
Air permeability
Test fabrics were evaluated for their air permeability on FX 3300 air permeability tester (TEXTEST AG, Switzerland) at a pressure of 98 Pa according to ASTM D 737.
Moisture vapour transmission rate
Moisture vapour transmission rate of the fabrics was tested on moisture vapour trans-mission cell (MVTR cell) (Grace, Cryov ac division). Amount of water vapour that transmits through 100 inch2 fabric area during period of 24 h can be determined by
where RH %, is the average difference in successive % RH values, t, the time interval in
minutes and H, the gms water per m3 of air at cell temperature (Varshney et al. 2010). (2) MVTR = (269× 10−7)
�RH % × 1440
t
H Table 1 Training set specifications
Sample
code Back layer yarn linear density Filament fineness (decitex) Total yarn linear density (tex) Loop length (mm)
PETC1 11.1 2.31 40.63 5.0
PETC2 11.1 2.31 40.63 6.0
PETC4 11.1 2.31 40.63 6.6
PETC5 11.1 2.31 40.63 7.1
PETC7 11.1 1.54 40.63 6.0
PETC8 11.1 1.54 40.63 6.4
PETC9 11.1 1.54 40.63 6.6
PETC11 11.1 1.10 40.63 5.0
PETC12 11.1 1.10 40.63 6.0
PETC13 11.1 1.10 40.63 6.4
PETC14 11.1 1.10 40.63 6.6
PETC16 11.1 2.31 35.70 60
PETC17 11.1 2.31 35.70 6.4
PETC18 11.1 2.31 35.70 7.1
PETC19 11.1 1.54 35.70 6.0
PETC20 11.1 1.54 35.70 6.4
PETC21 11.1 1.54 35.70 7.1
PETC22 11.1 1.10 35.70 5.0
PETC23 11.1 1.10 35.70 6.0
PETC24 11.1 1.10 35.70 6.4
PETC25 11.1 1.10 35.70 7.1
PETC26 16.7 2.31 46.20 5.0
PETC28 16.7 2.31 46.20 6.4
PETC29 16.7 2.31 46.20 6.6
PETC31 26.1 3.62 55.63 5.0
PETC33 26.1 3.62 55.63 6.4
PETC34 26.1 3.62 55.63 6.6
PETC36 26.1 3.62 65.46 5.0
PETC37 26.1 3.62 65.46 6.0
PETC38 26.1 3.62 65.46 6.4
PETC39 26.1 3.62 65.46 6.6
PETC40 26.1 3.62 65.46 7.1
PETC42 33.3 4.62 72.70 6.0
PETC43 33.3 4.62 72.70 6.4
PETC44 33.3 4.62 72.70 6.6
PETC46 26.1 3.62 85.15 5.0
PETC47 26.1 3.62 85.15 6.0
PETC48 26.1 3.62 85.15 6.4
PETC49 26.1 3.62 85.15 6.6
Table
2
T
est set sp
ecific
ations
Sample code
Back la yer y arn linear densit y Filamen t fineness (decit ex) Total y arn linear densit y (t ex)
Loop length (mm) Thermal resistanc
e × 10 − 3 (K m 2/W )
Thermal absorptivit
Development of artificial neural network (ANN)
Multilayered back propagation feed forward neural network was used to predict the thermo-physiological properties of plated fabrics. All the programming was done using MATLAB software neural network toolbox. Sigmoid transfer function ‘tansig’ was used for input and hidden layers and a linear function ‘purelin’ was used for the output layer. Normalization was applied to both input and target vectors. ‘Mapminmax’ function was used to normalize inputs and targets to fall in the range of −1 to 1. Network was trained using ‘trainlm’ function which is Levenberg–Marquardt algorithm. ‘trainlm’ is consid-ered the fastest method for training moderate sized feed forward neural networks and is most suitable for non-linear regression.
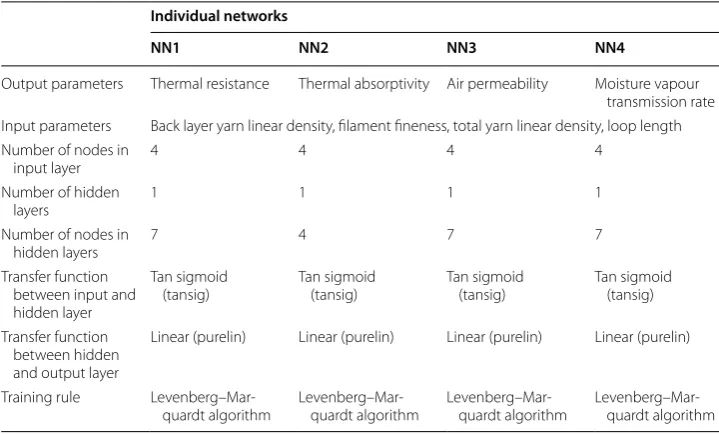
Network architecture consisted of four sequential networks (NN1, NN2, NN3 and NN4) working in tandem with input layer of 4 nodes corresponding to four input param-eters: back layer yarn linear density, filament fineness, total yarn linear density and loop length and an output layer of 1 node corresponding to the property to be predicted. Thus the four different networks fed with common set of inputs gave individual single outputs i.e. output of NN1 was thermal resistance, output of NN2 was thermal absorptivity, air permeability and moisture vapour transmission rates were the outputs of NN3 and NN4 respectively. Three layered network with one input layer, one hidden layer and one out-put layer was used for the four networks. The number of neurons was fixed after many trials to 7, 4, 7 and 7 for NN1, NN2, NN3 and NN4 respectively. Structural elements of network architectures are presented in Table 3.
Number of epochs required for the networks to converge was 10, 32, 18 and 16 for the four networks respectively. Figure 2 shows the network architecture of the developed model with the weight and bias connections between different layers of network.
Developed network was analyzed for the prediction performance in terms of mean absolute percentage error and coefficient of determination. Over fitting is the most com-mon problem with ANN when network memorizes the training examples but fails to
Table 3 Structural elements of individual network architectures Individual networks
NN1 NN2 NN3 NN4
Output parameters Thermal resistance Thermal absorptivity Air permeability Moisture vapour transmission rate Input parameters Back layer yarn linear density, filament fineness, total yarn linear density, loop length Number of nodes in
input layer 4 4 4 4
Number of hidden
layers 1 1 1 1
Number of nodes in
hidden layers 7 4 7 7
Transfer function between input and hidden layer
Tan sigmoid
(tansig) Tan sigmoid (tansig) Tan sigmoid (tansig) Tan sigmoid (tansig)
Transfer function between hidden and output layer
Linear (purelin) Linear (purelin) Linear (purelin) Linear (purelin)
Training rule
generalize new unseen test data set. Over fitting was avoided by regularization. Perfor-mance function mse was modified to msereg. Equations (3) and (4) show the calculations
involved in determining mse and msereg respectively. Mean square weight used to
deter-mine msereg was obtained from Eq. (5) and mean absolute percentage error (MAPE) was
calculated using [Eq. (6)].
where mse is the mean square error, Ta is the ath target (experimental) value, Pa is the ath predicted (network calculated) value and n is the number of observations.
where msereg is the modified performance function for regularization, msw is the mean
square weight and γ is the performance ratio.
where MAPE is the mean absolute percentage error, Ta is the ath target (experimen-tal) value, Pa is the ath predicted (network calculated) value and N is number of input parameters.
(3) mse= 1
N N
a=1
[Ta−Pa]2
(4) msereg =γmse+(1−γ )msw
(5)
msw= 1 N
N
a=1
Wa2
(6) MAPE= 1
N
N
a=1
|Ta−Pa|
Ta
×100
Response surface fitting regression analysis
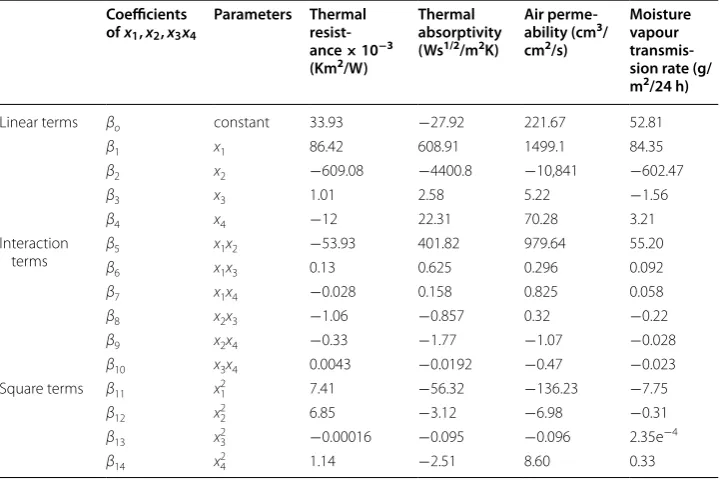
Statistical modelling was accomplished by response surface fitting regression analysis with a polynomial to check the linear, squared and interaction effects of the yarn and fabric input parameters together on thermo-physiological properties of plated fabrics. The response surface for quadratic polynomials can be expressed by following equation:
where y, is the response function, x, the input parameter, k, the number of variables and
β, coefficient. The first term on right hand side comprises of linear coefficients, the sec-ond term comprises of interaction coefficients and the third term comprises of square coefficients.
Four input parameters were used for the development of response surface regres-sion analysis. Response surface for four input parameters can be expressed by following equation:
The coefficients for the equations were generated using response surface tool ‘rstool’ in MATLAB statistical toolbox. Table 4 presents the linear, interaction and square coef-ficients when four input parameters i.e. back layer yarn linear density, filament fineness, total yarn linear density and loop length were considered.
(7) y = βo +
k
a=1
βaxa + k−1
b=1
k
a=b+1
βbaxbxa + k
a=1
βaax2a
(8)
y= βo+β1x1+β2x2+β3x3+β4x4+β5x1x2+β6x1x3+β7x1x4+β8x2x3+β9x2x4
+β10x3x4+β11x21+β12x22+β13x23 +β14x42
Table 4 Coefficients for response surface equations for four input parameters
x1 is back layer yarn linear density (tex), x2 is filament fineness (decitex), x3 is total yarn linear density (tex) and x4 is loop
length (mm)
Coefficients of x1,x2,x3x4
Parameters Thermal resist-ance × 10−3
(Km2/W)
Thermal absorptivity (Ws1/2/m2K)
Air perme-ability (cm3/
cm2/s)
Moisture vapour transmis-sion rate (g/ m2/24 h)
Linear terms βo constant 33.93 −27.92 221.67 52.81
β1 x1 86.42 608.91 1499.1 84.35
β2 x2 −609.08 −4400.8 −10,841 −602.47
β3 x3 1.01 2.58 5.22 −1.56
β4 x4 −12 22.31 70.28 3.21
Interaction
terms ββ5 x1x2 −53.93 401.82 979.64 55.20
6 x1x3 0.13 0.625 0.296 0.092
β7 x1x4 −0.028 0.158 0.825 0.058
β8 x2x3 −1.06 −0.857 0.32 −0.22
β9 x2x4 −0.33 −1.77 −1.07 −0.028
β10 x3x4 0.0043 −0.0192 −0.47 −0.023
Square terms β11 x12 7.41 −56.32 −136.23 −7.75
β12 x22 6.85 −3.12 −6.98 −0.31
β13 x32 −0.00016 −0.095 −0.096 2.35e−4
Results and discussion
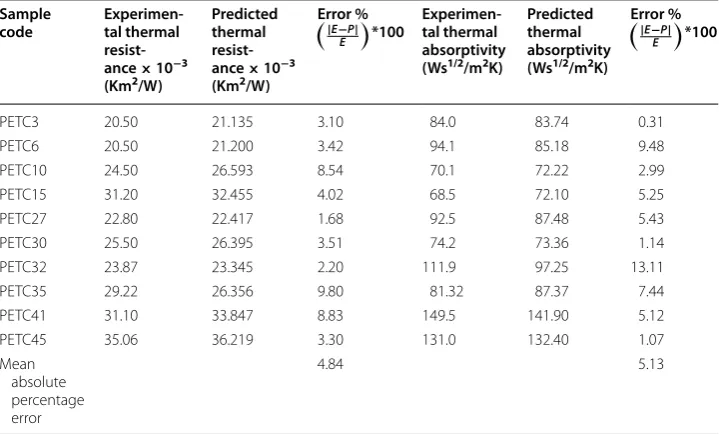
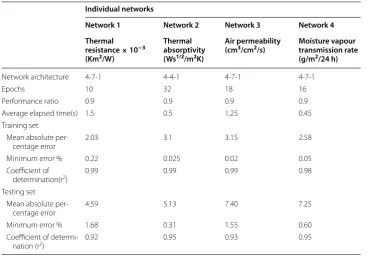
Prediction performance of the developed network architecture i.e. individual networks (NN1, NN2, NN3 & NN4) was analyzed in terms of mean absolute percentage error (MAPE) and coefficient of determination (R2). Individual errors between experimental
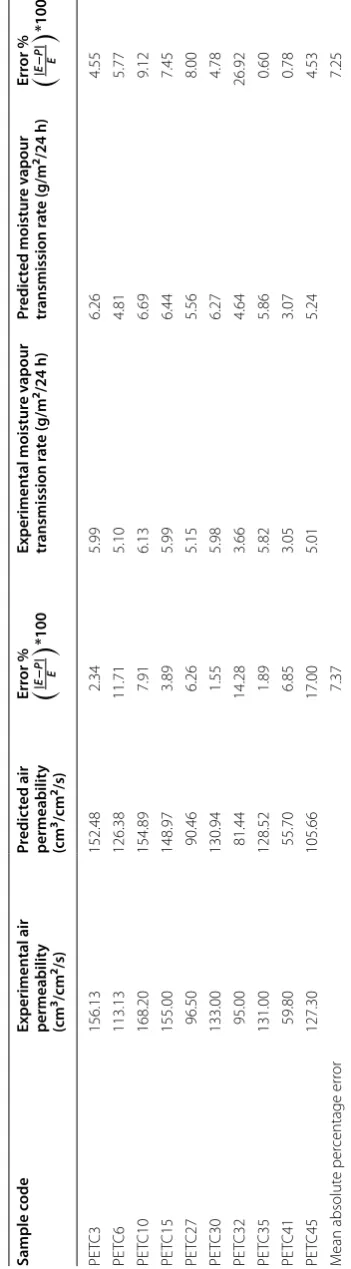
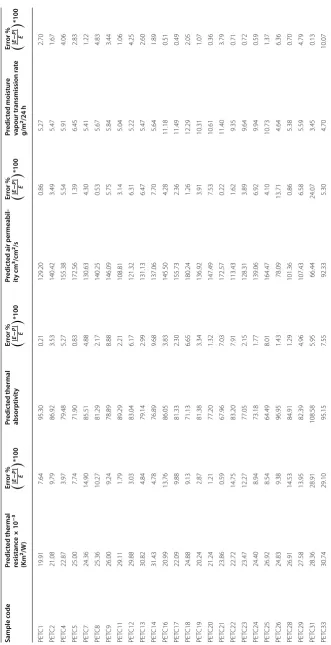
and ANN predicted values and mean absolute percentage error of thermal resistance, thermal absorptivity, air permeability and moisture vapour transmission rate were calcu-lated and are summarized in Tables 5 and 6. Table 7 shows the performance parameters of network architecture. Mean absolute percentage error for thermal resistance, thermal absorptivity, air permeability and moisture vapour transmission rate were 2.03, 3.1, 3.15 and 2.58 % for training data set and 4.59, 5.13, 7.40 and 7.25 % respectively for test data set for individual networks to predict four properties individually.
Individual error % and mean absolute percentage errors for all four properties under consideration were quite low suggesting that ANN could predict the thermo-physiologi-cal properties in close agreement with experimental values.
Individual networks (NN1, NN2, NN3 & NN4) used just one hidden layer and 10, 32, 18 and 16 number of epochs respectively to reduce performance function and took 0.93 s to converge (Table 7).
Prediction performance
Individual networks giving four single outputs was observed to predict the thermo-physiological properties with good coefficient of determination of 0.92, 0.95, 0.93 and 0.95 for thermal resistance, thermal absorptivity, air permeability and moisture vapour transmission rate respectively as shown in Table 7.
The predicted thermo-physiological properties of plated fabrics by ANN were in close agreement with target outputs (experimental values) which proves the robustness and generalization ability of the network. However, the mean absolute percentage error in Table 5 Individual errors between experimental and predicted values of thermal resist-ance & thermal absorptivity by ANN
Sample
code Experimen-tal thermal resist-ance × 10−3
(Km2/W)
Predicted thermal resist-ance × 10−3
(Km2/W)
Error %
| E−P|
E
*100 Experimen-tal thermal absorptivity (Ws1/2/m2K)
Predicted thermal absorptivity (Ws1/2/m2K)
Error %
| E−P|
E
*100
PETC3 20.50 21.135 3.10 84.0 83.74 0.31
PETC6 20.50 21.200 3.42 94.1 85.18 9.48
PETC10 24.50 26.593 8.54 70.1 72.22 2.99
PETC15 31.20 32.455 4.02 68.5 72.10 5.25
PETC27 22.80 22.417 1.68 92.5 87.48 5.43
PETC30 25.50 26.395 3.51 74.2 73.36 1.14
PETC32 23.87 23.345 2.20 111.9 97.25 13.11
PETC35 29.22 26.356 9.80 81.32 87.37 7.44
PETC41 31.10 33.847 8.83 149.5 141.90 5.12
PETC45 35.06 36.219 3.30 131.0 132.40 1.07
Mean absolute percentage error
Table 6 I ndividual err ors b et w een e xp erimen tal and pr edic ted v
alues of air p
ermeabilit
y & moistur
the prediction of air permeability and moisture vapour transmission rate of plated fabrics were on slightly higher side. The input parameters selected for the network construction namely back layer yarn linear density, filament fineness, loop length and total yarn lin-ear density influence the fabrics bulk properties like thickness, fabric weight which are the determinants of thermal properties. The selected input parameters were found to be sufficient for prediction of thermal properties. However, air permeability depends on the openness of the fabric structure or the free inter yarn spaces in the fabric and hence fabric porosity. The exclusion of porosity as one of the input parameters might be the reason for high mean absolute percentage error in prediction of air permeability. Moisture vapour transmission rate through fabrics depend on free air spaces in the fabric for moisture dif-fusion and moisture diffusivity of the fibres. Hydrophilic and hydrophobic nature of the fibre can affect the moisture diffusion through textiles significantly. The inclusion of con-stituent fibres as one of the input parameter to neural network may result in lowering the error percentage in prediction of moisture vapour transmission rate.
Comparison of artificial neural network (ANN) and statistical model
Developed network architecture was compared with response surface fitting regression analysis in terms of the robustness, generalization ability of the models which in turn depends on the prediction performance parameters: mean absolute percentage error and coefficient of determination. Statistical modelling was accomplished by response surface fitting regression analysis with a polynomial to check the linear, squared and interaction effects of the yarn and fabric input parameters together on thermo-physiological prop-erties of plated fabrics. Table 8 shows the individual error percentage and mean absolute percentage error between experimental and response surface equations predicted values of thermo-physiological properties.
Table 7 Performance parameters of network architectures Individual networks
Network 1 Network 2 Network 3 Network 4 Thermal
resistance × 10−3
(Km2/W)
Thermal absorptivity (Ws1/2/m2K)
Air permeability
(cm3/cm2/s) Moisture vapour transmission rate
(g/m2/24 h)
Network architecture 4-7-1 4-4-1 4-7-1 4-7-1
Epochs 10 32 18 16
Performance ratio 0.9 0.9 0.9 0.9
Average elapsed time(s) 1.5 0.5 1.25 0.45
Training set Mean absolute
per-centage error 2.03 3.1 3.15 2.58
Minimum error % 0.22 0.025 0.02 0.05
Coefficient of
determination(r2) 0.99 0.99 0.99 0.98
Testing set Mean absolute
per-centage error 4.59 5.13 7.40 7.25
Minimum error % 1.68 0.31 1.55 0.60
Coefficient of
Table 8 I ndividual err ors b et w een e xp erimen tal and r esp onse sur fac e equa tions pr edic ted v alues of thermo -ph ysiolo gic al pr op er ties Sample c ode Pr edic ted thermal resistanc e × 10 − 3 (K m 2/W ) Err or % | E − P | E *100 Pr edic ted thermal absorptivit y Err or % | E − P | E *100 Pr edic
ted air permeabil
Table 8 c on tinued Sample c ode Pr edic ted thermal resistanc e × 10 − 3 (K m 2/W ) Err or % | E − P | E *100 Pr edic ted thermal absorptivit y Err or % | E − P | E *100 Pr edic
ted air permeabil
Analysis of mean absolute percentage error and coefficient of determination shows that prediction models using two different approaches i.e. ANN and response surface fitting equations were able to explain over 90 % variability in the thermo-physiological properties as suggested by R2 value over 0.9 for all the predicted properties. Table 9
shows the comparison of mean absolute percentage error for training and test data set of ANN and response surface equations. It is evident that mean absolute percent-age error for training set of ANN is lower than response surface equations for all the thermo-physiological properties. However, different trend was observed when test set performance parameters of ANN were compared with response surface equations. ANN showed less prediction error in predicting the thermal resistance (MAPE 4.59 as against 15.99 for response surface fitting equations) and air permeability (MAPE 7.40 against 12.48 for response surface fitting equations) of plated fabrics as compared to response surface equations (Table 9). However, response surface model shows the ability to pre-dict the thermal absorptivity (MAPE 3.51 against 5.13 for ANN) and moisture vapour transmission rate (MAPE 4.02 against 7.3 for ANN) better characterized by low mean absolute error percentage and higher coefficient of determination R2 (Table 10) when
compared to test data set of ANN for the two properties. Prediction performance and generalization ability of neural network depends on training data as well as input param-eters. Thermal absorptivity is a transient heat transfer property which is reported to be dependent on yarn and fabric surface characteristics apart from the bulk properties. Slightly high error in prediction of thermal absorptivity by ANN might be the outcome of the fabric surface texture and yarn roughness not being included as input parameters in the development of neural network. However, the coefficient of determination for ANN was close to response surface model suggesting that both the approaches could be used for prediction of thermal absorptivity.
Table 9 Comparison of mean absolute error percentage for artificial neural network and response surface equations
Mean absolute percentage error
ANN Response surface equations Training Testing
Thermal resistance 2.03 4.59 15.99
Thermal absorptivity 3.10 5.13 3.51
Air permeability 3.15 7.40 12.48
Moisture vapour transmission rate 2.58 7.3 4.02
Table 10 Comparison of R2 for artificial neural network and response surface equations
ANN Response surface equations Training Testing
Thermal resistance 0.99 0.92 0.93
Thermal absorptivity 0.99 0.95 0.98
Air permeability 0.99 0.93 0.97
Moisture vapour transmission rate depends on inter yarn spaces available in the fab-ric structure and the fibre’s moisture diffusivity. High mean absolute percentage error in prediction of moisture vapour transmission rate by ANN might again be related to non-inclusion of fibre parameters taking into the account the hydrophobicity and hydrophi-licity of the fibres. However, R2 value of 0.90 by ANN against 0.99 (Table 10) for response
surface equations was good enough to predict the moisture vapour transmission rate by ANN.
Conclusions
Comparison of ANN and response surface equations in terms of their prediction per-formance showed that both the approaches could explain over 90 % variability in the thermo-physiological properties (R2 value over 0.9). ANN showed less prediction error
in predicting the thermal resistance and air permeability of plated fabrics as suggested by low values of mean absolute percentage error compared to response surface equations. However, response surface equations predicted the thermal absorptivity and moisture vapour transmission rate with higher R2 compared to ANN.
Developed artificial neural network can serve as a boon to industries which are focus-ing mainly on heat and air transport through fabrics. Response surface models can be successfully put to practical use for industries where prime focus is the sensation con-sumer feels on brief contact with skin (thermal absorptivity) and moisture transfer prop-erties through fabrics as both factors determine the overall wearer comfort. Thus based on the consumer’s needs and expectations, application area and serviceability criteria, either of the two models can be successfully implemented in the textile industry for prediction of thermo-physiological properties to have first hand observation before the commencement of actual fabric production and evaluation.
Abbreviations
I: input from previous layer; Wqp: weight connecting hidden neuron q and input neuron p; φ: bias weights; ∅: transfer function; xk: vector of current weight and biases; αk: learning rate; gk: current gradient; Ta: ath target output; Pa: ath predicted output; N: number of training patterns; mse: mean square error; msereg: mean square error regression; γ: perfor-mance ratio; msw: mean square weight; MAPE: mean absolute percentage error.
Authors’ contributions
YJ, VKK and DG predicted thermo-physiological properties of polyester–cotton plated fabrics by two approaches: artificial neural network and response surface equations. Four individual networks working in tandem with common set of input parameters and each giving an individual output were developed and the manuscript was drafted. All authors read and approved the final manuscript.
Author details
1 Department of Fashion & Apparel Engineering, Technological Institute of Textile & Science, Bhiwani, India. 2 Department of Textile Technology, Indian Institute of Technology, Delhi, India.
Competing interests
The authors declare that they have no competing interests.
Received: 18 November 2015 Accepted: 9 August 2016
References
Bhattacharjee, D. (2007). Studies on thermal transmission properties of fabrics. Ph.D. Dissertation, Indian Institute of Technology, New Delhi.
Bhattacharjee, D., & Kothari, V. K. (2007). A neural network system for prediction of thermal resistance of textile fabrics.
Demuth, H., & Beale, M. (2004). Neural network toolbox, user’s guide version 4, The Mathworks Inc, http://www.math-works.com/access/helpdesk/help/nnet/nnet.pdf. Accessed 15 May 2014.
Kothari, V. K., & Bhattacharjee, D. (2011). Soft computing in textile engineering (pp. 403–423). New Delhi: Woodhead publishing.
Majumdar, A. (2011a). Soft computing in fibrous materials engineering. Textile Progress,43, 54–57. Majumdar, A. (2011b). Soft computing in textile engineering (pp. 404–409). New Delhi: Woodhead Publishing. Varshney, R. K., Kothari, V. K., & Dhamija, S. (2010). A study on thermo-physiological comfort properties of fabrics in
rela-tion to constituent fibre fineness and cross-secrela-tional shapes. Journal of the Textile Institute,101, 495–505. Yadav, V. K., & Kothari, V. K. (2004). Prediction of air-jet textured yarn properties using statistical method and neural
net-work. Indian Journal of Fibre and Textile Research,29, 149–156.