The Thirty-Third AAAI Conference on Artificial Intelligence (AAAI-19)
Multi
3Net: Segmenting Flooded Buildings via Fusion of Multiresolution,
Multisensor, and Multitemporal Satellite Imagery
Tim G. J. Rudner,
1†Marc Rußwurm,
2†Jakub Fil,
3†Ramona Pelich,
4†Benjamin Bischke,
5,6†Veronika Kopaˇckov´a,
7Piotr Bili ´nski
1,81University of Oxford,2Technical University of Munich,3University of Kent,4Luxembourg Institute of Science & Technology 5Technical University of Kaiserslautern,6DFKI,7Czech Geological Survey,8University of Warsaw
[email protected], [email protected], [email protected], [email protected], [email protected], [email protected], [email protected]
Abstract
We propose a novel approach for rapid segmentation of flooded buildings by fusing multiresolution, multisensor, and multitemporal satellite imagery in a convolutional neural net-work. Our model significantly expedites the generation of satellite imagery-based flood maps, crucial for first respon-ders and local authorities in the early stages of flood events. By incorporating multitemporal satellite imagery, our model allows for rapid and accurate post-disaster damage assess-ment and can be used by governassess-ments to better coordinate medium- and long-term financial assistance programs for af-fected areas. The network consists of multiple streams of encoder-decoder architectures that extract spatiotemporal in-formation from medium-resolution images and spatial infor-mation from high-resolution images before fusing the result-ing representations into a sresult-ingle medium-resolution segmen-tation map of flooded buildings. We compare our model to state-of-the-art methods for building footprint segmentation as well as to alternative fusion approaches for the segmen-tation of flooded buildings and find that our model performs best on both tasks. We also demonstrate that our model pro-duces highly accurate segmentation maps of flooded build-ings using only publicly available medium-resolution data instead of significantly more detailed but sparsely available very high-resolution data. We release the first open-source dataset of fully preprocessed and labeled multiresolution, multispectral, and multitemporal satellite images of disaster sites along with our source code.
Introduction
In 2017, Houston, Texas, the fourth largest city in the United States, was hit by tropical storm Harvey, the worst storm to pass through the city in over 50 years. Harvey flooded large parts of the city, inundating over 154,170 homes and lead-ing to more than 80 deaths. Accordlead-ing to the US National Hurricane Center, the storm caused over 125 billion USD in damage, making it the second-costliest storm ever recorded in the United States. Floods can cause loss of life and sub-stantial property damage. Moreover, the economic ramifi-cations of flood damage disproportionately impact the most vulnerable members of society.
Copyright c2019, Association for the Advancement of Artificial Intelligence (www.aaai.org). All rights reserved.
†Equal contribution.
When a region is hit by heavy rainfall or a hurricane, authorized representatives of national civil protection, res-cue, and security organizations can activate the International Charter ‘Space and Major Disasters’. Once the Charter has been activated, various corporate, national, and international space agencies task their satellites to acquire imagery of the affected region. As soon as images are obtained, satellite imagery specialists visually or semi-automatically interpret them to create flood maps to be delivered to disaster relief organizations. Due to the semi-automated nature of the map generation process, delivery of flood maps can take several hours after the imagery was provided.
We propose Multi3Net, a novel approach for rapid and ac-curate flood damage segmentation by fusing multiresolution and multisensor satellite imagery in a convolutional neu-ral network (CNN). The network consists of multiple deep encoder-decoder streams, each of which produces an output map based on data from a single sensor. If data from mul-tiple sensors is available, the streams are combined into a joint prediction map. We demonstrate the usefulness of our model for segmentation of flooded buildings as well as for conventional building footprint segmentation.
Our method aims to reduce the amount of time needed to generate satellite imagery-based flood maps by fusing images from multiple satellite sensors. Segmentation maps can be produced as soon as at least a single satellite age acquisition has been successful and subsequently be im-proved upon once additional imagery becomes available. This way, the amount of time needed to generate satel-lite imagery-based flood maps can be reduced significantly, helping first responders and local authorities make swift and well-informed decisions when responding to flood events. Additionally, by incorporating multitemporal satellite im-agery, our method allows for a speedy and accurate post-disaster damage assessment, helping governments better co-ordinate medium- and long-term financial assistance pro-grams for affected areas.
The main contributions of this paper are (1) the develop-ment of a new fusion method for multiresolution, multisen-sor, and multitemporal satellite imagery and (2) the creation and release of a dataset containing labeled multisensor and multitemporal satellite images of multiple disaster sites.1
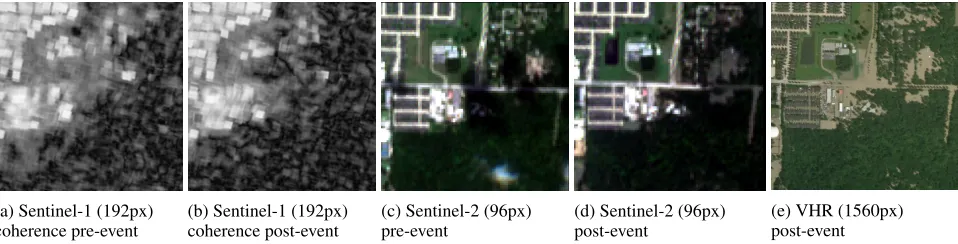
(a) Sentinel-1 (192px)
coherence pre-event (b) Sentinel-1 (192px)coherence post-event (c) Sentinel-2 (96px)pre-event (d) Sentinel-2 (96px)post-event (e) VHR (1560px)post-event
Figure 1: One image tile of 960m×960m is used as network input. Figures (a) and (b) illustrate Sentinel-1 coherence images
before and after the flood event, whereas Figures (c) and (d) show RGB representations of multispectral Sentinel-2 optical im-ages. Figure (e) shows the high level of spatial details in a very high-resolution image. While the medium-resolution (Sentinel-1 and Sentinel-2) images contain temporal information, the very high-resolution image encodes more spatial detail.
Background: Earth Observation
There is an increasing number of satellites monitoring the Earth’s surface, each designed to capture distinct surface properties and to be used for a specific set of applications. Satellites with optical sensors acquire images in the visible and short-wavelength parts of the electromagnetic spectrum that contain information about chemical properties of the captured scene. Satellites with radar sensors, in contrast, use longer wavelengths than those with optical sensors, allow-ing them to capture physical properties of the Earth’s sur-face (Soergel 2010). Radar images are widely used in the fields ofEarth observationandremote sensing, since radar
image acquisitions are unaffected by cloud coverage or lack of light (Ulaby et al. 2014). Examples of medium- and very high-resolution optical and medium-resolution radar images are shown in Figure 1.
Remote sensing-aided disaster response typically uses very high-resolution (VHR) optical and radar imagery. Very high-resolution optical imagery with a ground resolution of less than 1m is visually-interpretable and can be used to manually or automatically extract locations of obsta-cles or damaged objects. Satellite acquisitions of very high-resolution imagery need to be scheduled and become avail-able only after a disaster event. In contrast, satellites with medium-resolution sensors of 10m–30m ground resolution monitor the Earth’s surface with weekly image acquisitions for any location globally. Radar sensors are often used to map floods in sparsely built-up areas since smooth water sur-faces reflect electromagnetic waves away from the sensor, whereas buildings reflect them back. As a result, conven-tional remote sensing flood mapping models perform poorly on images of urban or suburban areas.
Related Work
Recent advances in computer vision and the rapid increase of commercially and publicly available medium- and high-resolution satellite imagery have given rise to a new area of research at the interface of machine learning and remote sensing, as summarized by Zhu et al. (2017) and Zhang, Zhang, and Du (2016).
One popular task in this domain is the segmentation of building footprints from satellite imagery, which has led to competitions such as the DeepGlobe (Demir et al. 2018) and SpaceNet challenges (Van Etten, Lindenbaum, and Bacas-tow 2018). Encoder-decoder networks like U-Net and Seg-Net are consistently among the best-performing models at such competitions and considered state-of-the-art for satel-lite imagery-based image segmentation (Bischke et al. 2017; Yang et al. 2018). U-Net-based approaches that replace the original VGG architecture (Simonyan and Zisserman 2014) with, for example, ResNet encoders (He et al. 2016) per-formed best at the 2018 DeepGlobe challenge (Hamaguchi and Hikosaka 2018). Recently developed computer vision models, such as DeepLab-v3 (Chen et al. 2017), PSPNet (Zhao et al. 2017), or DDSC (Bilinski and Prisacariu 2018), however, use improved encoder architectures with a higher receptive field and additional context modules.
Segmentation of damaged buildings is similar to segmen-tation of building footprints. However, the former can be more challenging than the latter due to the existence of addi-tional, confounding features, such as damaged non-building structures, in the image scene. Adding a temporal dimen-sion by using pre- and post-disaster imagery can help im-prove the accuracy of damaged building segmentation. For instance, Cooner, Shao, and Campbell (2016) insert pairs of pre- and post-disaster images into a feedforward neural net-work and a random forest model, allowing them to identify buildings damaged by the 2010 Haiti earthquake. Scarsi et al. (2014), in contrast, apply an unsupervised method based on a Gaussian finite mixture model to pairs of very high-resolution WorldView-2 images and use it to assess the level of damage after the 2013 Colorado flood through change segmentation modeling. If pre- and post-disaster image pairs of the same type are unavailable, it is possible to combine different image types, such as optical and radar imagery. Brunner, Lemoine, and Bruzzone (2010), for example, use a Bayesian inference method to identify collapsed buildings after an earthquake from pre-event very high-resolution op-tical and post-event very high-resolution radar imagery.
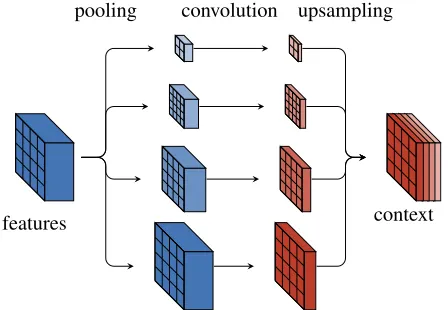
features context pooling convolution upsampling
Figure 2: Multi3Net’s context aggregation module extracts and combines image features at different image resolutions, similarly to Zhao et al. (2017).
al. (2018) use data augmentation to generate a training dataset for deep neural networks, enabling rapid segmenta-tion of building footprints in satellite images acquired after the 2011 Tohoku earthquake and tsunami in Japan.
Method
In this section, we introduce Multi3Net, an approach to seg-menting flooded buildings using multiple types of satellite imagery in a multi-stream convolutional neural network. We first describe the architecture of our segmentation network for processing images from a single satellite sensor. Build-ing on this approach, we propose an extension to the net-work, which allows us to effectively combine information from different types of satellite imagery, including multiple sensors and resolutions across time.
Segmentation Network Architecture
Multi3Net uses an encoder-decoder architecture. In par-ticular, we use a modified version of ResNet (He et al. 2016) with dilated convolutions as feature extractors (Yu, Koltun, and Funkhouser 2017) that allows us to effectively downsample the input image along the spatial dimensions by a factor of only ×8 instead of×32. Motivated by the recent success of multi-scale features (Zhao et al. 2017; Chen et al. 2017), we enrich the feature maps with an ad-ditional context aggregation module as depicted in Figure 2. This addition to the network allows us to incorporate con-textual image information into the encoded image represen-tation. The decoder component of the network uses three blocks of bilinear upsampling functions with a factor of×2, followed by a 3×3 convolution, and a PReLU activation function to learn a mapping from latent space to label space. The network is trained end-to-end using backpropagation.
Multi
3Net Image Fusion
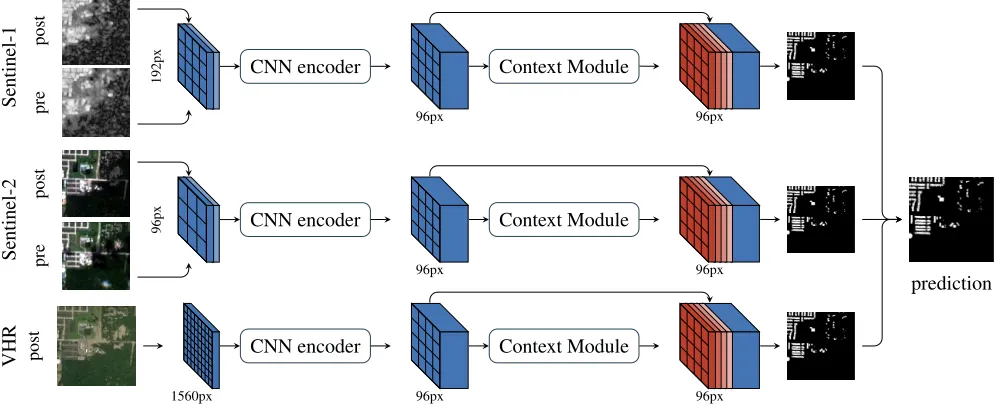
Multi3Net fuses images obtained at multiple points in time from multiple sensors with different resolutions to capture
different properties of the Earth’s surface across time. In this section, we address each fusion type separately.
Multisensor Fusion Images obtained from different
sen-sors can be fused using a variety of approaches. We consider
early as well as late-fusion. In the early-fusion approach,
we upsample each satellite image, concatenate them into a single input tensor, and then process the information within a single network. In the late-fusion approach, each image type is fed into a dedicated information processing stream as shown in the segmentation network architecture depicted in Figure 3. We first extract features separately from each satellite image and then combine the class predictions from each individual stream by first concatenating them and then applying additional convolutions. We compared the perfor-mance of several network architectures, fusing the feature maps in the encoder (as was done in FuseNet (Hazirbas et al. 2016)) and using different late-fusion approaches, such as sum fusion or element-wise multiplication, and found that a late-fusion approach, in which the output of each stream is fused using additional convolutional layers, achieved the best performance. This finding is consistent with related work on computer vision focused on the fusion of RGB op-tical images and depth sensors (Couprie et al. 2013). In this setup, the segmentation maps from the different streams are fused by concatenating the segmentation map tensors and applying two additional layers of 3×3 convolutions with
PReLU activations and a 1×1 convolution. This way, the dimensions along the channels can be reduced until they are equal to the number of class labels.
Multiresolution Fusion In order to best incorporate the
satellite images’ different spatial resolutions, we follow two different approaches. When only Sentinel-1 and Sentinel-2 images are available, we transform the feature maps into a common resolution of 96px×96px at a 10m ground res-olution by removing one upsampling layer in the Sentinel-2 encoder network. Whenever very high-resolution optical imagery is available as well, we also remove the upsampling layer in the very high-resolution subnetwork to match the feature maps of the two Sentinel imagery streams.
Multitemporal Fusion To quantify changes in the scene
shown in a satellite images over time, we use pre- and post-disaster satellite images. We achieved the best results by concatenating both images into a single input tensor and pro-cessing them in the early-fusion network described above. More complex approaches, such as using two-stream works with shared encoder weights similar to Siamese net-works (Melekhov, Kannala, and Rahtu 2016) or subtracting the activations of the feature maps, did not improve model performance.
Network Training
pre
post
Sentinel-1 192px
CNN encoder
96px
Context Module
96px
pre
post
Sentinel-2
96px CNN encoder
96px
Context Module
96px
post
1560px
CNN encoder
96px
Context Module
96px
VHR
prediction
Figure 3: Overview of Multi3Net’s multi-stream architecture. Each satellite image is processed by a separate stream that extracts feature maps using a CNN-encoder and then augments them with contextual features. Features are mapped to the same spatial resolution, and the final prediction is obtained by fusing the predictions of individual streams using additional convolutions.
RGB channels. Multi3Net was trained using theAdam opti-mization algorithm (Kingma and Ba 2014) with a learning rate of10−2. The network parameters are optimized using a cross entropy loss
H(ˆy,y) =−X
i
yilog(ˆyi),
between ground truthy and predictionsyˆ. We anneal the learning rate according to the poly policy (power= 0.9) in-troduced in Chen et al. (2018) and stop training once the loss converges. For each batch, we randomly sample 8 tiles of size 960m×960m (corresponding to 96px×96px optical and 192px×192px radar images) from the dataset. We augment
the training dataset by randomly rotating and flipping the im-age vertically and horizontally in order to create additional samples. To segment flooded buildings with Multi3Net, we first pre-train the network on building footprints. We then use the resulting weights for network initialization and train Multi3Net on the footprints of flooded buildings.
Data
Area of Interest
We chose two neighboring, non-overlapping districts of Houston, Texas as training and test areas. Houston was flooded in the wake of Hurricane Harvey, a category 4 hurri-cane that formed over the Atlantic on August 17, 2017, and made landfall along the coast of the state of Texas on August 25, 2017. The hurricane dissipated on September 2, 2017. In the early hours of August 28, extreme rainfalls caused an ‘uncontrolled overflow’ of Houston’s Addicks Reservoir and flooded the neighborhoods of ‘Bear Creek Village’, ‘Charlestown Colony’, ‘Concord Bridge’, and ‘Twin Lakes’.
Ground Truth
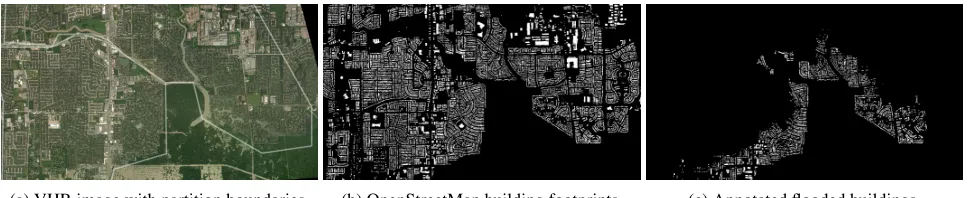
We chose this area of interest because accurate building foot-prints for the affected areas are publicly available through OpenStreetMap. Flooded buildings have been manually la-beled through crowdsourcing as part of the DigitalGlobe Open Data Program (DigitalGlobe 2018). When preprocess-ing the data, we combine the buildpreprocess-ing footprints obtained from OpenStreetMap with point-wise annotations from Dig-italGlobe to produce the ground truth map shown in ure 4c. The geometry collections of buildings (shown in Fig-ure 4b) and flooded buildings (shown in FigFig-ure 4c) are then rasterized to create 2m or 10m pixel grids, depending on the satellite imagery available. Figure 4a shows a very high-resolution image of the area of interest overlaid with bound-aries for the East and West partitions used for training and testing, respectively.
Data Preprocessing
In Section Background: Earth Observation, we described
the properties of short-wavelength optical and long-wavelength radar imagery. For Sentinel-2 optical data, we usetop-of-atmospherereflectances without applying further
atmospheric corrections to minimize the amount of opti-cal preprocessing need for our approach. For radar data, however, preprocessing of the raw data is necessary to ob-tain numerical values that can be used as network inputs. A single radar ‘pixel’ is expressed as a complex numberz
and composed of a real in-phase,Re(z), and an imaginary quadrature component of the reflected electromagnetic sig-nal, Im(z). We usesingle look complexdata to derive the
(a) VHR image with partition boundaries. (b) OpenStreetMap building footprints. (c) Annotated flooded buildings.
Figure 4: Images illustrating (a) the size and extent of the dataset, (b) available rasterized ground truth annotations as Open-StreetMap building footprints, and (c) expert-annotated labels of flooded buildings c).
images are preprocessed according to Ulaby et al. (2014): (1) We performradiometric calibrationto compensate for
the effects of the sensor’s relative orientation to the illumi-nated scene and the distance between them. (2) We reduce the noise induced by electromagnetic interference, known as speckle, by applying a spatial averaging kernel, known
as multi-looking in radar nomenclature. (3) We normalize
the effects of the terrain elevation using a digital elevation model, a process known asterrain correction, where a
co-ordinate is assigned to each pixel through georeferencing.
(4) We average the intensity of all radar images over an ex-tended temporal period, known astemporal multi-looking,
to further reduce the effect of speckle on the image. (5) We calculate theinterferometric coherencebetween images,zt, at timest= 1,2,
γ= E[z1z
∗
2] p
E[|z1|2]E[|z2|2]
, (1)
wherez∗tis the complex conjugate ofztand expectations are computed using a localboxcar-function. The coherence is a
local similarity metric (Zebker and Villasenor 1992) able to measure changes between pairs of radar images.
Network Inputs
We use medium-resolution satellite imagery with a ground resolution of 5m–10m, acquired before and after disaster events, along with very high-resolution post-event images with a ground resolution of 0.5m. Medium-resolution satel-lite imagery is publicly available for any location globally and acquired weekly by the European Space Agency.
For radar data, we construct a three-band image consist-ing of the intensity, multitemporal filtered intensity, and in-terferometric coherence. We compute the intensity of two radar images obtained from Sentinel-1 sensors in stripmap mode with a ground resolution of 5m for August 23 and September 4, 2017. Additionally, we calculate the interfer-ometric coherence for an image pair without flood-related changes acquired on June 6 and August 23, 2017, as well as for an image pair with flood-induced scene changes ac-quired on August 23 and September 4, 2017, using Equa-tion (1). Examples of coherence images generated this way are shown in Figures 1a and 1b. As the third band of the radar input, we compute the multitemporal intensity by aver-aging all Sentinel-1 radar images from 2016 and 2017. This
way, speckle noise affecting the radar image can be reduced. We merge the intensity, multitemporal filtered intensity, and coherence images obtained both pre- and post-disaster into separate three-band images. The multi-band images are then fed into the respective network streams.
Figures 1c and 1d show pre- and post-event images ob-tained from the Sentinel-2 satellite constellation on August 20 and September 4, 2017. Sentinel-2 measures the surface reflectances in 13 spectral bands with 10m, 20m, and 60m ground resolutions. We apply bilinear interpolations to the 20m band images to obtain an image representation with 10m ground resolution. To obtain finer image details, such as building delineations, we use very high-resolution post-event images obtained through the DigitalGlobe Open Data Program (see Figure 1e). The very high-resolution image used in this work was acquired on August 31, 2017, and con-tains three spectral bands (red, green, and blue), each with a 0.5m ground resolution.
Finally, we extract rectangular tiles of size 960m×960m
from the set of satellite images to use as input samples for the network. This tile extraction process is repeated every 100m in the four cardinal directions to produce overlapping tiles for training and testing, respectively. The large tile over-lap can be interpreted as an offline data augmentation step.
Experiments & Results
In this section, we present quantitative and qualitative re-sults for the segmentation of building footprints and flooded buildings. We show that fusion-based approaches consis-tently outperform models that only incorporate data from single sensors.
Evaluation Metrics
We segment building footprints and flooded buildings and compare the results to state-of-the-art benchmarks. To assess model performance, we report theIntersection over Union
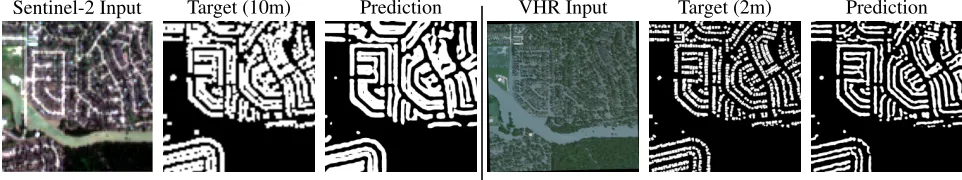
Sentinel-2 Input Target (10m) Prediction VHR Input Target (2m) Prediction
Figure 5: Prediction targets and prediction results for building footprint segmentation using Sentinel-1 and Sentinel-2 inputs fused at a 10m resolution (left panel) and using Sentinel-1, Sentinel-2, and VHR inputs fused at a 2m resolution (right panel).
Positives, FP≡False Positives, TN≡True Negatives, and
FN ≡False Negatives. Conversely, the IoU for the back-ground class, in our case denoting ‘not a flooded building’, is given by TN/(TN+FP+FN). Additionally, we report the mean of (flooded) building and background IoU val-ues, abbreviated as ‘mIoU’. We also compute the pixel ac-curacy A, the percentage of correctly classified pixels, as A≡(TP+TN)/(TP+FP+TN+FN).
Building Footprint Segmentation: Single Sensors
We tested our model on the auxiliary task of building foot-print segmentation. The wide applicability of this task has led to the creation of several benchmark datasets, such as the DeepGlobe (Demir et al. 2018), SpaceNet (Van Etten, Lindenbaum, and Bacastow 2018), and INRIA aerial labels datasets (Maggiori et al. 2017a), all containing very high-resolution RGB satellite imagery. Table 1 shows the perfor-mance of our model on the Austin partition of the INRIA aerial labels dataset. Maggiori et al. (2017b) use a fully con-volutional network (Long, Shelhamer, and Darrell 2015) to extract features that were concatenated and classified by a second multilayer perceptron stream. Ohleyer (2018) em-ploy a Mask-RCNN (He et al. 2017) instance segmentation network for building footprint segmentation.Using only very high-resolution imagery, Multi3Net per-formed better than current state-of-the-art models, reaching a bIoU 7.8% higher than Ohleyer (2018). Comparing the performance of our model for different single-sensor inputs, we found that predictions based on very high-resolution im-ages achieved the highest building IoU score, followed by predictions based on Sentinel-2 medium-resolution optical images, suggesting that optical bands contain more relevant information for this prediction task than radar images.
Building Footprint Segmentation: Image Fusion
Fusing multiresolution and multisensor satellite imagery further improved the predictive performance. The results presented in Table 2 show that the highest accuracy was achieved when all data sources were fused. We also com-pared the performance of Multi3Net to the performance of a baseline U-Net data fusion architecture, which has beenModel bIoU Accuracy
Maggiori et al. (2017b) 61.2% 94.2%
Ohleyer (2018) 65.6% 94.1%
Multi3Net 73.4% 95.7%
Table 1: Building footprint segmentation results based on VHR images of the Austin partition of the INRIA aerial la-bels dataset (Maggiori et al. 2017a).
successful at recent satellite imagery segmentation compe-titions, and found that Multi3Net outperformed the U-Net baseline on building footprint segmentation for all input types (seeAppendixfor details).
Figure 5 shows qualitative building footprint segmenta-tion results when fusing images from multiple sensors. Fus-ing Sentinel-1 and Sentinel-2 data produced highly accurate predictions (76.1% mIoU), only surpassed by predictions obtained by fusing Sentinel-1, Sentinel-2, and very high-resolution imagery (79.9%).
Data mIoU bIoU Accuracy
S-1 69.3% 63.7% 82.6%
S-2 73.1% 66.7% 85.4%
VHR 78.9% 74.3% 88.8%
S-1 + S-2 76.1% 70.5% 87.3%
S-1 + S-2 + VHR 79.9% 75.2% 89.5%
Table 2: Results for the segmentation of building footprints using different input data in Multi3Net.
Segmentation of Flooded Buildings with Multi
3Net
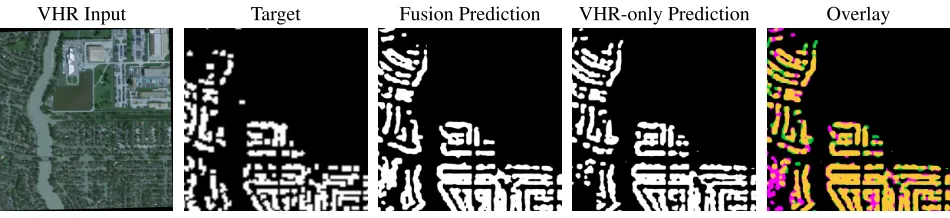
medium-VHR Input Target Fusion Prediction VHR-only Prediction Overlay
Figure 6: Comparison of predictions for the segmentation of flooded buildings for fusion-based and VHR-only models. In the overlay image, predictions added by the fusion are marked in magenta, predictions that were removed by the fusion are marked in green, and predictions present in both are marked in yellow.
and very high-resolution imagery, fusing globally available medium-resolution images from Sentinel-1 and Sentinel-2 also performed well, reaching a mean IoU score of 59.7%. These results highlight one of the defining features of our method: A segmentation map can be produced as soon as at least a single satellite acquisition has been successful and subsequently be improved upon once additional imagery be-comes available, making our method flexible and useful in practice (see Table 2). We also compared Multi3Net to a U-Net fusion model and found that Multi3Net performed significantly better, reaching a building IoU score of 75.3% compared to a bIoU score of only 44.2% for the U-Net base-line.
Figure 6 shows predictions for the segmentation of flooded buildings obtained from the very high-resolution-only and full-fusion models. The overlay image shows the differences between the two predictions. Fusing images from multiple resolutions and multiple sensors across time eliminates the majority of false positives and helps delin-eate the shape of detected structures more accurately. The flooded buildings in the bottom left corner, highlighted in magenta, for example, were only detected using multisensor input.
Data mIoU bIoU Accuracy
S-1 50.2% 17.1% 80.6%
S-2 52.6% 12.7% 81.2%
VHR 74.2% 56.0% 93.1%
S-1 + S-2 59.7% 34.1% 86.4%
S-1 + S-2 + VHR 75.3% 57.5% 93.7%
Table 3: Results for the segmentation of flooded buildings using different input data in Multi3Net.
Conclusion
In disaster response, fast information extraction is crucial for first responders to coordinate disaster relief efforts, and satellite imagery can be a valuable asset for rapid mapping of affected areas. In this work, we introduced a novel end-to-end trainable convolutional neural network architecture for fusion of multiresolution, multisensor optical and radar
satellite images that outperforms state-of-the-art models for segmentation of building footprints and flooded buildings.
We used state-of-the-art pyramid sampling pooling (Zhao et al. 2017) to aggregate spatial context and found that this architecture outperformed fully convolutional net-works (Maggiori et al. 2017b) and Mask-RCNNs (Ohleyer 2018) on building footprint segmentation from very high-resolution images. We showed that building footprint pre-dictions obtained by only using publicly-available medium-resolution radar and optical satellite images in Multi3Net al-most performs on par with building footprint segmentation models that use very high-resolution satellite imagery (Bis-chke et al. 2017).
Building on this result, we used Multi3Net to segment flooded buildings, fusing multiresolution, multisensor, and multitemporal satellite imagery, and showed that full-fusion outperformed alternative fusion approaches. This result demonstrates the utility of data fusion for image segmen-tation and showcases the effectiveness of Multi3Net’s fu-sion architecture. Additionally, we demonstrated that using publicly available medium-resolution Sentinel imagery in Multi3Net produces highly accurate flood maps.
Our method is applicable to different types of flood events, easy to deploy, and substantially reduces the amount of time needed to produce highly-accurate flood maps. We also release the first open-source dataset of fully prepro-cessed and labeled multiresolution, multispectral, and mul-titemporal satellite images of disaster sites along with our source code, which we hope will encourage future research into image fusion for disaster relief.
Acknowledgements
This research was conducted at the Frontier Development Lab (FDL), Europe. The authors gratefully acknowledge support from the European Space Agency, NVIDIA Corpo-ration, Satellite Applications Catapult, and Kellogg College, University of Oxford.
References
im-agery using deep neural networks. IEEE Geoscience and Remote Sensing Letters15:43–47.
Bilinski, P., and Prisacariu, V. 2018. Dense decoder short-cut connections for single-pass semantic segmentation. In
CVPR.
Bischke, B.; Helber, P.; Folz, J.; Borth, D.; and Dengel, A. 2017. Multi-task learning for segmentation of building foot-prints with deep neural networks. CoRRabs/1709.05932.
Brunner, D.; Lemoine, G.; and Bruzzone, L. 2010. Earth-quake damage assessment of buildings using vhr optical and sar imagery.IEEE Transactions on Geoscience and Remote Sensing48:2403–2420.
Chen, L.-C.; Papandreou, G.; Schroff, F.; and Adam, H. 2017. Rethinking atrous convolution for semantic image segmentation. CVPR.
Chen, L.-C.; Papandreou, G.; Kokkinos, I.; Murphy, K.; and Yuille, A. L. 2018. Deeplab: Semantic image segmentation with deep convolutional nets, atrous convolution, and fully connected crfs. IEEE transactions on pattern analysis and machine intelligence40(4):834–848.
Cooner, A. J.; Shao, Y.; and Campbell, J. B. 2016. Detection of urban damage using remote sensing and machine learning algorithms: Revisiting the 2010 haiti earthquake. Remote Sensing8:868.
Couprie, C.; Farabet, C.; Najman, L.; and LeCun, Y. 2013. Indoor semantic segmentation using depth information.
CVPR.
Demir, I.; Koperski, K.; Lindenbaum, D.; Pang, G.; Huang, J.; Basu, S.; Hughes, F.; Tuia, D.; and Raskar, R. 2018. Deepglobe 2018: A challenge to parse the earth through satellite images. InCVPR.
Deng, J.; Dong, W.; Socher, R.; Li, L.-J.; Li, K.; and Fei-Fei, L. 2009. ImageNet: A Large-Scale Hierarchical Image Database. InCVPR.
DigitalGlobe. 2018. DigitalGlobe Open Data Program. On-line; accessed 2018-09-01.
Hamaguchi, R., and Hikosaka, S. 2018. Building detec-tion from satellite imagery using ensemble of size-specific detectors. InCVPR Workshop.
Hazirbas, C.; Ma, L.; Domokos, C.; and Cremers, D. 2016. Fusenet: Incorporating depth into semantic segmentation via fusion-based cnn architecture. InACCV.
He, K.; Zhang, X.; Ren, S.; and Sun, J. 2016. Deep residual learning for image recognition. InCVPR.
He, K.; Gkioxari, G.; Doll´ar, P.; and Girshick, R. 2017.
Mask R-CNN. InICCV.
Kingma, D. P., and Ba, J. 2014. Adam: A method for stochastic optimization.arXiv preprint arXiv:1412.6980.
Long, J.; Shelhamer, E.; and Darrell, T. 2015. Fully convo-lutional networks for semantic segmentation. InCVPR.
Maggiori, E.; Tarabalka, Y.; Charpiat, G.; and Alliez, P. 2017a. Can semantic labeling methods generalize to any city? the inria aerial image labeling benchmark. InIGARSS.
IEEE.
Maggiori, E.; Tarabalka, Y.; Charpiat, G.; and Alliez, P.
2017b. Convolutional neural networks for large-scale
remote-sensing image classification. IEEE Transactions on Geoscience and Remote Sensing55(2):645–657.
Melekhov, I.; Kannala, J.; and Rahtu, E. 2016. Siamese network features for image matching. InICPR.
Ohleyer, S. 2018. Building segmentation on satellite images. Online; accessed 2018-09-01.
Scarsi, A.; Emery, W. J.; Serpico, S. B.; and Pacifici, F. 2014. An automated flood detection framework for very high spa-tial resolution imagery.IEEE Geoscience and Remote Sens-ing Symposium4954–4957.
Simonyan, K., and Zisserman, A. 2014. Very deep convolu-tional networks for large-scale image recognition.CVPR.
Soergel, U. 2010. Radar Remote Sensing of Urban Areas,
volume 15. Springer.
Ulaby, F. T.; Long, D. G.; Blackwell, W. J.; Elachi, C.; Fung, A. K.; Ruf, C.; Sarabandi, K.; Zebker, H. A.; and Van Zyl, J. 2014. Microwave radar and radiometric remote sensing,
volume 4. University of Michigan Press Ann Arbor. Van Etten, A.; Lindenbaum, D.; and Bacastow, T. M. 2018. Spacenet: A remote sensing dataset and challenge series.
CVPR.
Yang, H. L.; Yuan, J.; Lunga, D.; Laverdiere, M.; Rose, A.; and Bhaduri, B. 2018. Building extraction at scale using convolutional neural network: Mapping of the united states.
Journal of Selected Topics in Applied Earth Observations and Remote Sensing11(8):2600–2614.
Yu, F.; Koltun, V.; and Funkhouser, T. A. 2017. Dilated residual networks. InCVPR.
Zebker, H. A., and Villasenor, J. D. 1992. Decorrelation in interferometric radar echoes. IEEE Trans. Geoscience and Remote Sensing30:950–959.
Zhang, L.; Zhang, L.; and Du, B. 2016. Deep learning for remote sensing data: A technical tutorial on the state of the art. IEEE Geoscience and Remote Sensing Magazine4:22–
40.
Zhao, H.; Shi, J.; Qi, X.; Wang, X.; and Jia, J. 2017. Pyramid scene parsing network. InCVPR.