A Study of Educational Data Mining: Evidence from a Thai University
Ruangsak Trakunphutthirak, Yen Cheung, Vincent C. S. Lee, SMIEEE
Faculty of IT, Clayton Campus, Monash University Melbourne, Australia
{ruangsak.trakunphutthirak, yen.cheung, vincent.cs.lee} @monash.edu
Abstract
Educational data mining provides a way to predict student academic performance. A psychometric factor like time management is one of the major issues affecting Thai stu-dents’ academic performance. Current data sources used to predict students’ performance are limited to the manual col-lection of data or data from a single unit of study which cannot be generalised to indicate overall academic perfor-mance. This study uses an additional data source from a university log file to predict academic performance. It in-vestigates the browsing categories and the Internet access activities of students with respect to their time management during their studies. A single source of data is insufficient to identify those students who are at-risk of failing in their ac-ademic studies. Furthermore, there is a paucity of recent empirical studies in this area to provide insights into the re-lationship between students’ academic performance and their Internet access activities. To contribute to this area of research, we employed two datasets such as web-browsing categories and Internet access activity types to select the best outcomes, and compared different weights in the time and frequency domains. We found that the random forest technique provides the best outcome in these datasets to identify those students who are at-risk of failure. We also found that data from their Internet access activities reveals more accurate outcomes than data from browsing categories alone. The combination of two datasets reveals a better pic-ture of students’ Internet usage and thus identifies students who are academically at-risk of failure. Further work in-volves collecting more Internet access log file data, analysing it over a longer period and relating the period of data collection with events during the academic year.
Introduction
Students’ academic performance in assessments is a meas-ure of their academic success and this is one of the KPIs of the educational quality assurance in Thai universities (Maneerat, Malaivongs, and Khlaisang 2015). This meas-urement of student success, influenced by many factors, can be done in several ways. Shahiri, Husain, and Rashid
Copyright © 2019, Association for the Advancement of Artificial Intelli-gence (www.aaai.org). All rights reserved.
(Shahiri, Husain, and Rashid 2015) reviewed important factors on predicting student academic performance by using data mining techniques. Amongst those psychomet-ric factors such as students’ interest, study behavior, or time management, problems with time management was identified as one of the major issues affecting Thai stu-dents’ academic performance (Sittichai 2012).
To discover the factors related to students at-risk of fail-ure, educational data mining can be used to predict stu-dents’ academic performance (Zhou et al. 2018; He et al. 2015). Those students at-risk of failure can potentially be identified by using factors inherent in internal university data sources (Amornsinlaphachai 2016; Vuttipittaya-mongkol 2016; Arsad, Buniyamin, and Manan 2012; Senthil and Lin 2017). Usually, the main data sources are from administering questionnaires and student data collect-ed from learning management systems (LMS). Data col-lected from questionnaires and transactional data from Learning Management System (LMS), such as ATutor, Blackboard and Moodle can be used to analyse students’ behavior and subsequently predict their academic perfor-mance (Conijn et al. 2017). Nevertheless, both of the two data sources have limitations. One major drawback of us-ing questionnaires is that the active participation of stu-dents has been required. This incurs extra costs to manual-ly collect the data. Although LMSs overcome these prob-lems, its data is normally limited to a single unit of study and overall academic performance cannot be generalised from LMS data across all units of study (Zhou et al. 2018). Hence, using data such as internet access log files offers a promising alternative to explore the prediction of academic performance of students.
Firewalls automatically keep an internet access log file in a systematic way (Trakunphutthirak, Cheung, and Lee 2017). The log file is used to create a data model as a schema on read (Dong and Srivastava 2013). With the schema on read, any schema can be created to handle a variety of queries. This log file contains useful information in a semi-structured format and we can answer different queries provided by the schema. To monitor the time
agement of students, we can track their internet access ac-tivities that are captured in a log file.
Applying machine learning techniques to log files pro-vides an efficient and automatic way to discover patterns or new knowledge from these large-scale data. For in-stance, machine learning techniques can learn and discover new knowledge or patterns from existing data by clustering similar groups of objects, classifying the data or predicting students’ performance such as their GPA (Senthil and Lin 2017). Machine learning techniques can also be applied to log files for identifying students’ browsing behavior (Na and Tasir 2017).
Hence, the aims of this paper are twofold: first we study students’ behavior (such as average time spent on websites, the frequency of using online academic applications and the type of their Internet access activities) when accessing the internet, and second, we analyse two datasets (brows-ing categories and Internet access activities) for classify(brows-ing students who are at-risk of failure.
Internet access activities can be defined as browsing categories based on applications such as Facebook, Gmail, twitter, or WeChat. Other types of browsing categories include synchronizing cloud storage, communicating ser-vices via mobile apps, and texting serser-vices on social me-dia.
By predicting students who are at risk of failure from internet access log files, we purpose to produce enhanced academic achievement predictions in overall academic performance across all units instead of a particular unit of study from data in LMS. The key problem with existing research is that students’ academic performance in assess-ments is measured by manually creating websites’ catego-ries. This study, on the contrary, uses websites’ categories automatically created by a university’s firewall.
The remaining part of this paper is organised as follows. Section 2 reviews some related work. Section 3 describes the methodology. Section 4 reports results and discussion on using private internet access log files. Finally, Section 5 presents our conclusion and directions of further work.
Some Related Work
Factors Affecting Student Performance
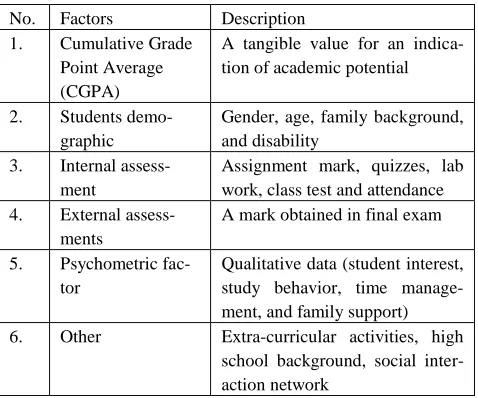
Shahiri, Husain, and Rashid (Shahiri, Husain, and Rashid 2015) conducted a comprehensive review on the existing research to find important factors used in predicting stu-dent’s performance in Malaysia. Those attributes were cat-egorized as shown in Table 1.
These factors are also supported by a Thai study by Yathongchai et al. (Yathongchai et al. 2012) where the author analyzed factors affecting students’ dropout rate. They used classification techniques, J48, and Naïve Bayes
algorithms, on a dataset at Buriram Rajabhat University (BRU) in Thailand between 2008 and 2009. Students’ GPAs in their first two academic years and cumulative GPA (Quantitative factors) from high school were the ma-jor factors for prediction. However, using qualitative fac-tors can further improve a student’s performance predic-tion.
No. Factors Description
1. Cumulative Grade Point Average (CGPA)
A tangible value for an indica-tion of academic potential
2. Students demo-graphic
Gender, age, family background, and disability
3. Internal assess-ment
Assignment mark, quizzes, lab work, class test and attendance 4. External
assess-ments
A mark obtained in final exam
5. Psychometric fac-tor
Qualitative data (student interest, study behavior, time manage-ment, and family support)
6. Other Extra-curricular activities, high
school background, social inter-action network
Table 1: Student performance factors
Sittichai (Sittichai 2012) investigated the implications and reflected on the dropout rate amongst university stu-dents in the Southern Thailand. He interviewed a sample of students who had discontinued their studies at Prince of Songkla University (PSU) which is located in Southern Thailand. He found that time management was one of the important psychometric factors affecting students’ perfor-mance.
Similarly, time management also affected students’ per-formance in a study by Seidel and Kutieleh (Seidel and Kutieleh 2017). The authors used an SEM model to test their hypotheses and found that time management skills of Hispanic students were also one of the strongest indicators of their GPA. Hence, time management is seen to be a sig-nificant predictor of students’ performance.
Students’ Academic Performance Prediction
In addition to the result of academic assessments, academic performance could also be influenced by several factors such as age, culture, or former schools (Araque, Roldán, and Salguero 2009). A student’s average mark or a grade was found to be the most obvious indicator of an individu-al’s academic performance (Shahiri, Husain, and Rashid 2015).in-stance, Ting and Man (Ting and Man 2001) used psycho-social variables (such as demonstrated community service, leadership experiences, or self-appraisal system) and standardized test scores (such as an aptitude test) from freshman engineering students to predict the academic per-formance. Similarly, using perceived academic control and academic emotions, Respondek et al. (Respondek et al. 2017) used a structural equation model (SEM) of a cross-sectional questionnaire to predict first-year students’ aca-demic performance. Previous research has established that using questionnaires provides admirable prediction results, however, it incurs extra human manual interventions for gathering data.
Several attempts have been made to find out a conver-gence between data mining and improving students’ demic performance. The mining process of improving aca-demic performance refers to the domain of learning analyt-ics (Saqr, Fors, and Tedre 2017). Learning analytanalyt-ics ena-bles early predictions of at-risk students. For example, Na and Tasir (Na and Tasir 2017) have detected at-risk stu-dents from learning behavior while using a learning man-agement system (LMS). Likewise, Saqr, Fors, and Tedre (Saqr, Fors, and Tedre 2017) predicted at-risk students in a blended medical education unit by using data in LMS. They detected students who scored under 5% of the pass-ing mark. Several lines of evidence suggest that LMS data can be used to predict student academic performance. Nev-ertheless, one major drawback of LMS’s data is that it can be used to predict students’ academic performance in only a particular unit of study, not across all units of study (Zhou et al. 2018). Using additional data sources increases the potential to better predict students’ performance (Conijn et al. 2017). Thus, to in turn influence general aca-demic performance, additional data sources are required to collect data in a systematic way and to shed more infor-mation on students’ Internet access activities.
Machine Data: Internet Access Log Files
Referential data, transactional data, and machine data are three main categories of data classification (Dong and Sri-vastava 2013; Fedorov et al. 2017). Referential data, also known as a key-value schema, are considered to be refer-enced by other applications like transactional data and ma-chine data. Atomicity, consistency, isolation, and durability (ACID) are four key properties of transactional data. The schema or data model of transactional data has to be de-signed before storing the data. This data model is called a schema on write (Dong and Srivastava 2013). We can an-swer a same query with a well-defined schema. However, a fixed data model cannot be used to answer a different ques-tion from a different schema. Machine data is recorded in its original format, like in log files (Fedorov et al. 2017). This log file can be used to create a data model such as a
schema on read. With the schema on read, data is stored in the original format and can be created user-defined sche-mas. We can answer different questions while accessing machine data.
Basic statistical analysis can be performed to discover more information from log files. The key problem with this analysis is that the knowledge extracted from this kind of analysis is very limited (Trakunphutthirak, Cheung, and Lee 2017). Many recent studies (Amornsinlaphachai 2016; Senthil and Lin 2017; Zhou et al. 2018) have shown that machine learning techniques are mostly able to extract more knowledge from that data. For example, we can mine the log file data to better understand and classify patterns in internet access activities.
Machine Learning Techniques
Extensive research has shown that various machine learn-ing techniques have been used to predict students who are at-risk of failure. For instance, Zhou et al. (Zhou et al. 2018) used various machine learning techniques (such as Naive Bayes, Logistic regression and Decision tree) to predict students who are at-risk of failure in computer sci-ence units at a Chinese university. From their study, Naive Bayes algorithm has revealed the best predicting accuracy of students’ academic performance. This algorithm works on Bayes theorem to calculate conditional probabilities with strong assumptions between the independent variables (such as website categories). The study also investigated predicting accuracies on the decision tree algorithm and a logistic regression analysis (Zhou et al. 2018). Logistic regression analysis offers an addition of a general linear model to predict the binary dependent variable (such as a status of high-risk students who failed more than two units). Their data sources were gathered from the registrar information system and web traffic log files. However, this data source was limited to only the categories of web browsing.
Previous research has established that Artificial Neural Network algorithm can be used to predict students’ aca-demic performance. For instance, Arsad, Buniyamin, and Manan (Arsad, Buniyamin, and Manan 2012) applied an Artificial Neural Network technique in predicting students’ academic performance of electrical engineering students at a Malaysian university. Their study applied backpropaga-tion neural networks with a multilayer perceptron to pre-dict the final cumulative grade point of fundamentals units. Artificial Neural Network technique learnt to model the dependencies among the input and output layer. Their da-taset was captured from an enrolment system of seven units.
However, compared with the above-mentioned tech-niques, several lines of evidence suggest that the random forest technique was the best algorithm in terms of accura-cy, precision, sensitivity and specificity (Senthil and Lin 2017).
Senthil and Lin (Senthil and Lin 2017) have used a da-taset from UCI machine learning repository in predicting students’ academic performance. The dataset included 33 attributes (such as age, school, travel time and failures) of 649 students (the value of a class attribute is fail or pass). The random forest technique has the ability to automatic handle sparse attributes or those attributes that contain mostly missing values. This technique creates the forest with multiple decision trees and considers the high votes of predicted outcomes as a final prediction model. However, this dataset (Senthil and Lin 2017) did not include internet access activities and browsing categories.
Considering all of this evidence in predicting students’ academic performance (with Naive Bayes, Logistic Regression, Decision tree, Neural network, and Random forest), it seems that these five machine learning tech-niques were the most popular techtech-niques in educational data mining. With the capacity of huge amounts of data generated every second and the processing performance of cluster machines, machine learning techniques play an im-portant role for generating classification rules from large-scale data like the private internet access log files from a university. In this study, these five machine learning tech-niques have been applied to the internet access log file of a university in Thailand.
Methodology
Log Files Dataset
According to a higher degree institute in Thailand, four educational services (generating personal development through the learning process, creating research and innova-tion, studying and fostering arts and culture, and providing academic services) are served by the Thai university used
in this study. Academic services are provided to 20,000 students each year and all students have a university ac-count to access the internet. The university’s firewall rec-orded all internet access activities in log files which were approximately 70 Gb/day. This log file is used in this study as a secondary data source.
The university’s log file was gathered by recording all internet access activities of students. Each entry contains 54 attributes such as id, access date and time, IP addresses, application name, category, and a period of time elapses. The university’s log file was recorded in comma-separated values (CSV) format. 155-million records were generated per day. The log file was exported to a universi-ty’s Google drive. This file contained 360,000 records per day of the start and the end of each internet access session. At login, students were informed about log data collection policy that information may be used for university purpos-es. The permission to use the dataset has been approved by the research ethics committee of the university. Due to privacy and security concerns, students’ identification was also encrypted and de-identified in the dataset used for this study.
Pre-processing
The university log file included 24 categories of web browsing types such as games, music, online-storage-and-backup, search-engines, social-networking, streaming-media and web-based-email.
This log file also included 147 application types of in-ternet access activities such as apple-appstore, Facebook-base, Google-Facebook-base, http-video, ms-update, naver-line, twitter-base, and youtube-base. These categories and appli-cation types can be identified as eduappli-cational, non-educational and possible non-educational.
To classify students’ academic performance, Macfadyen’s and Dawson’s (Macfadyen and Dawson 2010) approach showed that having the binary class at-risk and safe makes for a much more logical argument. In this study, they applied their approach to determine students who are academically risk of failing. The students at-risk of failure is defined as a student who has a GPA less than 60% of an overall score or 2.4. The status of students at-risk of failure is a class variable of this experiment. The university log file contains not only web browsing categories (denoted as CAT) but it also includes all internet access application types (denoted as APP) of the internet access activities. All attributes of this log file includes 24 category attributes and 147 application attributes. To en-hance these two different datasets, the two datasets have been generated and transformed in this study.
CAT3, CAT4, …, CATn with a status of the student who is at-risk of failure as a class variable appended to it. Dataset-2 contains more information about the internet access applications. Each record is composed by APP1, APP2, APP3, APP4,..., APPn and also a status of the stu-dent who is at-risk of failure as a class variable appended to it.
Some attributes of the two datasets contain sparse attrib-utes or mostly zero values. In attribute selection, we ranked the correlation between 24 attributes of web browsing cat-egories and the at-risk status and also ranked the correla-tion between 147 attributes of internet access applicacorrela-tions and the at-risk status.
First, this study used 24 category attributes and 147 ap-plication attributes to compare the accuracy by using time (duration) and frequency. Next, we selected the top 24 at-tributes from each dataset, which had a high correlation with academic performance. The study also compared the accuracy with different weights of the two datasets. This study conducted an experiment to investigate nine combi-nations on different weights of the two datasets including 90%-10%, 80%-20%, 70%-30%, 60%-40%, 50%-50%, 40%-60%, 30%-70%, 20%-80%, and 10%-90%.
Selecting Prediction Model
This study divided the experiment of creating a prediction model into three steps (Figure 1).
Figure 1: Creating prediction model steps
Step 1: the study tested five machine learning techniques informed by the literature review (Amornsinlaphachai
2016; Zhou et al. 2018; Arsad, Buniyamin, and Manan 2012; Senthil and Lin 2017) for both two datasets. The machine learning techniques were Decision Tree (J48), Logistic Regression, Naive Bayes, Neural Network, and Random Forest. This study selected the best technique by considering an overall accuracy. The accuracy of its pre-diction is defined by the accuracy rate, precision rate and F-measure. The F-measure is selected to evaluate the clas-sification performance, particularly an imbalance data. It corresponds to the computing values of a precision and a recall. Precision can be calculated as the number of correct positive predictions divided by the number of all positive predictions. Recall can be calculated as the number of cor-rect positive predictions divided by the number of all sam-ples.
Step 2: we explored the combination of different weights of the datasets in a time analysis and a frequency analysis. The importance of category attributes and application at-tributes were ranked in a descending order by using Pear-son’s correlation. The different weights were selected by the measurement of the correlation value between each attribute and the class variable.
Step 3: the best algorithm from the Step 1 was used to compare nine different weights of two datasets (APP and CAT) from the Step 2.
Result and Discussion
This experiment was conducted on a particular cohort with a limited number of students. A log file was collected throughout the first week of a semester, from students at the faculty of science. This log file included the internet access activities of 294 students. All students of this facul-ty live off-campus.
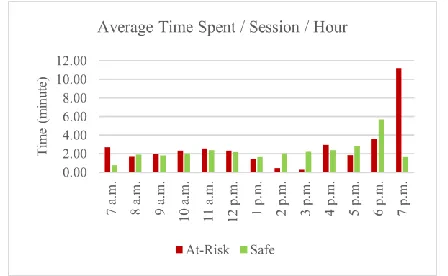
Students can multitask when using the Internet. Overall, students at-risk of failure spent more time on internet activ-ities than safe students especially outside the learning peri-od, as shown in Figure 2. During the first-week periperi-od, safe students spent 2.28 minutes/session/hour on accessing the internet whereas at-risk students spent 2.72 minutes/session/hour on this activity.
On the report of communication applications, at-risk students spent 3.71 minutes/session on online communica-tion applicacommunica-tions whereas safe students spent 3.86 minutes/session on these applications. Some activities cannot directly be classified as educational or non-educational activities. For example, safe students and at-risk students spent 3.45 minutes/session and 3.63 minutes/session on social media respectively. Students may use this social media activity with an educational or a non-educational focus. However, some activities may be defined as non-educational activities. For instance, safe students spent approximately 6.48 minutes/session playing online games whereas at-risk students spent around 1.86 minutes/session. This advocated that using typical time spent on some internet activities alone cannot fully predict academic performance. Discovering more details, such as when and where they used the internet, can reveal a better prediction of an academic performance.
We transformed the log file into two datasets in a pre-processing stage. These datasets contained web browsing categories and internet access activities. The class variable of these datasets was an at-risk status attribute. The status of a student, who is at-risk of failure, was determined by the threshold from literature (i.e. GPA < 60%). The struc-ture of these two data sets are explained as follows:
• APP1, APP2, APP3, APP4, …, APPn, status • CAT1, CAT2, CAT3, CAT4, …, CATn, status The value of each attribute is accumulated as internet access duration and internet access frequency.
The CAT dataset included 24 attributes of web browsing categories and the APP dataset included 147 attributes of internet access activities. Each dataset included records of 294 students from the Faculty of Science.
Machine Learning Techniques Selection
This study investigated five machine learning techniques based on an overall accuracy (See Table 2). The decision tree technique showed the best accuracy in the analysis of internet access duration of CAT dataset. The random forest technique, however, revealed the highest average accuracy across all datasets.
Datasets Naive
Bayes
Logistic
Regression Neural
Network
Decision
tree
Random
Forest
AP-Duration 0.469 0.643 0.731 0.731 0.779
APP-Frequency 0.415 0.653 0.728 0.701 0.779
CAT- Duration 0.534 0.752 0.759 0.782 0.779
CAT-Frequency 0.670 0.745 0.748 0.769 0.776
Average Accuracy 0.522 0.698 0.742 0.746 0.778
Table 2: Average accuracy of machine learning algorithms
A Comparison of the Internet Access Duration
Analysis and the Frequency Analysis
This study selected the random forest technique and meas-ured its accuracy between the APP and CAT datasets in Table 3. In the Internet access activities dataset (APP da-taset), a duration analysis revealed a better prediction accu-racy than a frequency analysis. Accumulate by time in the both datasets revealed the best accuracy. Using APP da-taset with random forest algorithm revealed a better accu-racy than using data from browsing categories (CAT da-taset). Internet access activities cover more attributes than using web browser activities alone. Hence, these attributes can be used to better detect students who are at-risk of aca-demic failure.
Dataset Accuracy Precision Recall F-Measure
APP-Duration 0.779 0.611 0.779 0.685
APP-Frequency 0.779 0.611 0.779 0.685
CAT-Duration 0.779 0.611 0.779 0.685
CAT-Frequency 0.776 0.611 0.776 0.683
Table 3: A comparison of the accuracy of two datasets using random forest technique
Attributes Selection
Selecting attributes from these two datasets, we ranked the value of each attribute by measuring the Pearson’s correla-tion between each attribute and the class variable (an at-risk status) in Table 4.
APP Correlation CAT Correlation
disqus 0.1360 search-engines 0.0820
google-cloud-storage-download 0.1117
web-hosting
0.0703
ms-ds-smb-base 0.1107 any 0.0661
adobe-cloud 0.1107 shopping 0.0660
mediafire 0.1107 social-networking 0.0645
zendesk-base 0.1107 streaming-media 0.0591
ms-ds-smbv1 0.1107 translation 0.0550
symantec-av-update 0.1107
content-delivery-networks 0.0505
rtcp
0.1107
proxy-avoidance-and-anonymizers 0.0455
weiyun-base 0.1107 web-based-email 0.0433
Table 4: The partial ranking correlation of an application dataset and a category dataset
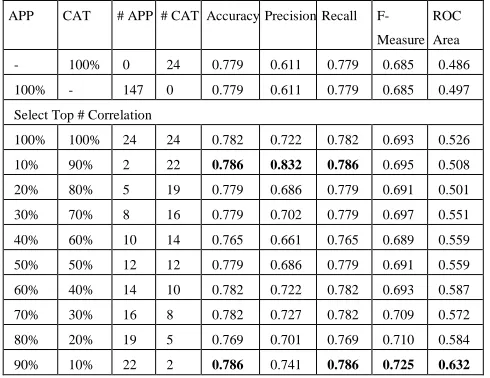
A Combination of Two Datasets
APP CAT # APP # CAT Accuracy Precision Recall F-Measure
ROC Area
- 100% 0 24 0.779 0.611 0.779 0.685 0.486
100% - 147 0 0.779 0.611 0.779 0.685 0.497
Select Top # Correlation
100% 100% 24 24 0.782 0.722 0.782 0.693 0.526
10% 90% 2 22 0.786 0.832 0.786 0.695 0.508
20% 80% 5 19 0.779 0.686 0.779 0.691 0.501
30% 70% 8 16 0.779 0.702 0.779 0.697 0.551
40% 60% 10 14 0.765 0.661 0.765 0.689 0.559
50% 50% 12 12 0.779 0.686 0.779 0.691 0.559
60% 40% 14 10 0.782 0.722 0.782 0.693 0.587
70% 30% 16 8 0.782 0.727 0.782 0.709 0.572
80% 20% 19 5 0.769 0.701 0.769 0.710 0.584
90% 10% 22 2 0.786 0.741 0.786 0.725 0.632
Table 5: Accuracy on a duration analysis
APP CAT # APP #
CAT
Accuracy Precision Recall F-Measure
ROC Area
- 100% 0 24 0.776 0.611 0.776 0.683 0.416
100% - 147 0 0.779 0.611 0.779 0.685 0.450
Select Top # Correlation
100% 100% 24 24 0.772 0.610 0.772 0.682 0.475
10% 90% 2 22 0.769 0.610 0.769 0.680 0.426
20% 80% 5 19 0.769 0.610 0.769 0.680 0.437
30% 70% 8 16 0.772 0.610 0.772 0.682 0.485
40% 60% 10 14 0.765 0.609 0.765 0.678 0.474
50% 50% 12 12 0.769 0.610 0.769 0.680 0.456
60% 40% 14 10 0.769 0.667 0.769 0.691 0.514
70% 30% 16 8 0.765 0.609 0.765 0.678 0.518
80% 20% 19 5 0.759 0.672 0.759 0.695 0.485
90% 10% 22 2 0.772 0.707 0.772 0.712 0.514
Table 6: Accuracy on a frequency analysis
This paper compared the student’s performance predic-tion in two different aspects, access durapredic-tion and access frequency. On average, the analysis of internet access dura-tion reveals a better accuracy than frequency analysis. It means that if we know how long students spend on the activities, this can provide a better accuracy. Also, when we combined the data of how long and how often students were using the Internet, it revealed a better sensitivity and specificity of predicting imbalanced data as shown in Ta-bles 5 and 6.
In the duration aspect, the combination of different weights of the two datasets has revealed a better measure in terms of all accuracies. The different weights of APP-CAT (90%-10%) could increase a better measure in terms of sensitivity and specificity, or Receiver Operating Char-acteristics (ROC) area. In the frequency aspect, the
differ-ent weights of APP-CAT (90%-10%) could be increased for a better result of precision, F-Measure and ROC area. Applying only browsing categories is limited in detect-ing students at-risk of failure (Zhou et al. 2018). This study, on the contrary, also found other characteristics (such as Facebook-based, google-cloud-storage-download, or YouTube-based) in an internet access log file could be associated with identifying students who are at-risk of fail-ure. To clarify, internet access activities include more at-tributes than using web browser activities alone. Therefore, these attributes can be exploited to better detect students at-risk of failure.
Conclusion and Further work
By detecting students who are at-risk of failing their stud-ies, this study provides insight for educators and govern-ments to plan and reduce the cost of the university studies. Analysing data from questionnaires by using statistical techniques such as SEM (Vuttipittayamongkol 2016) are useful and popular methods. However, the increasing number of the volume and varieties of the datasets may involve other techniques such machine learning techniques to discover complex patterns. These techniques also offer other benefits with reducing human intervention. Compar-ing the accuracy of results between decision trees, Naïve Bayes, Logistic Regression and Neural Network, the Ran-dom Forest approach is found to be best suited for this type of dataset.
This study also found that data from internet access ac-tivities reveals a better accuracy than data from web browsing categories alone. Using more data provides a better picture of the problem, i.e. detecting students who are at-risk of failure. In general, safe students showed bet-ter time management than at-risk students. If we can detect at-risk students from their internet behavior before the end of a semester then educators may be able to detect them and create an intervention programme to help them better manage their study time.
Further work could involve collecting more internet ac-cess log file data and analyzing it over a longer period as well as relating the period of data collection with events during the academic year. The deep learning model will be used in future work because the volume and varieties of the data can create highly complex patterns. Based on previous research in the literature, the deep learning method can outperform other algorithms as the complexity of data pat-tern increases. Early detection of students at-risk of failure can provide insightful information for intervention policies such as offering academic support to students, thereby en-abling their success at university.
References
Amornsinlaphachai, P. 2016. Efficiency of Data Mining Models to Predict Academic Performance and a Cooperative Learning Model. In Knowledge and Smart Technology (KST), 2016 8th International Conference on, 66-71. IEEE.
Araque, F.; Roldán, C.; and Salguero, A. 2009. Factors Influencing University Drop out Rates. Computers & Education
53(3):563–574.
Arsad, P. M.; Buniyamin, N.; and Manan, J. A. 2012. Neural Network Model to Predict Electrical Students’ Academic Performance. In Engineering Education (ICEED), 2012 4th In-ternational Congress on, 1-5. IEEE.
Conijn, R.; Snijders, C.; Kleingeld, A.; and Matzat, U. 2017. Predicting Student Performance from LMS Data : A Comparison of 17 Blended Courses Using Moodle LMS. IEEE Transactions on Learning Technologies 10(1):17–29.
Dong, X. L., and Srivastava, D. 2013. Big Data Integration. In
Data Engineering (ICDE), 2013 IEEE 29th International Confer-ence on, 1245-1248. IEEE.
Fedorov, M.; Fishler, B.; Wilhelmsen, K.; Flegel, M.; Wilson, E.; Adams, P.; and Brunton, G. 2017. Leveraging Splunk for Control System Monitoring and Management. In 16th International Con-ference on Accelerator and Large Experimental Control Systems, 253–257. JACoW.
He, J.; Bailey, J.; Rubinstein, B. I.; and Zhang, R. 2015. Identifying At-Risk Students in Massive Open Online Courses. In
AAAI, 1749–1755.
Macfadyen, L. P., and Dawson, S. 2010. Mining LMS Data to Develop an Early Warning System for Educators: A Proof of Concept. Computers and Education 54(2):588–599.
Maneerat, P.; Malaivongs, K.; and Khlaisang, J. 2015. The Comparison of Thai Qualification Framework for Higher Education and Capability Maturity Model Integration for Service.
Procedia - Social and Behavioral Sciences 182:225–231. Na, K. S., and Tasir, Z. 2017. Identifying At-Risk Students in Online Learning by Analysing Learning Behaviour: A Systematic Review. In Big Data and Analytics (ICBDA), 2017 IEEE Confer-ence on, 118-123. IEEE.
Respondek, L.; Seufert, T.; Stupnisky, R.; and Nett, U. E. 2017. Perceived Academic Control and Academic Emotions Predict Undergraduate University Student Success: Examining Effects on Dropout Intention and Achievement. Frontiers in Psychology
8:243.
Saqr, M.; Fors, U.; and Tedre, M. 2017. How Learning Analytics Can Early Predict Under-Achieving Students in a Blended Medical Education Course. Medical Teacher 39(7):757–767. Seidel, E., and Kutieleh, S. 2017. Using Predictive Analytics to Target and Improve First Year Student Attrition. Australian Journal of Education 61(2):200–218.
Senthil, S., and Lin, W. M. 2017. Applying Classification Techniques To Predict Students’ Academic Results. In Current Trends in Advanced Computing (ICCTAC), 2017 IEEE Interna-tional Conference on, 1-6. IEEE.
Shahiri, A. M.; Husain, W.; and Rashid N. A. 2015. A Review on Predicting Student’s Performance Using Data Mining Techniques. Procedia Computer Science 72:414–22.
Sittichai, R. 2012. Why Are There Dropouts among University Students? Experiences in a Thai University. International Jour-nal of EducatioJour-nal Development 32(2):283–289.
Ting, S. M. R., and Man, R. 2001. Predicting Academic Success of First-Year Engineering Students from Standardized Test Scores and Psychosocial Variables. International Journal of En-gineering Education 17(1):75–80.
Trakunphutthirak, R.; Cheung, Y.; and Lee, V. C. 2017. Conceptualizing Mining of Firm’s Web Log Files. Journal of Systems Science and Information 5(6):489–510.
Vuttipittayamongkol, P. 2016. Predicting Factors of Academic Performance. In Defence Technology (ACDT), 2016 Second Asian Conference on, 161-166. IEEE.
Yathongchai, W.; Yathongchai, C.; Kerdprasop, K.; and Kerdprasop, N. 2012. Factor Analysis with Data Mining Technique in Higher Educational Student Drop Out. Latest Ad-vances in Educational Technologies 111–116.