Application in Power Load Forecasting Based on an
Improved Combination Grey Model Weighted by
Correlation
WANG Jing-min
e-mail:[email protected]
LI Ya-kun
e-mail:[email protected]
Abstract: It is exceedingly difficult to get accurate predictions for single traditional prediction models because of the volatility, non-linear increment and complexity of power loads. In order to improve the accuracy for long-term power load forecasting, the multivariate exponential weighting grey prediction model, residual grey prediction model, dynamic and equal-dimensional information grey prediction model and equal time sequence grey prediction model were constructed and weighted by correlation so that an improved combination grey prediction model could be built to make a prediction and for empirical analysis. The example shows that the volatility can be effectively reduced by the multivariate exponential weighting model and dynamic equal-dimensional information model. Similarly, the residual model and equal time sequence model are suitable for the power load forecasting with non-linear increasing trend. Considering all kinds of features of power loads, the constructed combination model can improve the accuracy of power load forecasting effectively and ensure the economic and safe operation for power system.
Keywords: Improved Grey Model, Power Load Forecasting, Correlation Method, Combination Forecasting.
I.
I
NTRODUCTIONPower load forecasting is the premise of ensuring the safe and economic operation of electric system, as well as the basic of system scheduling and making-decisions [1]. Accurate load forecasting is exceedingly important to improve the economics of electric system and ensure the stability of operation. However, it is the volatility,
non-linear increment and multiple factors’ complexity [2] that
makes the power loads present varied characteristics. Therefore, a predict tool is urgently needed to improve the accuracy of prediction effectively.
Traditional forecasting methods [3-5] look for the relationships between relevant factors and power loads by establishing mathematical expressions, such as time series, linear regression, and trend extrapolation method and so on. Combined with computer technologies, emerging forecasting methods [6-8] analyze the relevant load data sequences and obtain the final predicted results by building models, such as grey prediction method, artificial neural networks, improved fuzzy clustering method and SVM method. Different forecasting methods can provide different and useful information. However, the power load which is influenced by social, economic, climate and other factors makes the traditional single forecasting method difficult to accurately describe the actual variation of power loads. Combining and utilizing all these available
information, the combination forecasting method [9] can explore the advantages of each model and compensate for the lack of a single model in order to improve the prediction accuracy.
Based on the above analysis, four improved grey prediction models, namely the multivariate exponential weighting grey prediction model [10], residual grey prediction model, dynamic and equal-dimensional information grey prediction model [11] as well as equal time sequence grey prediction model [12], were proposed. The multivariate exponential weighting method and dynamic equal-dimensional information method can effectively reduce the volatility, as well as the residual method and equal time sequence method can apply to power load forecasting of non-linear increasing trend. In order to maximize the advantages of each model, combined with grey correlation weighting method [13-14], a combined and improved grey model was constructed. It can both make the historical sample data of long-term power loads change over time, and significantly improve the prediction accuracy on the basis that the amount of sample and calculation does not be added. The example shows that owing higher precision and practicality than the traditional grey model and single improved grey model, the combined and improved grey prediction model can be used for long-term power load forecasting.
II.
T
HEG
REYF
ORECASTINGM
ODELGM
(1,
1)
AND ITSI
MPROVEDM
ODELSA. The traditional grey forecasting model GM (1, 1)
The traditional grey forecasting model consists of first-order differential equations of only containing a single variable. It has several advantages, such as small sample size, high prediction accuracy, simple calculation and easy check and so forth. The specific modeling process is as follows:
Assuming that the original data sequence is
0
[
0
1
,
0
2
,
,
0
]
n
x
x
x
x
炷
1炸
A first-order accumulated generating sequence is obtained with 1-
AGO
1
[
1
1
,
1
2
,
,
1
]
n
x
x
x
x
炷2炸
Among them,
k
x
i
k
n
x
k
i
,
,
2
,
1
1 0 1
Since the sequence
x
1
k
has the law of exponential growth and the solution of first-order differential equations is just the solution of exponential growth form, it can be considered that the sequencex
1 satisfies the following first-order linear differential equation:
u
t
ax
dt
t
dx
1 1Among them,
a
、
u
are unknown parameters, respectively representing the development coefficient and the degree of grey effect.Make A
a,u T,the least-squares approximate solution for A is:
B
B
B
Y
u
a
A
T TT 1
,
3Among them,
1
2
/
1
1
2
/
3
2
1
2
/
2
1
1 1 1 1 1 1n
x
n
x
x
x
x
x
B
n
x
x
x
Y
0 0 03
2
Plug u
a
,
into the original equation, make
,
1
1
0 1x
x
and get the grey prediction model ofhistorical data sequence
x
0 after cumulative reduction:
,.
,...,
2
,1
/
1
*
1
1
1
0 1 1 0n
k
e
a
u
x
e
k
x
k
x
k
x
a ak
4B. The improvements of grey prediction model GM
(1, 1)
To improve the accuracy of power load forecasting, four types of improved grey prediction model are proposed: the multivariate exponential weighting grey prediction model, residual grey prediction model, dynamic and equal-dimensional information grey prediction model and equal time sequence grey prediction model.
1 The multivariate exponential weighting grey prediction model
The volatility of power loads and the presence of outliers will limit the prediction accuracy of traditional grey models. In order to weaken the impact of outliers and increase the trend of original sequences, the original data sequence of power loads has been preprocessed and a new index increasing sequence is generated.
Assuming that the original data sequence of power load is:
]
,
,
2
,
1
[
0 0 00
n
x
x
x
x
5Among them,
x
0
k
is the actual value of thek
year and meets:
)
,
2
,
1
(
,
0
0n
k
k
x
Make
y
0
1
x
0
1
,Therefore, the new index increasing sequence {
y
0
k
} is: 0
0
(
1
)
0
1
(
2
,
,
)
n
k
k
y
k
x
k
y
6Make a prediction for {
y
0
k
},and then get the predict sequence{
k y0 ^
}. Finally, restore the predict sequence{
k y0 ^
} to the final results of power load forecasting{
k
x
0 ^
} by the following formula.
)
,
,
2
,
1
(
/
1
)
1
(
0 0 0 ^n
k
k
y
k
y
k
x
(7)Among them,
(
0
,
1
)
. Generally,
is equal to 0.5. 2 The residual grey prediction modelThe data sequence of power load is dynamic and has the trend of nonlinear growth. In the modeling process, utilizing the known data many times can develop explicit and implicit information of original sequence, excavate the system rule in depth, grasp the growth trend of power load, and further improve the accuracy of the constructed model. For the above reasons, the original grey forecasting model is modified and the residual grey prediction model is constructed.
Assuming that the residual between the original
sequence and the predicted sequence is
e
0
k
.
k
x
k
x
k
e
0 0
0
(8)
Among them,
k
0
,
1
,
2
,
,
n
The sub-sequence of
e
0
k
is as follows:
]
,
,
2
,
1
[
0 ' 0 ' 0 '' 0
n
e
e
e
k
e
Build the grey prediction model
GM
(
1
,
1
)
fore
0
k
'
:
n
k
e
a
u
e
e
k
e
'
1
a'1
*
0'1
/'
'
a't',1
2
,
,
' 0
9 Make
'1
0
k
e
as the correction model ofx
0
k
1
, and a residual grey prediction model can be obtained as follows:
0
'
0
''
0'
/'
1
1
/
1
*
1
1
e
ax
u
a
e
akk
i
e
ae
u
a
e
atk
x
(10) Among them,
k
i
1
(
k
i
),
or
k
i
0
k
i
),
i
n
n
'
.Generally, the actual value which is closer to the predicted value has a greater impact on the predicted value. Over time, long-term power load forecasting system will continue to be affected by some of disturbing factors in the future and has great volatility. The farther the future time is, the greater the grey interval of predictive value is. Thereby, the closest predictive data has the true meaning and a higher precision.
Based on the principles above, an improved grey forecasting model was put forward, namely the dynamic and equal-dimensional information grey prediction model. Whose principle is as follows: there is less information available for long-term power load forecasting. Therefore, in order to improve the prediction accuracy, according to the existing data, build the grey prediction model to predict a value, and then add the predictive value to the original sequence and remove the oldest data, so that the new composed sequence and the original sequence have equal dimension. They are gradually forecast until the predictive year so far.
4 The equal time sequence grey prediction model The long-term power load has a nonlinear growth trend and it may have a tipping point. In view of this, the equal time sequence grey prediction model was proposed. Namely, the original sequence is divided into several sequence segments owing an equal length to make a grey prediction for each estimated parameter, and then making a further power load forecasting according to the estimated parameters predicted. This method gives the parameters dynamic, so that they can change over time. Therefore, the impact on the prediction accuracy is not great when a tipping point of the system occurs. The specific steps are as follows:
First, divide the original sequence into
n
sub-sequences owing an equal length, build models for the sub-sequenceswith GM
1,1 one by one and get
u and
a of each sub-sequence, namely )
, 2 , 1 (a a an
and(u1,u2, un)
.Moreover,
establishGM
1,1 for sequence{a
n
} and sequence{
u
n
}
respectively, and obtain the
m
year’ predictive results ofa
m
and
u
m
.Finally, predict the corresponding
x
m
on the
basis of
a
m
and
u
m
,and it is the load forecasting value of
the
m
year.III.
T
HEC
OMBINED ANDI
MPROVEDG
REYF
ORECASTINGM
ODELB
ASED ONG
REYC
ORRELATIONW
EIGHTINGThe multivariate exponential weighting method and dynamic equal-dimensional information method can effectively reduce the fluctuation, as well as the residual method and equal time sequence method can apply to power load forecasting with non-linear increasing trend. In order to utilize the advantages of each model and compensate for the lack of the single improved model, considering the various features of power loads, the
combined and improved grey forecasting model based on grey correlation weighting was proposed, looking forward to improve the prediction accuracy of load forecasting effectively.
A. Grey correlation weighting
Grey correlation is an analysis method of grey system theory. It measures the degree of association between factors according to the similarity degree of their development trends. So the basic idea of grey correlation degree is to determine the degree of association on the basis of the similarity degree between curves. This method can be used to compare the fitting degree between the predictive curve and the actual curve. The larger the correlation, the more superior the prediction model, the smaller the fitting error. The paper determines the weights of each improved grey prediction model based on the size of correlation degree.
Assuming that the reference sequence (or the actual load sequence) is
x
0, and the compared sequence (or thepredicted sequence) is
x
i. Among them,
x
x
x
n
x
x
x
x
n
i
m
x
0
01
,
02
,
,
0 i
i1
,
i2
,
,
i
,1
,2
,
(11)So is the correlation coefficient between curve
x
0andcurve
x
ion the point ofk
.The resolution coefficient
must be between 0 and 1. Generally, it is equal to 0.5. Combined with the correlationcoefficient for each point, we can get that the correlation degree between the predicted load sequence
x
iand theactual load sequence
x
0is as follows:
k
n
r
n
k i
i
/
1
12Make each correlation degree become dimensionless by the following formula:
mi i
i
r
r
i
1
2
)
1
(
/
)
1
(
1
13 Thereby, the weights of each improved grey prediction model can be obtained as follows:
mi i i i
1
/
14B. The combined and improved grey prediction
model
Assuming that the actual value of power load forecasting is
x
t
t
1
,
2
,
,
n
. There arem
kinds of prediction methods and the predictive value obtained by the methodi
isf
it
i
1
,
2
,
,
m
. From the above, we know that the weights of each improved grey prediction
k x k x k
x k x
k x k x k
x k x k
i k
i i
i k
i i
k i
i
0 0
0 0
max max
max max min
min
model are
W
1,
2,
,
m
T, and meet that thesum of them is 1. Namely,
1
1
m i
i
.So the combined andimproved grey forecasting model based on grey correlation weighting can be expressed as:
t
n
f
x
m
i it i
t
1
,
2
,
,
1
15IV.
A
PPLICATION OF THEC
OMBINED ANDI
MPROVEDG
REYP
REDICTIONM
ODELFirstly, this paper through modeling made a prediction for the total electricity consumption of 2004-2009 years in Nanjing region. Secondly, the predictive ability and precision of the various forecasting models above were measured according to the comparison between the actual total electricity consumption and the predicted in 2010 – 2012 years. Finally, chose the combined and improved grey model to predict the total electricity consumption of 2013-2015 years in Nanjing region.
Table1: The historical data of total electricity consumption of 2004–2012 years in Nanjing
Unit: 100 million KWh
Years Total electricity
consumptions Years
Total electricity consumptions
2004 207.30 2009 337.05
2005 246.67 2010 373.66
2006 270.57 2011 399.74
2007 299.13 2012 424.96
2008 310.79
According to the data of 2004 – 2009 years in Table 1, respectively establish the traditional grey prediction model, the multivariate exponential weighting grey prediction model, residual grey prediction model, dynamic and equal-dimensional information grey prediction model and equal time sequence grey prediction model. Predict the total electricity consumption of 2010-2012 years by the above models and compare with the actual data to test the accuracy of each model. The specific processes are as follows by MATLAB:
(1) The traditional grey forecasting model: set up the relations between time and total electricity consumption
represented by
GM
1,1
, and obtain the coefficientvector:
The mathematical model is as follows:
0
-0.0750 0.0750
1 1 * 207.30 225.6961/ -0.0750 k
x k e e
(2) The multivariate exponential weighting grey prediction model A : First, process the original data according to the formula (6), and get the new data shown in Table 2.
Table 2: Data preprocessing in multivariate exponential weighting method
Unit: 100 million KWh
Years Total electricity
consumptions Years
Total electricity consumptions
2004 207.30 2009 314.71
2005 226.98 2010 344.19
2006 248.78 2011 371.97
2007 273.95 2012 398.46
2008 292.37
Second, use the new data to make a grey prediction and get the coefficient vector:
�̂ = [ −0.0 00 .6 ]� The mathematical model is as follows:
0
-0.0804 0.0804
1 1 * 207.30 203.6934 / -0.0804 k
x k e e
Finally, restore the data and obtain the final prediction results according to the formula (7).
(3) The residual grey prediction model B : revise the original grey prediction by the new method and get the mathematical model:
k
k
e
e
k
e
e
k
x
0.0091 0.0091
0.0750 0.0750
-0
0.0091)
/(
0.1346
00
.
0
1
)
-0.0750
/(
225.6961
30
.
07
2
*
1
1
k
1
(4) The dynamic and equal-dimensional information grey prediction model C : establish the grey prediction model according to the total electricity consumption of 2004-2007 years in Nanjing region and predict the total electricity consumption for next year. And then add the predictive value to the original sequence. Similarly, remove the oldest data. They are gradually predicted until the 2012 year so far.
(5) The equal time sequence grey prediction model D : divide the total electricity consumption in Nanjing into three sub-sequences, including 2004 – 2007years, 2005 - 2008 years, 2006 - 2009 years. Make grey predictions respectively and obtain the values of
u
and
a
:(-0.0966, -0.0678, -0.0605), (214.3622, 247.8062, 271.3968). Then get the
u
and
a
of 2010 - 2012 years, put them into the formula (4) and obtain the final prediction results.The prediction results by the above five methods are shown in Table 3 and Table 4.
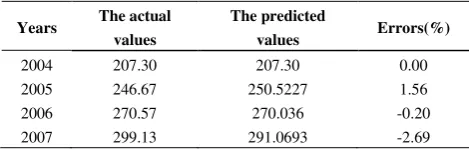
Table 3: the prediction results for total electricity consumption of 2004-2012 years by the traditional grey model
Unit: 100 million KWh
Years The actual
values
The predicted
values Errors(%)
2004 207.30 207.30 0.00
2005 246.67 250.5227 1.56
2006 270.57 270.036 -0.20
2007 299.13 291.0693 -2.69
T
A
-2008 310.79 313.7408 0.95
2009 337.05 338.1782 0.33
2010 373.66 364.519 -2.45
2011 399.74 392.9115 -1.71
2012 424.96 423.5156 -0.34
Table 4: the prediction results for total electricity consumption of 2010-2012 years by each improved grey model
Unit: 100 million KWh
years A errors % B errors %
2010 369.43 -1.13 364.66 -2.41
2011 400.34 0.15 393.05 -1.67
2012 433.85 2.09 423.66 -0.3
years C errors % D errors %
2010 368.26 -1.45 382.58 2.39
2011 398.18 -0.39 396.7 -0.76
2012 424.21 -0.18 424.42 -0.13
According to the formula (11) and formula (12), the correlation degree between the original sequence and the prediction results by the multivariate exponential weighting grey prediction model is:
r
1
0
.
6471
; the correlation degree between the original sequence and the prediction results by the residual grey prediction model is:5644
.
0
2
r
; the correlation degree between the original sequence and the prediction results by the dynamic and equal-dimensional information grey prediction mode is:7670
.
0
3
r
; the correlation degree between the original sequence and the prediction results by the equal time sequence grey prediction model is:r
4
0
.
6813
.According to the formulas (13) - (14), get the corresponding weights of each single model in the combined model. The specific results are as follows:
2617
.
0
,
3227
.
0
,
1783
.
0
,
2373
.
0
2 3 41
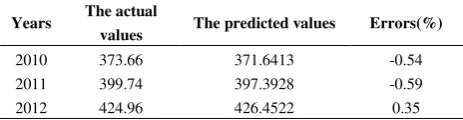
Use the formula (15) to obtain the predictive value of the combined and improved grey prediction model on the basis of the above weights and the predictive value of each single improved grey prediction model in Table 4. Then compare the predictive value with the actual value and determine the error. The specific data is shown in Table 5.
Table 5: the prediction results for total electricity consumption of 2010-2012 years by combined and improved grey model
Unit: 100 million KWh
Years The actual
values The predicted values Errors(%)
2010 373.66 371.6413 -0.54
2011 399.74 397.3928 -0.59
2012 424.96 426.4522 0.35
The correlation degree between the actual value and the predictive value by the combined and improved grey prediction model is:
r
0
.
7830
.Compare all the correlation degrees and get the following results:
5644
.
0
6471
.
0
6813
.
0
7670
.
0
7830
.
0
2 1
4 3
r
r
r
r
r
So the actual value and the predictive value for the combined and improved grey prediction model have a better correlation.
The results show that: In the error, the errors of the total electricity consumption predicted by the combined of improved grey prediction model are less than 1%, significantly better than the traditional grey prediction model and each improved grey prediction model; In grey correlation, the combined and improved grey prediction model has a better correlation, as well as a higher prediction accuracy.
Therefore, the combined and improved grey forecasting model based on grey correlation weighting can effectively improve the prediction results. So with this method to make a prediction for the total electricity consumption of 2013 – 2015 years in Nanjing, the detailed data is in Table 6.
Table 6: the prediction results for total electricity consumption of 2013-2015 years in Nanjing
Unit: 100 million KWh
years The predicted values
2013 457.4132
2014 490.8472
2015 526.7250
V.
C
ONCLUSIONCombined with grey correlation degree and the four improved grey prediction model proposed in above, the combined and improved grey forecasting model was constructed. Considering the various features of power load growth, the model can utilize the advantages of each single model and make up for their shortcomings. The empirical test showed that: On one hand, the method has higher prediction accuracy, a less error and a greater grey correlation degree than each of the single prediction model. Overall, the prediction result is better than those in single prediction model. On the other hand, the combined and improved grey forecasting model expands the scope of application of the basic grey prediction model. It is suitable for long-term power load forecasting which has the features of volatility or non-linear growth. So the practicability of this method is stronger.
A
CKNOWLEDGEMENTSThis research is sponsored by:
(1)The Fundamental Research Funds for the Central Universities (2014XS86).
(2)Funding of the Energy Economic Development Strategy Research Base Project at Hebei Soft Science Research Base.
sity (12MS137).
R
EFERENCES[1] Sheikh S K, Unde M G. Short-term load forecasting using ANN Technique[J]. Int. J. Engin. Sci. Emerg. Tech, 2012, 1: 97-107. [2] Liu X, Fang J. Long-term load forecasting based on a time-variant
ratio multiobjective optimization fuzzy time series model[J]. Mathematical Problems in Engineering, 2013, 2013.
[3] Hagan M T, Behr S M. The time series approach to short term load forecasting[J]. Power Systems, IEEE Transactions on, 1987, 2(3): 785-791.
[4] Song K B, Baek Y S, Hong D H, et al. Short-term load forecasting for the holidays using fuzzy linear regression method[J]. Power Systems, IEEE Transactions on, 2005, 20(1): 96-101.
[5] Sheikh S K, Unde M G. Short-term load forecasting using ANN Technique[J]. Int. J. Engin. Sci. Emerg. Tech, 2012, 1: 97-107. [6] LIAN W, DU X, WU X, et al. Application of the Grey Forecasting
Model of Equidimensional Filling Vacancies in the Medium-long Term Load Forecasting of Power System [J][J]. Sci-Tech Information Development & Economy, 2007, 1: 099.
[7] Taylor J W, Buizza R. Neural network load forecasting with weather ensemble predictions[J]. Power Systems, IEEE Transactions on, 2002, 17(3): 626-632.
[8] Wang J, Jin S, Qin S, et al. Swarm Intelligence-Based Hybrid Models for Short-Term Power Load Prediction[J]. Mathematical Problems in Engineering, 2014, 2014..
[9] Azadeh A, Sheikhalishahi M, Tabesh M, et al. The effects of pre-processing methods on forecasting improvement of artificial neural networks[J]. Aus. J. Basic. Appl. Sci, 2011, 5(6): 570-580. [10] XING Mian, YANG Shi-jun, NIU Dong-xiao. Research on grey
optimization combination power load forecasting based on multivariate exponential weighting [J]. Power System Technology, 2005, 29(4):8-11.
[11] LI Wei, HAN Li. Application in power load forecasting based on combination grey forecasting model [J].Journal of Chongqing University, 2004, 27(1).
[12] HUANG Qing-she, DENG Wen-bin,ZHOU Bao-wen. Grid load forecasting by grey model-based equal time sequence [J]. East China Electric Power, 2010(8):1240-1243.
[13] PIRZAD D, PORANNEJAD M. STOCK EXCHANGE INDEX PREDICTION USING HYBRID MODELS[J]. Indian J. Sci. Res, 2014, 7(1): 186-193.
[14] HUANG Yuan-sheng, ZHANG Hui-juan. Application of grey relational grade based combined weights to power load forecasting [J]. East China Electric Power, 2009, 37(2):225-228.
A
UTHOR’
SP
ROFILEWANG Jing-min
E-mail:[email protected]
Brief Introduction: Doctoral tutor, School of Economics and Management, North China Electric Power University, The research direction: Information management and decision analysis, Management science and application, Project assessment and risk management.
LI Ya-kun
E-mail:[email protected]