Copyright © 2014 IJECCE, All right reserved
A Model of Design for Assembly using Data Warehouse,
Genetic Algorithm, and Neural Network
N. Mostafavi
Department of Computer and IT Engg., Shiraz University, Shiraz, Iran Email: [email protected]
N. Seifoori
Department of Computer and IT Engg., Shiraz University, Shiraz, Iran
Email: [email protected]
G.H. Khalaf
Department of Mechanical Engineering, Islamic Azad University, Shiraz, Iran
Email: [email protected]
Abstract – Nowadays in industries, being aware of the importance of product design for facilitating the manufacturing process is of utmost prominence. Its principles and applications are a novel approach in intelligent design of parts as well as manufacturing and Assembly engineering and utilizing software applications of computer-aided-design has transformed into a valuable tool for design engineers.
This study tries to introduce design for manufacturing and assembly using computers and data mining in order to help engineers to evaluate part manufacturing measures so that the engineers can reach an insight based on the present variables such as the number of parts, the type of the devices and necessary equipment for manufacturing different parts and also they can get a better understanding of selecting the type of manufacturing process in order to build and construct different products in comparison to cost estimations. Since data warehouse is the most useful technology in this regard and the necessary data for evaluating formulae can be modeled as multi-dimensional data and stored in time series in data inventories and apply different analysis methods on them, the current paper proposes a model for minimizing the costs in “design for assembly” using data warehouse, genetic algorithm and neural networks and eventually the results obtained from this model will be compared to the findings of the previous tools.
Keywords – Manufacturing and Production, Design
for Assembly, Data Mining, Data Warehouse, Genetic Algorithm, Neural Networks.
I. INTRODUCTION
Utilizing data mining in manufacturing engineering began in 1990 [1]-[3] and gradually developed regarding manufacturing firms. Nowadays, data mining is used in several different manufacturing engineering fields for discovering knowledge pertaining to maintenance and repairs, error detection, design, manufacturing, quality control, scheduling and decision making assistant systems. The data can be analyzed for determining hidden patterns in parameters of manufacturing control process or improving quality of manufactured products. The main advantage of data mining in manufacturing engineering is that the data required for analysis can be studied during the normal operation of manufacturing process; hence, there is no need to allocate special processes for data
collection and gathering. In many manufacturing firms, the data are stored for quality control and tracking purposes or sometimes for simple statistical analysis in order to appraise previous performance. This database can be used in case of any problem during the manufacturing process; however, the operational information present in this database can be utilized beyond these simple purposes. Machine learning tools and computational intelligence provide a useful potential for controlling manufacturing systems; particularly, in complex manufacturing environments where detecting the causes of problems is too difficult.
In order to successfully implement data mining in design and manufacturing environments, a number of critical issues such as data selection, integration, cleansing and preparation should be dealt with. Hence, supporting facilities or technologies which help these processes are very valuable:
One of the most important supporting technologies is data warehouse which is used in a firm as a process for integrating operational systems (storing data related to the product, process, assembly, supply, buy and so on) in order to provide a central data management and to realize decision making support objectives. Hence, pre-processing, including data cleansing and transformation for analysis and discovery, can be facilitated by a data warehouse.
Report generator which is used to present the extracted patterns in a format readable by the user is another type of supporting technology. If the discovered information is used mostly by different computers (such as CNC systems, industrial robots and so on), then it is mandatory that the computer is able to interpret the output.
The huge computational operations of data mining can be carried out using parallel computation and distributed computation operating systems. Once, data mining is systematically implemented in the manufacturing environment and it is used for performing continuous activities such as preventing maintenance of machinery and real-time supervision of all the manufacturing processes, parallel aspects are very critical.
II. DESIGNING MANUFACTURING AND
PRODUCTION SYSTEMS
Copyright © 2014 IJECCE, All right reserved information residing in databases. However, designing a
data backup, which would be able to use historical data as much as current data, for manufacturing firms is very difficult.
The entire production process can be divided into seven steps: engineering and design, testing and evaluation, production, distribution and sale, operation, repair and maintenance and disposal. During each one of these steps data is generated, which should be readily available for analysis in order to gain a general insight into the life cycle of the product. Information gained through this analysis can be used for redesigning or introducing new products. Based on different studies, Prasad [6] concluded that indirect costs were 4 to 5 times larger than the direct costs of workforce and raw material. Figure (1) represents the high level architecture of data collection during the life cycle of the product and storing it in a data warehouse.
When data mining is utilized as an information retrieval tool, the presence of any kind of data warehouse in a manufacturing firm is very important. Data warehouse leads to significant time saving, generally lost during data gathering from different sources during the preliminary steps of data extraction. In complex production environments where all the processes are not carried out in a single site and the product should be transferred from one site to another during the manufacturing process (as shown in Fig 2), the data should be collected from each one of these sites and after cleansing, the integrated information will be stored in the data warehouse. If the data is gathered from unique sites, then before being used for data mining, a significant effort for pre-processing should be applied. However, if this process requires online data mining, a network is required to share information or governing rules extracted from each site, which will be explained in later sections. The data pertaining to each site and process should be archived in a common storage after cleansing and integration in order to prevent any kind of repetition or errors. When storing information in data warehouse, if the requirements of data mining implementation are considered, then the pre-processing step will be shorter and therefore, the time duration required for the entire information retrieval process will be decreased.
Fig.1. Data in production cycle
III. INTEGRATED DATA MINING
As explained before, a manufacturing firm can utilize data mining for solving its problems. However, for online
detecting and solving problems, we need an integrated data mining system [7]. This architecture can be used for providing solutions to certain problems and in other sites with similar parameters.
In integrated data mining model, data mining techniques can be used in small scale inside a portion of manufacturing processes and the main part of the data mining engine is responsible for coordinating and sharing information and data transferred between individual data mining engines. When connected to individual data mining engines, the main engine establishes a data mining network (Fig 3) which allows the mining of the entire process. The entire manufacturing process can be divided into smaller steps and the information pertaining to each step and its adjacent steps can be mined independently. The same principles can be used for expanded manufacturing firms where different sites are located in different locations, cities, countries or even continents.
Data mining algorithms, called rule induction, can discover the present relations among individual or dependent processes. However, it cannot be used for other discrete steps unless the data is located on a common data warehouse [10].
Copyright © 2014 IJECCE, All right reserved Data mining activities and the main data warehouse
work in parallel during the process of constructing the data warehouse of the firm.
Each step possesses its local data and data mining engine as well as its own data warehouse where the data is stored after cleansing. Moreover, the data will be transferred to a central data warehouse which has a direct link with the pattern warehouse for analysis and extraction of the entire system’s information.
If this same method is used in an integrated system where manufacturing occurs in different sites, then the central data warehouse will be constructed in a standard format. Data from unique sites are transferred to data warehouse in an XML format which is mined for the entire process and the extracted information and rules will be returned in the same format. Figure (3) presents four types of these manufacturing processes or sites. The input and output of the manufacturing process are presented and data pertaining to the manufacturing process are collected in local data warehouse and then this data is transferred in XML format to the central data warehouse. The result of the data mining process (if available) is implemented in manufacturing process and the same information will be reported to the central system which carries out the analysis. If any one of the other processes shows the same type of problem, the central or main data mining engine will try at first to propose the same solution for this problem. In future, this method will minimize the time spent in understanding problems and finding solutions. Moreover, the data mining engine can provide other solutions but using previous solutions and refining them based on present requirements will help make the problem solving process more efficient and cost-effective.
The integrated model should be supported by the online visual model so that the worker operating the machinery and products would be able to get a clear insight into the procedure and products [11]. The visible section should allow the user to argue and discuss the philosophy behind this model with his or her colleagues, internal and external customers as well as other users.
Fig.3. A model of Integrated Data Mining
IV. DATA MINING APPLICATION FOR
MANUFACTURINGCRISP-DMTM, SEMM, SolEuNet, Kensington, and DMG institutions developed an expansion methodology and language as well as a software tool for industrial data mining software applications. The majority of published studies pertaining to data mining in manufacturing particularly propose programs and systems which deal with a certain problem range, such as fault detection.
Standard methodologies such as SEMMA (Sample, Explore, Modify, Model, Asses) and CRISP-DM (CRoss Industry Standard Process for Data Mining) have been developed for the data mining process and facilitating its implementation in industry.
The SEMMA and CRISP-DM have been extensively utilized in data mining. SEMMA and CRISP-DM provide a step by step direction for implementing data mining. CRISP-DM is simpler than SEMMA and provides instructions which can be used by ordinary individuals for data mining purposes. SEMMA has been developed by a set of functional tools for SAS miner software application. Different reported data mining studies carried out in several different application programs in the field of production engineering, which clearly indicate the recent industrial trends regarding application programs of data mining and state that at the beginning of this century, individuals have focused on historical databases in order to solve problems. Fields including production processes, fault detection, design engineering and decision making systems have gained the lion’s share of the attention from researchers and fields such as maintenance and repair as well as planning require more attention.
Instances of production service programs where data mining has been successfully implemented include:
Aluminum processing, manufacturing semi conductor, electronical assembly, DNA production, biotechnology and chemical industries, energy production, medical application, Pharmaceutical Applications [12].
Copyright © 2014 IJECCE, All right reserved
V. DATA MINING TECHNIQUES FOR
MANUFACTURING
Data analysis or data mining of manufacturing organizations can be carried out using all the available data mining techniques. Some of the effective data mining techniques such as association rule, rule induction and so on are mainly utilized for analyzing shopping and retail market [8]-[9]; however, they are useful in any type of manufacturing databases.
Based on the previous studies, certain data mining techniques are used based on the problem. For instance, for data which has multiple attributes such as manufacturing data or the data which is numerical, the most appropriate algorithms include decision tree, the closes neighbors and neural networks; however, utilizing each one of these algorithms is actually dependent upon the type of problem in manufacturing firms. Some of the most common data mining tools regarding manufacturing databases include:
Clustering, classification, regression, time series, discriminant analysis.
neural network
genetic algorithm
In all types of data mining processes, the pre-processing step can be performed using statistical techniques and preliminary analysis of the data using statistics and Structured Query Language (SQL) and in many cases, roughly 80% of the desired information can be extracted from a database using SQL commands. However, the remaining 20% of the hidden information require advanced techniques such as expert systems, fuzzy expert systems, case-based learning, decision making tree, neural networks, and genetic algorithm and so on. For example Hopfield neural network and Genetic algorithm, which we have used in our model, are demonstrated in the following.
A.
Hopfield Neural Network
Hopfield net is a form of recurrent artificial neural network invented by John Hopfield. Hopfield nets serve as content addressable memory systems with binary threshold units. They are guaranteed to converge to a local minimum, but convergence to one of the stored patterns is not guaranteed [13]. These are formal represented as bellow [14];
= 𝑊𝑣 + 𝑖 − 𝑇 (1)
𝑖 = 𝑤𝑖𝑗 𝑛
𝑖=1 𝑗 ≠𝑖
𝑣𝑗+ 𝑖𝑗− 𝑇𝑖
= 1
2
. . 𝑛
𝑊 =
0 𝑤12 𝑤12 𝐾 𝑤12
𝑤12 0 𝑤12 𝐾 𝑤12
𝑤12 𝑤12 0 𝐾 𝑤12
𝑀 𝑀 𝑀 0 𝑀
𝑤12 𝑤12 𝑤12 𝐾 0
𝑖 = 𝑖1
𝑖2
. . 𝑖𝑛
𝑣𝑖 = +1 𝑖𝑓 𝑖 > 0
𝑣𝑖 = −1 𝑖𝑓 𝑖 < 0
𝑣𝑖𝑘 +1= 𝑠𝑔𝑛 𝑤𝑖𝑡𝑣𝑘+ 𝑖𝑖− 𝑇𝑖
𝐸 = −1
2𝑣
𝑡𝑊𝑣 − 𝑖𝑡𝑣 + 𝑡𝑡𝑣 (2)
Fig.5. Hopfield network Structure
Its specifications are:
• These are single layered recurrent networks
• All the neurons in the network are fedback from all other neurons in the network
• The states of neuron is either +1 or -1 instead of (1 and 0) in order to work correctly.
• No of the input nodes should always be equal to no of output nodes
B. Genetic Algorithm
The genetic algorithm (GA) is a search heuristic that mimics the process of natural selection. This heuristic (also sometimes called a metaheuristic) is routinely used to generate useful solutions to optimization and search problems [15].
In a genetic algorithm, a population of candidate solutions (called individuals, creatures, or phenotypes) to an optimization problem is evolved toward better solutions. Each candidate solution has a set of properties (its chromosomes or genotype) which can be mutated and altered; traditionally, solutions are represented in binary as strings of 0s and 1s, but other encodings are also possible [16].
A typical genetic algorithm requires:
1. A genetic representation of the solution domain, A standard representation of each candidate solution is as an array of bits (fig 6).
2. A fitness function to evaluate the solution domain.
Fig.6. Gene, chromosome, and population.
After an initial population is randomly generated, the algorithm evolves the through three operators:
1. selection which equates to survival of the fittest; 2. crossover which represents mating between
individuals;
Copyright © 2014 IJECCE, All right reserved Fig.7. Crossover operator.
Fig.8. Gene mutation operator
The Algorithm is:
randomly initialize population(t)
determine fitness of population(t)
repeat
oselect parents from population(t)
operform crossover on parents creating population(t+1) operform mutation of population(t+1)
odetermine fitness of population(t+1)
until best individual is good enough
VI. DESIGN FOR ASSEMBLY: AN IMPORTANT
STEP IN MANUFACTURING
Production engineers understand that 85 percent of manufacturing costs is determined in the preliminary design stages. When a conscious decision is considered in conceptual stage, future costly corrections and amendments are avoided. Using different software applications, the difficulty of assembly can be estimated, potential design solutions can be evaluated and the most effective method can be chosen and therefore the minimum number of parts can be used for manufacturing a product. Two commercially available DFA packages are used in the teaching delivery, namely: Boothroyd Dewhurst DFA [17] and Lucas Design For Assembly Technique [18].
The stages for the assembly design process in Lucas method include five main stages and at least 12 secondary stages, where around 70 different measures are decided upon. Each measure is indicated by a standard icon in mechanical engineering; therefore, the iconic model can be used for implementing these stages. By choosing each icon based on the specifications of each part, the desired measure is allocated a value and these values are substituted into the related formulae and after all of these steps of the process, the final cost of the assembly is calculated [2].
A.
Functional analysis
During the first step, through questions asked from a user using a flowchart, it is determined if the part is an essential part (A component) or a non essential one (B component). The main part is a part created through the
assembly of other parts and a secondary part is a part consisting only of one part. For example, regarding the mobility cost of a part using standard icons, the related measures are allocated different values. In the following, these stages are briefly introduced.
B. Manual teransfer cost analysis
During this analysis, using items determined by the user through standard icons, the cost of moving the part based on its size and weight as well as transportation complications and its orientation is calculated in cases where this process is carried out manually.
C. Automatic teransfer cost analysis (automatic feeding) Since in this step, length to width ratio (diameter) of the part or piece is important in calculating the cost, first this ratio will be determined. During this analysis, using items determined by the user through standard icons, the cost of moving the part based on its size and weight as well as transportation complications and its orientation is calculated in cases where this process is carried out automatically.
D. Griping cost analysis
During this analysis, using items determined by the user through standard icons, the cost of handling the part regarding the ample surface for handling and accessibility of this surface is calculated.
E. Non assembly cost analysis
During this stage, other costs not related to assembly, which are related to the handling of the part (whether manual or automatic), are calculated.
Fig.9. DFA Analysis Flowchart [19].
The procedure for determining the value of each one of these measures is very complex and involves several exceptions. The total cost often is evaluated by CAD software tools [20]. The final calculation formulae are briefly presented in the following.
Design eficiency = A 𝑐𝑜𝑚𝑝𝑜𝑛𝑒𝑛𝑡
𝑡𝑜𝑡𝑎𝑙 𝑐𝑜𝑚𝑝𝑜𝑛𝑒𝑛𝑡 × 100 (3)
feeding & 𝑎𝑛𝑑𝑒𝑙𝑖𝑛𝑔 𝑟𝑎𝑡𝑖𝑜 = 𝑓𝑒𝑒𝑑𝑖𝑛𝑔 𝑜𝑟 𝑎𝑛𝑑𝑙𝑖𝑛𝑔 𝑖𝑛𝑑𝑒𝑥
A 𝑐𝑜𝑚𝑝𝑜𝑛𝑒𝑛𝑡
(4) fitting ratio = griping +fitting +fixing
A component (5)
Copyright © 2014 IJECCE, All right reserved
VII. OUR METHODOLOGY IN FOR AUTOMATIC
DFA ANALYSIS
By combining all the main and secondary stages of the process of design for assembly, we can construct multi-dimensional data and by adding the time dimension we can maintain a record of the designs and utilize the widespread facilities of the data warehouse for preparing the necessary reports. We can also apply data mining algorithms on the data and extract patterns which help us decide on the cheapest assembly method of a product. Data used in computational formulae in design for assembly.
A.
Transforming Measures into a Multi-Dimensional
Model and Constructing the Data Warehouse
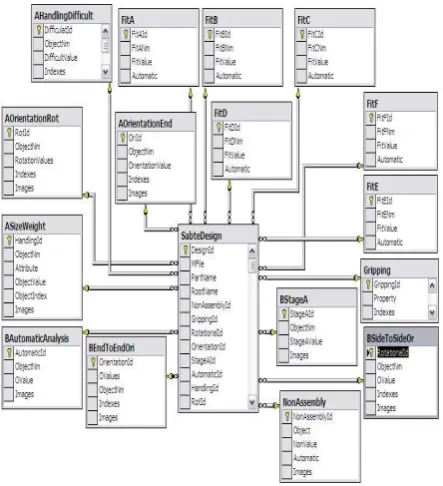
Considering the availability of all the required items for carrying out the correct calculations in this multi-dimensional model, the star schematic is appropriate for constructing the data warehouse; possess dimensions which are presented in Table (I).Table I: Data warehouse fact table demonsion Dimension
Non assembly cost Time
Gripping cost Size and weight cost
Side to side orientation cost Fitting cost End to end orientation cost A component Non mechanical orientation cost Frequency Mechanical orientation cost Lifetime Handling and feeding cost Lenght
Axis orientation cost Diagonal or width
Axis rotation cost Form
In this star model, the fact table where all the designs are recorded continuously includes the time index as well as the indices of all the tables for other dimensions and some extra information (Fig.10).
Fig.10. Data warehouse star modle for DFA
Query for the calculation of the cost is carried out using the stored procedures of SQL server and it possesses the Designe code, component Id, and component’ root id as input and all of the costs that mention in tabla as output parameters.
The value of output parameters is calculated in this procedure and is utilized in the formula for calculating the final cost. The procedure of calculation is very complex and includes around 160 lines of code, which is not fully presented here.
B.
Minimization Assembly Cost using GA
In this paper for a part with n simple subparts each chromosome is one possible assembly thus each chromosome is modeled as a partition of a set with n elements [21].
P is a partition of X if and only if all of the following conditions hold:
1. P does not contain the empty set.
2. The union of the sets in P is equal to X. (The sets in P are said to cover X.)
3. The intersection of any two distinct sets in P is empty. (We say the elements of P are pairwise disjoint.) In mathematical notation, these conditions can be represented as
1. ∅ ∉ 𝑃 2. 𝐴∈𝑃𝐴 = 𝑋
3. if 𝐴, 𝐵 ∈ 𝑃 and 𝐴 ≠ 𝐵 then 𝐴 ∩ 𝐵 = ∅, where ∅ is the empty set.
For example, one possible partition of a part with six simple subparts{1,2,3,4,5,6}is {1, 3}, {2}, {4, 5, 6}..in this representation, each group that indicates with {}. If a group has two or more elements, shows an essential part, and If a group has one element, shows an non essential part in lucas DFA method. the subparts in the set are so ordered that they can be assembled from 1 to n, thus each partition indicates a valid assembly (table II).
Table II: Some chromosome for assembly a part with 6 subparts {1,2,3,4,5,6}.
Partition (chromosome)
Essential part(A)count
Non essential part(B)count
{1},{2},{3,4},{5,6} 2 2
{1,2,3},{4,5},{6} 2 1
{1,2,3},{4},{5},{6} 1 3
For fixed length chromosome, We consider each chromosome as a binary 0,1 vector that contains 2𝑛− 1 genes. Each gene indicates one subset; if a subset is an element of a partition, the value of its gene is set to 1 otherwise 0 (table III).
Table III: a chromosome and its binary chromosome Partition
chromosome
Partition Binary chromosome
{1},{2,3} {1} {2} {3} {1,2} {2,3} {1,3} {1,2,3}
1 0 0 0 1 0 0
Copyright © 2014 IJECCE, All right reserved We train a multi Objective ga algoritm in the MATLAB
ga tool for minimization equation 3,4, and 5 as the fitness functions F1, F2, and F3 to reach a comprehensive solution which optimizes all of these costs.
The model retrives assembly data from the data wherehouse In the evaluation process. MATLAB ga Parameters for this problem has been set as bellow: PopulationType : 'bitstring'
PopInitRange: {[0;1]} PopulationSize: 3 Generations: 50
InitialPopulation: Matrix
for achieving global minimum,we used GA in 20 loops itteration and selected the best solution.
C.
patterns recognition using hopfield neural
network
GA algorithm finds some local minimums but the golobal minimum may not be found. Using previous solutions that stored in the datawarehouse and modeling them as patterns of hopfield neural network will help make the problem solving process more efficient and cost-effective. After an assembly design was selected, we stored this design and this specification (e.g. its assembly design, essential and nonessential parts, end to end orintation cost, side to side orientation cost, fitting rate, transfer rate …) in the dataware house. When a new assembly procces is started, the previous design is passed to hopfield network as patterns. The new design may be converged to a pttern that the hopfield network indicated. In MATLAB hopfield neural network is defined in the following:
net = newhop(P);
where P is a matrix that contains previous patterns. After training Hopfieild network with the patterns, we can pass new desigin specifications as input parammeter to this network with the following code;
[Y] = net(S,{},I);
Where Y is the output matrix that indicates the path from I to a recognized design pattern (one of hopfield stable points), S is a scaler value that indicates number of steps, and I is a matrix that indicates the input design specification. We can see our network structure (fig 11) with the following code:
view(net);
Fig.11. A hopfield network structure in MATLAB
This model has been tried for several different parts. For example, the X piece consists of 5 different pieces.
VII. RESULTS
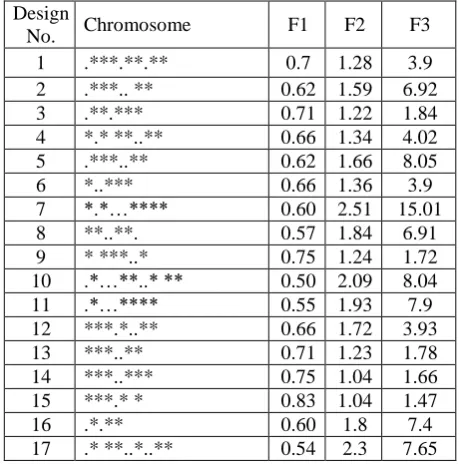
Results have been shown in tables IV and V for two parts with 15 and 32 omponents in 20 iterations of appling the hibrid model. Since the chromosoms were lengthy, they were represented with “*” and “.” Which “*” indicates “A component” and “.” indicates “B component”.
Acording to the tables IV, It can be seen that the results have reached to the 60% efficiency but not surpassed it (60% -75% has been related as a good design in DFA documents). This is the reason of the part components count. The model diagnosis is increased, if a part components count be reduced.
Table IV: Evalulated results for a part with 32 component F3 F2 F1 Chromosome Design No. 17 4.4 0.27 .*..…**..* 1 15.41 2.82 0.43 .*…**...**.. ** 2 16.29 3.62 0.35 .*..…**..**. 3 15.50 2.95 0.42 ..*….* **..** 4 15.59 2.11 0.42 .*… ..***..** 5 16.21 3.2 0.35 .*…**…..** 6 15.01 2.51 0.46 *.*…**...** 7 14.35 2.6 0.50 **..**.. 8 15.93 3.34 0.38 .*…**..*..* 9 16.9 4.25 0.28 .*…*….*..* 10 15.78 3.13 0.40 ….*…**..*** 11 16.61 3.01 0.41 .*…*.*..** 12 16.50 3.71 0.33 .*…*….*..** 13 13.94 2.7 0.58 .***..*..*** 14 15.66 3.08 0.40 .*…**..*…* 15 16.53 3.88 0.31 .*..…**..*…* 16 15.89 3.34 0.38 .*…*..*..** 17 16.21 3.62 0.35 .*…**..*…* 18 15.71 3.19 0.40 .*…… *..**** 19 16.83 4.1 0.29 .*…*……*..** 20
Copyright © 2014 IJECCE, All right reserved 8.06
1.66 0.62 .* **..**
18
7.58 1.57 0.66 .* *..****
19
16.83 4.1
0.66 *.*
20
Table V represented better results. The part represented in table V has 15 components. The design efficiency that calculated by the model has excced from 70%. If two designs have equal efficiency then F2 and F3 are the evaluation metrics.
All the results show the model can represent designs that they are not very bad even if the model hasn’t excellent efficiency for parts with many components.
When we use data warehouse, we can maintain a record of the data, good designs, and bad designs, acquired reports resulted from analyzing this data and deciding on the best design is carried out easily.
VIII. CONCLUSION
There are wide varieties of manufacturing and production ranges in which data mining is used. Data mining can be used a a supporting tool for determining causal relationships between input factors related to the manufacturing process and outside factors related to firm competition, such as manufacturing measure and productivity parameters as well as the objectives of the firm. Since manufacturing environments are inherently dealing with time and location, the factors of time and space are used in calculations of the data mining process for correct interpretation of the obtained data. For example, the process of “design for assembly” is extensive and relatively complex. On the other hand, it can be implemented as multi-dimensional data in data warehouse where we can use the advanced facilities of data warehouse for analysis and using data mining techniques such as genetic algorithm and neural networks we can decide on the cheapest assembly method possible.
ACKNOWLEDGMENT
We would like to thank Iranian Telecommunication Manufacturing Company (ITMC) for their assistance and guidance in this research.
REFERENCES
[1] M. Lee, “The knowledge-based factory”, Artificial Intelligence
in Engineering, vol. 8, no. 2, pp. 109-125, 1993.
[2] K. Irani, J. Cheng, U. Fayyad and Z. Qian, “Applying machine learning to semiconductor manufacturing,” IEEE Expert, vol. 8, no. 1, 1993, pp. 41-47.
[3] G. Piatetsky-Shapiro, “The data-mining industry coming of age,”
IEEE Intelligent Systems, vol. 14, no. 6, 1999, pp. 32-34.
[4] J. Harding and B. Yu, “Information-centred enterprise design supported by a factory data model and data warehousing,”
Computers in Industry, vol. 40, no. 1, 1999, pp. 23-36.
[5] J. Harding and K. Popplewell, “Information modelling: An integration of views of a manufacturing enterprise,”
International Journal of Production Research, vol. 37, no. 12,
1999, pp. 2777-2792.
[6] B. PRASAD, “Survey of life-cycle measures and metrics for concurrent product and process design,” AI EDAM, vol. 14, no. 2, 2000, pp. 163-176.
[7] J. Harding, M. Shahbaz, Srinivas and A. Kusiak, “Data Mining in Manufacturing: A Review,” Journal of Manufacturing Science
and Engineering, vol. 128, no. 4, 2006, pp. 969.
[8] F. Rodrigues, M. Carlos Ramos, and P. R. Henriques. "Knowledge Discovery with Retail Basket Analysis." Nelson FF
Ebecken, WIT Press [ISBN: 1853126772], 1998, pp. 193-204.
[9] L. Huang, H. Chen, X. Wang and G. Chen, “A fast algorithm for mining association rules,” J. Comput. Sci. & Technol., vol. 15, no. 6, 2000, pp. 619-624.
[10] http://www.datamining.com/pwhs.htm [Accessed: 25- Nov- 2013].
[11] K. Thearling, B. Becker, D. DeCoste, B. Mawby, M. Pilote and D. Sommerfield, “Visualizing Data Mining Models,”
Thearling.com, 2001. [Online]. Available: http://www.thearling.
com/text/dmviz/modelviz.htm. [Accessed: 18- Nov- 2013]. [12] A. Kusiak, “Data mining: manufacturing and service
applications,” International Journal of Production Research, vol. 44, no. 18-19, 2006, pp. 4175-4191.
[13] Wikipedia, “Hopfield network”. [Online]. Available: http://en.wikipedia.org/wiki/Hopfield_networks. [Accessed: 18- Nov- 2013].
[14] Hopfield, Neural networks and physical systems with emergent
collective computational abilities. 1982.
[15] M. Mitchell, An introduction to genetic algorithms. Cambridge, Mass.: MIT Press, 1996. pp. 2.
[16] L. Whitley and M. Vose, Foundations of genetic algorithms 3. San Mateo, Calif.: M. Kaufmann Publishers, 1994, pp. 66. [17] G. Boothroyd, “Development of DFMA and its impact on US
industry,” In: Proceedings of the 6th ISPE International Conference on Concurrent Engineering—Research and Applications (ISPE), Bath, UK, 1999.
[18] P. Leaney, A. Abdul-Shukor, “ A case study in the DFA evaluation methods of Hitachi, Lucas and Boothroyd Dewhurst,”
Proc. Inter. Conf. forDFMA, Boothroyd Dewhurst Inc, 1993.
[19] M. Sealy, and S. Corns, "Lucas Design for Assembly method applied at Hawker Siddeley Switchgear." Team Based
Techniques esign to Manufacture, IEE Seminar on. IET, 1992.
[20] E. Mendelson, P. Halmos and P. Suppes, “Naive Set Theory.,”
The Journal of Philosophy, vol. 57, no. 15, 1960, pp. 512.
[21] [21] P. Brunet, C. Hoffmann and D. Roller, CAD tools and
algorithms for product design. Berlin: Springer, 2000.
AUTHOR’S PROFILE
Neda Mostafavi
M.Sc., Department of Computer and IT Engineering, Shiraz University, Iran
E-mail: [email protected]
Nozar Seifoori
M.Sc., Department of Computer and IT Engineering, Shiraz University, Iran
E-mail: [email protected]
Gholam Hosein Khalaf
Ph.D., Assistant professor, Department of Mechanical Engineering, Islamic Azad University, Shiraz, Iran