Open Access
Research article
Regression toward the mean – a detection method for unknown
population mean based on Mee and Chua's algorithm
Thomas Ostermann
1, Stefan N Willich
2and Rainer Lüdtke*
2,3Address: 1Department of Medical Theory and Complementary Medicine, University of Witten/Herdecke, Gerhard-Kienle-Weg 4, 58313 Herdecke,
Germany, 2Institute of Social Medicine, Epidemiology, and Health Economics, Charité University Medical Center, Berlin, Germany and 3Karl and
Veronica Carstens Foundation, Am Deimelsberg 36, 45276 Essen, Germany
Email: Thomas Ostermann - [email protected]; Stefan N Willich - [email protected]; Rainer Lüdtke* - [email protected] * Corresponding author
Abstract
Background: Regression to the mean (RTM) occurs in situations of repeated measurements when extreme values are followed by measurements in the same subjects that are closer to the mean of the basic population. In uncontrolled studies such changes are likely to be interpreted as a real treatment effect.
Methods: Several statistical approaches have been developed to analyse such situations, including the algorithm of Mee and Chua which assumes a known population mean μ. We extend this approach to a situation where μis unknown and suggest to vary it systematically over a range of reasonable values. Using differential calculus we provide formulas to estimate the range of μwhere treatment effects are likely to occur when RTM is present.
Results: We successfully applied our method to three real world examples denoting situations when (a) no treatment effect can be confirmed regardless which μis true, (b) when a treatment effect must be assumed independent from the true μ and (c) in the appraisal of results of uncontrolled studies.
Conclusion: Our method can be used to separate the wheat from the chaff in situations, when one has to interpret the results of uncontrolled studies. In meta-analysis, health-technology reports or systematic reviews this approach may be helpful to clarify the evidence given from uncontrolled observational studies.
Background
Regression to the mean (RTM) first described by Galton [1] is a statistical phenomenon broadly discussed when it comes to measure changes in the course of time. It occurs in situations of repeated measurements when extremely large or small values are followed by measurements in the same subjects that on average are closer to the mean of the basic population. Such changes are likely to be interpreted as a real drift, although they just might be artificial coming
from the fact that the sampling of values was not random but selected.
RTM affects all fields of life science, when effects of an intervention have to be evaluated in an uncontrolled lon-gitudinal setting. Medical rehabilitation programmes for example, often are evaluated for their ability to restore the patient's ability to work. Unaware of RTM effects a patient's recovery typically is interpreted as a treatment Published: 7 August 2008
BMC Medical Research Methodology 2008, 8:52 doi:10.1186/1471-2288-8-52
Received: 25 January 2008 Accepted: 7 August 2008
This article is available from: http://www.biomedcentral.com/1471-2288/8/52
© 2008 Ostermann et al; licensee BioMed Central Ltd.
effect [2]. Other examples include the evaluation of asthma disease management programmes [3] or choles-terol screening [4].
The discussion about the development of methods to detect RTM in observational studies is still vital [5]. This is especially true for the results of complementary therapies, which are often claimed to be a mixture of RTM effects, non-specific (placebo) effects, the effects of a previous or concomitant conventional treatment and the actual effec-tiveness of the complementary treatment [6,7].
In the last two decades several methods for detecting RTM have been developed both for the case of normal distrib-uted data [8,9] as well as for the non-parametric case [10,11]. Most of these methods deal with common situa-tions of truncated sampling, i.e. only those members which have a first measurement beyond (or below) a pre-defined cut-point are sampled. The approach we focus on in this paper is a straightforward method developed by Mee and Chua [12] based on classical t-test statistics and a linear regression model. This method does not depend on truncated sampling but requires the knowledge of the true mean μin the target population. If μcan be obtained, this approach has already been proven to distinguish between RTM-effects and treatment effects in clinical study reality [13,14]. However, the basic necessity of a population mean is quite obstructive and often such a value can not be determined. In this paper, we therefore revisit the approach of Mee and Chua and extend it to a situation where no population mean is available but evi-dence for or against a treatment effect is needed when RTM is present.
Notations
In the following we consider two measurements of one quality (e.g. physiological parameters like blood pressure, or quality of life scores): The random variables Y1 (Y2) denote these values/scores before (after) an intervention. Realisations of Y1 and Y2 are denoted as y1 and y2. We assume that both measurements follow a bivariate nor-mal distribution with means μ1 and μ2, a common vari-ance σ12 = σ
22 = σ2 and a correlation ρ. In the case of no
change in distributions between the two repeated meas-urements (i.e. there is a common mean μ= μ1 = μ2 for Y1 and Y2) the conditional expectation of Y2, given Y1 = y1, can be easily calculated as
E(Y2|Y1 = Y1) = μ+ ρ(Y1 - μ) (1)
Equation (1) describes the RTM effect mathematically: if Y1 is large (Y1 > μ) then Y2 is expected to be smaller (if only 0 ≤ρ< 1), and if Y1 is smaller than the mean then Y2 is
expected to be larger. In both cases Y2 is expected closer than Y1 to the mean.
Mee and Chua exploited equation (1) to construct a test which allows to differentiate between the RTM effect and an intervention effect τ. In detail, they rewrote (1) as a regression equation and introduced τas acting additively to the RTM effect:
Y2 = μ+ τ+ ρ(Y1 - μ) + ε (2)
where εis a normally distributed random error.
Note that equation (2) extends the original model: ρnow denotes not a correlation but is interpreted as a slope where |ρ| > 1 is allowed.
Mee and Chua's test involves regressing the outcome val-ues Y2 after therapy on X = Y1-μ, where μis assumed to be fixed and known. By applying simple linear regression techniques the intercept β0 = μ+τand the slope ρare
esti-mated. Subsequently, using t-test statistics the hypothesis is tested that the intervention has an additive benefit, i.e. H0: β0 = μis tested against H1: β0 = μ+ τwith τ≠ 0. Using
Mee and Chuas notations the single steps of their algo-rithm are as follows:
1. Calculate X = Y1-μ
2. Estimate the parameters β0 and ρfrom the linear regres-sion model of Y2 on X
3. Estimate the treatment effect by subtracting μfrom
, the estimate of β0
4. Calculate the test-statistic
where s2 is the mean squared error in the simple
regres-sion analysis of variance, Xi denotes the value of X in the
i-th patient, i = 1,..., n, and is the mean of all Xi.
5. Compare t with the appropriate t-distribution with (n-2) degrees of freedom to obtain a p-value p = p(μ).
This procedure is equivalent to a linear regression analysis of Y2-μon Y1-μ. In this model equation (3) describes the test whether the intercept differs from null (H0: τ = 0), which can be carried out by most statistical standard soft-ware.
ˆ τ ˆ
β0
t t
s
n X Xi X
i n
= =
(
−)
+
(
−)
= ∑ ⎛
⎝
⎜⎜ ⎞⎠⎟⎟
( )μ
β0 μ
2 1 2 2
1
(3)
The calculations of the test statistic t(μ) may be even more simple if one rewrites equation (3) in terms of simple
sta-tistics, such as the sample means and , the sample
variances and , the correlation of Y1 and Y2,
or their respective covariance .
A simple extension of Mee and Chua's test
Mee and Chua's test can be extended to overcome the lim-itation that the population mean μmust be assumed to be known. In the case of unknown μ, we suggest to vary μ sys-tematically over a range of reasonable values and to per-form the above described procedure for each μseparately. Afterwards, defined statistics, such as t(μ), p(μ) or the esti-mated treatment effect (μ), can be plotted against μ which should give an overall impression how RTM affects the data.
The graph of t(μ) as defined in equation (4) can be ana-lysed in some more detail. First, after standard calcula-tions it can be seen that t(μ) converges to a fixed value when μapproaches infinity:
Moreover, assuming that ≠ , differentiation with respect to μshows that t(μ) has only one extremum text = t(μext) which can be found at
If = , t(μ) is strictly monotone and no extremum can be found at all. If < substituting μext into equation
(4) yields equation (7) which can be shown to define a maximum tmax:
If > μext defines a minimum with tmin = -tmax in (7).
For large n equations (6) and (7) simplify into
In most situations it will turn out that p(μext) falls below
the predefined significance level α. Then immediately the question arises for which μ's this is also true, i.e. for which region of μa significant treatment effect can be expected. Setting t(μ*) = tn-2;1-α/2 (the 1-α/2-quantile of a t-distribu-tion with n-2 degrees of freedom) this leads to a quadratic equation in μ* which can be solved by conventional tech-niques yielding solutions and . As these formulas are somewhat lengthy we refrain from reporting them here.
For the following assume that there exist solutions
and , i.e. there is at least one μwhich yields to a signif-icant treatment effect. In this case it can be seen from the formulas mentioned above that each μoutside the inter-val [ ; ] leads to a significant treatment effect, if and only if
This is usually true for large n. If n is small equation (8)
holds if is small, or is considerably larger than
. Otherwise, all μinside this interval lead to a signifi-cant treatment effect if and only if equation (8) does not hold.
All equations presented only depend on the number of subjects n and simple sample statistics. It is therefore easy to encode them in standard software programs which we have done for MS-EXCEL ® and SAS ®. The implementation
in SAS is solved as a macro (see Additional file 1). It is meant for situations when individualised data is
availa-Y1 Y2
sY 1
2 s
Y2
2 r
Y Y1 2 sY Y
1 2
t n n
sY Y sY Y Y sY Y sY
sY sY sY Y
( ) ( )
( )
μ = − − + − μ
− ⎛
⎝⎜ ⎞
2 1
2
2 1 2 1 1 2 21
1 2 2 2 1 2 2
⎠⎠⎟⎛⎝⎜(n−1)s2Y1+n Y( 1−μ)2⎠⎟⎞
(4)
ˆ τ
t n sY Y
sY sY sY sY Y
n sY
sY rY
( )
(
μ ⎯⎯⎯⎯μ→±∞→ − −
− = ± −
−
∓ 2 1 2 1
2 1 2 2 2 1 2 2 2 1
2 1YY
rY Y
2 1 1 2 2 ) − (5)
Y1 Y2
μext Y n
n
rY Y sY sY sY
Y Y
= + − −
− 1
1 1 2 22 21 21
2 1
( )
( )
(6)
Y1 Y2
Y1 Y2
t t n s
Y rY Y
n Y Y n rY Y sY s
ext
max ( )
( ) ( ) ( ) ( )( = = − − − + − − μ 2 2 2 1 1 2 2
2 12 1 1 2 2 YY n n Y Y n rY Y sY sY
12 1 2 12 1 2 1 2 2 12
)
( −)( − ) + −( ) ( − )
(7)
Y1 Y2
μext Y ext
rY Y sY sY sY
Y Y t
n Y Y rY Y
= + −
− =
− +
1
1 2 22 21 21
2 1
2 12 1
( )
( )
( ) (
and 22 2 1
2 1 1 2 2 2 2 sY sY
rY Y sY
−
(
)
−
)
( )
μ1∗ μ
2∗
μ1∗ μ2∗
μ1∗ μ
2∗
n
sY
sY rY Y
r Y Y tn − − ⎛ ⎝ ⎜ ⎞ ⎠ ⎟
− > − −
2 1
2 1 2
1 1 2
2 2 1; α/2
(8)
rY Y1 2 sY1
2
sY 2
ble. The EXCEL solution should be considered when the sample statistics can be drawn from the paper but individ-ual data is not available. Both programs are appended to this manuscript.
Examples
We apply the method developed above to three examples. First, we look for the data given in the original work of Mee and Chuas classical approach:
Example 1
Table 1 provides the individual data originally taken from McClave and Dietrich [15]. It comprises the scores of n = 8 students who failed to pass a test to receive their high school diploma. These students were encouraged to visit a refresher course and to retake an equivalent test after-wards. As the mean (± standard deviation) test score increases from 57.4 ± 7.0 to 60.4 ± 8.1 points one might conclude that the refresher course is effective, a point of view which is supported by a paired t-test which results in a one-sided p-value of 0.0428.
On the other side, the analysed data was not drawn from the whole population but only from the lower extremes of the distribution (the students who performed worst). Thus RTM is likely to occur and should be addressed in a formal analysis. In their paper, Mee and Chua assumed a true mean of μ = 75 and calculated from equation (3) a value of t = t(75) = 1.08, which gives a one-sided p-value of p = p(75) = P(t6 > 1.08) = 0.16. They concluded that the observed changes might be attributed to RTM and an intervention effect could not be confirmed.
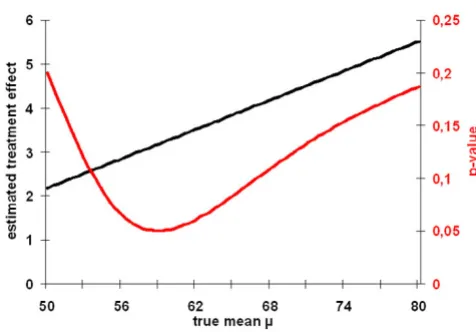
Following the approach we suggested here, one might wonder whether this result is sensitive to the assumption of μ = 75. In other words one should calculate if there would have been a chance of an intervention effect if another μ had been chosen. Fig. 1 shows the values for p(μ) based on the data given in table 1 within a range from 30 <μ < 80. From equation (4) and (5) the maxi-mum value for t is given at μmax = 58.96, with a t-value of tmax = 1.938. This finally leads to a corresponding one
sided p-value of pmin = p(μmax) = 0.0504. Hence, we can surprisingly conclude, that independent of any given μno intervention-effect can be confirmed in this group of stu-dents. Thus, the data does not support the hypothesis, that the special course to refresh the language skills is not suitable for the given student profile that failed in the first exam.
Example 2
The next example deals with homeopathy, one of the most frequently used and controversial systems of com-plementary and alternative medicine. Homeopathy is based on the 'principle of similars', whereby highly diluted preparations of substances that cause symptoms in healthy individuals are used to stimulate healing proc-esses in patients who have similar symptoms when ill.
Recently, Witt et al. [16] presented an uncontrolled cohort study which found marked beneficial health effects in nearly 3.000 chronic diseased adults when homeopathi-cally treated. Of those, 214 patients suffered from migraine. Within two years their quality of life, as meas-ured by the SF-36 physical summary score, increased from 44.3 ± 11.8 to 49.4 ± 12.3 score points. The question arises whether this increase is due to RTM or can be attrib-uted to a true intervention effect.
Fig. 2 shows that the p-values drawn from the Mee-Chua-test are far below 0.025 when the true mean is below 55 score points. Thus, in these situations a significant inter-vention effect can be confirmed. Having in mind that the true (healthy) population in Germany has a mean SF-36 physical summary score of 50.24 [17] it seems very unlikely that the true mean in our (diseased) target popu-lation is bigger than 55 points. Consequently, our
analy-Table 1: Data of a repeated language-test after a special training (Example 1).
Student Before After
1 45 49
2 52 50
3 63 70
4 68 71
5 57 53
6 55 61
7 60 62
8 59 67
Graphs for p(μ) and (μ) based on example 1 given in table 1 Figure 1
Graphs for p(μ) and (μ) based on example 1 given in table 1.
ses show unambiguously, that the observed effect in this study cannot only attributed to RTM.
Example 3
Our method can be extended for seperating the wheat from the chaff in situations, when one has to interpret the results of uncontrolled studies. For example, one might think of a simple voting when classifying the possibility of a treatment effect in "never" "unlikely", "probably" and "most likely". Especially in meta-analysis, health-technol-ogy reports or systematic reviews, this approach can be quite helpful to clarify the evidence given from observa-tional studies. This can be demonstrated in three uncon-trolled studies on Bosentan treatment for patients with pulmonary arterial hypertension (PAH). The main out-come parameter in PAH-studies is usually given by the
6-minute walk distance (6MWD) which in our chosen stud-ies was measured at baseline and after a treatment period of 16 weeks. As the correlation between the repeated measurements was not given, we ran our algorithm with three levels of correlations: high (r = 0.8), moderate (r = 0.5), and low (r = 0.2) correlation. Table 2 provides the regions of significance which are based on the intervals
[ ; ].
In most cases the region of significance is split into two parts: The upper part (μ is large) describes the region where a huge RTM effect is expected, larger than the actual difference of means, and a negative treatment effect (τ< 0) can be confirmed. For example, assuming a correlation of r = 0.5 in Provencher's trial the region of significance includes all values above 481 meters, saying that Bosentan has a significantly (p < 0.05) negative effect on the patient's 6MWD if only the true mean 6MWD is above this value in the population of interest. This part of the region is of no further interest in our example, because here we are only interested in the one-sided hypothesis whether Bosentan can increase the patient's 6MWD. In other situations however a two-sided hypothesis might be more appropriate.
The lower part of the region of significance includes values of μwhere a positive treatment effect (τ> 0) can be con-firmed. This is usually true when μis considerably smaller than the baseline mean and the RTM effect pulls the val-ues into the wrong direction. Again this region is of no fur-ther interest, because it describes a unrealistic situation. For example, in Provencher's trial the region of signifi-cance includes all values below 367 meters (assuming r = 0.5), saying that Bosentan does significantly (p < 0.05) incrase the patient's 6MWD if only the true mean 6MWD is below this value in the population of interest. But,
val-μ1∗ μ
2∗
Graphs for p(μ) and (μ) based on example 2 (Becker-Witt [16])
Figure 2
Graphs for p(μ) and (μ) based on example 2 (Becker-Witt [16]).
ˆ τ
Table 2: Regions of significance and voting for a positive treatment effect in three uncontrolled studies on Bosentan in PAH based on the approach presented in this paper
Study N 6MWD at Baseline 6MWD at week 16 correlation region of significance Vote of significance
Souza et al. 2005 [18] 15 396 ± 135 434 ± 137 r = 0.2 [0;337] & [672;∞] Unlikely r = 0.5 [0;300] Unlikely r = 0.8 - Never
Provencher et al. 2006 [19] 99 322 ± 105 364 ± 109 r = 0.2 [0;347] & [410;∞] Probably r = 0.5 [0;367] & [481;∞] Probably r = 0.8 [0;448] & [1292;∞] Most likely
Apostolopoulou et al. 2006 [20] 21 416 ± 105 459 ± 101 r = 0.2 [0;412] & [575;∞] Unlikely r = 0.5 [0;420] & [820;∞] Unlikely r = 0.8 [0;466] Probably
ues of 100 or 200 meters are exeptionally small, it is there-fore unrealistic to assume that the mean 6MWD lies in this region.
What is left, is that part of the region of significance where a positive treatment effect can be confirmed for values of
μwhich are larger than the 6MWD mean at baseline. This usually occurs when the correlation is high, RTM effects are expected to be relatively small and the actual group changes can be predominantly attributed to the treatment effect. This is true in Provencher's trial (assuming r = 0.5), where the lower part of the region of significance exceeds 322 metres, the mean baseline value in the study popula-tion.
Having this in mind, we voted a treatment effect to be "unlikely" in the study of Souza et al [18], because Mee and Chua's modified t-test fails to reach a level of signifi-cance in realistic situations. In contrast, in both other studies a treatment effect of Bosentan is probable [19] or even most likely [20], at least when correlation is high (i.e. r = 0.8).
Interestingly, in all three studies the phenomenon described in equation (8) can be studied: Whenever the correlation approaches 1 the region of significance
changes from a bipartite region to an interval [ ; ] where treatment effects can be confirmed for values within this interval but not outside. An intuitive explana-tion for this phenomenon may be the following:
a) If μis very small and the correlation r increases then the RTM effect decreases and finally is not far below the actual group difference. The estimated treatment effect is still positive but now cannot be confirmed statistically.
b) If μis very large similar arguments hold. Again the RTM effect decreases when the correlation r increases and finally is roughly in the same range as the actual group dif-ference. Consequently, a statistical confirmation of a treat-ment effect (whose estimate is still negative) fails.
c) If μlies within the range of the baseline and the follow up mean, the RTM effect is small, but very similar to the acutal group change. If r increases the RTM effect becomes even smaller and neglectable, such that all actual group change can be interpreted as a treatment effect.
Discussion
In this paper, we have developed a straight-forward method based on Mee and Chuas modified t-test to detect, whether a change in a uncontrolled repeated meas-urement-situation after an intervention in a selected pop-ulation is due to RTM or to a specific treatment effect.
RTM is a statistical phenomenom often ignored, misun-derstood or insufficiently appreciated and thus one of the the most fundamental sources of error in human reason-ing in almost all scientific disciplines [21].
Since its first description from Galton in 1886 [1] RTM has been discussed by a variety of authors (a historical outline is given by Stigler [22]). Thorndike [23] to our knowledge was the first who developed mathematical formulas this problem based on a known population mean and nor-mally distributed data. Almost at the same time Kelley [24] gave a theoretical framework known in classical test theory as Kelley's equation (see [21] for a deduction of this equation). Cohen [25] was the first who described the selection process in more detail. He distinguished between four kinds of sample in connection with bivari-ate nomal distributions: truncbivari-ated, censored, selected, and complete samples. Based on his work Senn and Brown [26] derived maximum likelihood equations to estimate the RTM and the treatment effect. Das and Mulder [27] first left the assumption that the true under-lying random variable Y1 is normally distributed and con-sidered arbitrary (usually unimodal) continuous distributions. Their work still relied on the assumption of normally distributed measurement errors, which was renounced by Müller et al [11].
Unlike all of the above mentioned approaches our method does not need any information about the selec-tion process. It therefore can also be used, if only the results of an intervention process are given, which unfor-tunately quite often occurs in papers presenting uncon-trolled observational studies.
In contrast, when the selection process can be specified Mee and Chuas modified t-test (and hence our extension) generally has a low power, especially whenever all values of Y1 in the sample are in one extreme [12]. Assuming truncated sampling George et al. [28] contrasted the per-formance of the modified t-test with likelihood based alternatives. In their simulation studies the likelihood ratio-test appeared to be more powerful than the score test or the modified t-test.
The statistical model we propose here is based on the assumption that the population is in a steady state where the variance does not change in time and the correlation
ρ is constant over the whole range of values. These are usual assumptions made in the literature on RTM which seem to be realistic in medical applications when the time between both observations is relatively small (see e.g. [26,29]). This has been doubted by Ragosa [30] who pointed out that the assumption of equal variances is essential in the discussion of RTM. If it does not hold and the variances increase over time then the conditional μ1∗ μ
2
expectation of Y2, given Y1 = y1, is farther away from μ than Y1, so that regression indeed is "from the mean" not "to the mean" Ragosa thus called RTM a myth based on a mathematical tautology without any meaning in practice. In our examples, however, we found no hints, that the assumption of constant variances might be violated, the respective empirical estimates were quite similar in all cases.
Although applicable to a wide range of observational studies our approach has four major limitations. The first is a very practical one: our calculations require an estimate
of the correlation (or, alternatively, the covariance) between the baseline and the follow-up values, a number which is rarely given in papers. Imputing a plausible fixed
value for does not seem to be an adequate solution as the results extremely depend on its exact value as can be seen in example 3. Consequently, for most studies the original individual data for each person is needed.
Second, the interpretation of the graph p(μ) is limited as the reported p-values are not adjusted for multiple testing. Thus, the technique proposed is a exploratory data ana-lytic strategy and should not be taken as proof of a treat-ment effect.
Third, in practical situations it might happen that , the estimator of ρ, is larger than 1. Indeed, in example 1 we found = 1.111 for all μwhch is an indicator that the model was misspecified and that some subgroups of the whole population gain more from the treatment than others (those with average baseline values). Mee and Chua [12] already pointed that this leads to an overesti-mation of the treatment effect for each fixed μ. Conse-quently, the respective test is anticonservative. As a result p(μ) will fall too often below the predefined level of sig-nificance and the region of μ's showing a significant treat-ment effect will be too broad. For a more detailled discussion on how misclassification affects the modified t-test see [12].
Fourth, our approach is restricted to treatment effects which work additive on the mean. In contrast to this assumption, several complementary and alternative ther-apies are based on the therapeutic principle of "functional normalisation", i.e. they claim to actively exploit the self regulative capacities of the organism. In this sense, these approaches are assumed to have the potential not to shift a mean but to decrease high values and to increase low values to "normal" values, e.g. of blood pressure [31] or
cardio-respiratory coordination [32]. This corresponds to a multiplicatively working treatment effect, a model first proposed by James [33] and extensively discussed by Senn and Brown [26,34], Chen and Cox [35], and Naranjo and McKean [36]. Again, it is difficult to distinguish such a treatment effect from RTM especially when data is col-lected selectively, for examples from the tails of a given distribution. This dilemma is quite illustrative in the example of Gutenbruner and Ruppel [31], redrawn in Fig. 3.
Here, the authors attribute the observed changes to an active process of the organism. However, building sub-groups is a selection process by itself [37]. Thus RTM is likely to be present in this example. Consequently, one has to be aware, that also in situations where functional normalisation is assumed, RTM cannot be ignored. Our own simulation studies showed, that there is a high prob-ability of erratiously deciding for normalisation when extreme values are more likely to be sampled. For exam-ple, if the correlation coefficient for repeated measure-ments is taken as 0.7 this error probability increases from more than 10% for a sample size of n = 20 to 55% for a sample size of n = 100 [38].
A multiplicative model of treatment effects also might help to solve Rogosa's problem when he considered pop-ulations which are not in a steady-state (see above). As the presence of a multiplicative factor alters the (uncondi-tional) variance [26], unsteadiness can be interpreted as a treatment effect which pushes the second measurement values proportionally closer (or farther) to the mean according to the distance of first measurement values.
What we found to be evident from a broad variety of research papers is that the discussion of RTM affects all rY Y1 2
rY Y1 2
rY Y1 2
rY Y1 2
Redrawing of the blood pressure curves of Gutenbrunner and Ruppel [31]
Figure 3
fields of life and behavioral sciences. Thus we were quite surprised, that methods to adjust for RTM are not very popular in medical data analysis. This is even more afflict-ing, if it is taken into account that especially in comple-mentary medicine the discussion on appropriateness of study designs is quite vital. We would therefore like to encourage researchers to use methods like the one pre-sented here (additional file 2) for the evaluation of uncontrolled studies to raise their methodological qual-ity.
Competing interests
The authors declare that they have no competing interests.
Authors' contributions
TO wrote the initial draft of the manuscript. TO and RL calculated all mathematical elaborations. RL was respon-sible for all statistical algorithms and analyses of the examples. SNW was the guarantor of the project and inter-preted the data from a medical point of view. All authors contributed to interpretation of the data and the critical revision of the manuscript, read and approved the final manuscript.
Additional material
Acknowledgements
We thank C. Witt, Charité Berlin, for providing the data of example 2.
References
1. Galton F: Regression towards mediocrity in hereditary stat-ure. Journal of the Anthropological Institute 1886, 15:246-263. 2. Zwingmann C, Wirtz M: Regression zur Mitte. Rehabilitation 2005,
44:244-251.
3. Tinkelman D, Wilson S: Asthma disease management: regres-sion to the mean or better? Am J Manag Care 2004,
10(12):948-954.
4. Bankhead CR, Brett J, Bukach C, Webster P, Stewart-Brown S, Munafo M, Austoker J: The impact of screening on future health-promoting behaviours and health beliefs: a system-atic review. Health Technol Assess 2003, 7(42):1-92.
5. Grimes DA, Schulz KF: Cohort studies: marching towards out-comes. The Lancet 2002, 359:341-345.
6. van Haselen RA: Research on complementary medicine in rheumatic diseases: the need for better quality studies and reproduction of claimed positive results. Rheumatology (Oxford)
1999, 38(5):387-390.
7. Lüdtke R, Ostermann T, Witt C: How to deal with regression to the mean in homeopathic outcome studies. FACT 2005. 8. Johnson WD, George VT: Effect of regression to the mean in
the presence of within-subject variability. Stat Med 1991,
10(8):1295-1302.
9. Lin H, Hughes M: Adjusting for regression toward the mean when variables are normally distributed. Statistical Methods in Medical Research 1997, 6:129-146.
10. Chesher A: Non-normal variation and regression to the mean. Stat Methods Med Res 1997, 6(2):147-166.
11. Müller HG, Abramson I, Azari R: Nonparametric regression to the mean. Proc Natl Acad Sci U S A 2003, 100(17):9715-9720. 12. Mee RT, Chua TC: Regression Toward the Mean and the
Paired Sample t Test. Am Statistician 1991, 45(1):39-42. 13. Ostermann T, Blaser G, Bertram M, Michalsen A, Matthiessen PF,
Kraft K: Effects of rhythmic embrocation therapy with solum oil in chronic pain patients: a prospective observational study. Clin J Pain 2008, 24(3):237-243.
14. Ferrara A, Barrett-Connor E, Shan J: Total, LDL, and HDL choles-terol decrease with age in older men and women. The Ran-cho Bernardo Study 1984-1994. Circulation 1997, 96(1):37-43. 15. McClave JT, Dietrich FH: Statistics. New York , Dellen Publishing;
1988.
16. Witt CM, Ludtke R, Baur R, Willich SN: Homeopathic medical practice: long-term results of a cohort study with 3981 patients. BMC Public Health 2005, 5:115.
17. Bullinger M, Kirchberger I: SF-36 Fragebogen zum Gesundheit-szustand - Handanweisung. Göttingen , Hogrefe-Verlag ; 1998. 18. Souza R, Jardim C, Martins B, Cortopassi F, Yaksic M, Rabelo R,
Bog-ossian H: Effect of bosentan treatment on surrogate markers in pulmonary arterial hypertension. Curr Med Res Opin 2005,
21(6):907-911.
19. Apostolopoulou SC, Manginas A, Cokkinos DV, Rammos S: Effect of the oral endothelin antagonist bosentan on the clinical, exer-cise, and haemodynamic status of patients with pulmonary arterial hypertension related to congenital heart disease. Heart 2005, 91:1447-1452.
20. Provencher S, Sitbon O, Humbert M, Cabrol S, Jaïs X, Simonneau G:
Long-term outcome with first-line bosentan therapy in idio-pathic pulmonary arterial hypertension. Eur Heart J 2006,
27(5):589-595.
21. Smith G, Smith J: Regression to the Mean in Average Test Scores. Educational Assessment 2005, 10(4):377-399.
22. Stigler SM: Regression towards the mean, historically consid-ered. Stat Meth Med Res 1997, 6(2):103-114.
23. Thorndike RL: Regression fallacies in the matched groups experiment. Psychometrika 1942, 7(2):85-102.
24. Kelley TL: Fundamentals of statistics. Cambridge MA , Harvard University; 1947.
25. Cohen C: Restriction and Selection in Samples from Bivariate Normal Distributions . J Amer Statist Ass 1955, 50:884-893. 26. Senn S, Brown R: Maximum Likelihood Estimation of
Treat-ment Effects for Samples Subject to Regression to the Mean. Commun Statist Theory Meth 1989, 18(9):3389-3406.
27. Das P, Mulder PGH: Regression to the Mode. Statistica Neerlandica
1983, 37:15-20.
28. George V, Johnson WD, Shahane A, Nick TG: Testing for Treat-ment Effect in the Presence of Regression Toward the Mean. Biometrics 1997, 53:49-59.
29. Barnett AG, van der Pols JC, Dobson AJ: Regression to the mean: what it is and how to deal with it. Int J Epidemiol 2005,
34(1):215-220.
Additional file 1
SAS-Macro for the extended Mee-Chua t-test. This macro is written in SAS code and calculates all statistics given in our paper based on individ-ual raw data in a repeated measurement situation and also gives a graph-ical display of the test statistics. It was developed and tested under SAS version 9.1, although we believe it should give valid results in earlier releases. To run this macro it is necessary to have subscribed to the SAS modules BASE, STAT and SQL. Details how to run the macro can be found when opening the program code in an appropriate text editor.
Click here for file
[http://www.biomedcentral.com/content/supplementary/1471-2288-8-52-S1.sas]
Additional file 2
MS-EXCEL sheet for the extended Mee-Chua t-test. This is an EXCEL 2000 sheet which calculates all statistics given in our paper based on means, standard deviations, and correlations in repeated measurement situations. Moreover, it provides a graphical display of the test statistics.
Click here for file
Publish with BioMed Central and every scientist can read your work free of charge
"BioMed Central will be the most significant development for disseminating the results of biomedical researc h in our lifetime."
Sir Paul Nurse, Cancer Research UK
Your research papers will be:
available free of charge to the entire biomedical community peer reviewed and published immediately upon acceptance cited in PubMed and archived on PubMed Central yours — you keep the copyright
Submit your manuscript here:
http://www.biomedcentral.com/info/publishing_adv.asp
BioMedcentral 30. Ragosa D: Myths about longitudinal research. In The analysis of
change Edited by: Gottman JM. Mahwa NJ , Lawrence Erlbaum Ass; 1995:3-66.
31. Gutenbrunner C, Ruppel K: Zur Frage der adaptiven Blutdruc-knormalisierung im Verlauf von komplexen Bäderkuren unter besonderer Berücksichtigung von Homogenisierung-seffekten und Lebensalter. Phys Rehab Kur Med 1992, 2:58-64. 32. Cysarz D, Heckmann C, Bettermann H, Kümmell HC: Effects of an
anthroposophical remedy on cardiorespiratory regulation. Altern Ther Health Med 2002 , 8(6):78-83.
33. James KE: Regression toward the mean in uncontrolled clini-cal studies. Biometrics 1973, 29:121-130.
34. Senn SJ, Brown RA: Estimating treatment effects in clinical tri-als subject to regression to the mean. Biometrics 1985,
41(2):555-560.
35. Chen S, Cox C: Use of baseline data for estimation of treat-ment effects in the presence of regression to the mean. Bio-metrics 1992, 48(2):593-598.
36. Naranjo JD, McKean JW: Adjusting for Regression Effect in Uncontrolled Studies. Biometrics 2001, 57:178-181.
37. Senn S: Regression to the mean. Stat Meth Med Res 1997,
6(2):99-183.
38. Lüdtke R, Ostermann T: Regression zur Mitte - ein Thema in der Krebsforschung? Deutsche Zeitschrift für Onkologie 2005,
37:169-175.
Pre-publication history
The pre-publication history for this paper can be accessed here:
![Figure 2[16])Graphs for p(μ) and (μ) based on example 2 (Becker-Witt](https://thumb-us.123doks.com/thumbv2/123dok_us/9225298.1917665/5.612.58.555.562.710/figure-graphs-m-m-based-example-becker-witt.webp)
