SYSTEMATIC MAP
A systematic map of evidence
on the contribution of forests to poverty
alleviation
Samantha H. Cheng
1,2*, Kavita MacLeod
3, Sofia Ahlroth
3, Stefanie Onder
4, Emilie Perge
3, Priya Shyamsundar
5,
Pushpendra Rana
6, Ruth Garside
7, Patti Kristjanson
3, Madeleine C. McKinnon
8and Daniel C. Miller
6Abstract
Background: Forests provide an essential resource to the livelihoods of an estimated 20% of the global population. The contribution of forest ecosystems and forest-based resources to poverty reduction is increasingly emphasized in international policy discourse and conservation and development investments. However, evidence measuring the effect of forest-based activities on poverty outcomes remains scattered and unclear. Lack of systematic understanding of forest-poverty relationships, in turn, inhibits research, policymaking, and efficient financial resource allocation.
Methods: To identify relevant studies for inclusion in this systematic map we searched six bibliographic databases, 15 organizational websites, eight systematic evidence syntheses (reviews and maps), and solicited information from key informants. Search results were screened for relevance against predefined inclusion criteria at title, abstract, and full text levels, according to a published protocol. Included articles were coded using a predefined framework. Trends in the evidence, knowledge gaps and relatively well-researched sub-topics are reported in a narrative synthesis. Occur-rence and extent of existing evidence about links between interventions and outcomes are presented in a visual heatmap. Data are available through the open access Evidence for Nature and People Data Portal (http://www.natur eandp eople evide nce.org).
Results: A total of 242 articles were included in the systematic map database. Included articles measured effects of 14 forest-based intervention types on 11 poverty dimensions. The majority of the evidence base (72%) examined links between productivity-enhancement strategies (e.g. forest management, agroforestry, and habitat management) and monetary income and/or social capital outcomes. Other areas with high occurrence of articles include link-ages between interventions involving governance, individual rights/empowerment or linked enterprises/livelihood alternatives with impacts on monetary income from direct sale of goods. A key knowledge gap was on the impacts of investment-based interventions (i.e. enhancing produced, human, and social capitals). Another was the impacts of forest-based interventions on financial capital (savings, debt), non-monetary benefits, and health.
Conclusions: The evidence base on forest-based productive activities and poverty alleviation is growing but displays a number of biases in the distribution of articles on key linkages. Priorities for future systematic reviews and evalua-tions include in-depth examinaevalua-tions into the impacts of rights-based activities (e.g. governance, empowerment) on poverty dimensions; and productivity-enhancing activities on social capital. More comprehensive and robust evi-dence is needed to better understand the synergies and trade-offs among the different objectives of forest conserva-tion and management and variaconserva-tion in outcomes for different social groups in different social-ecological contexts.
Keywords: Forestry, Forest Governance, Livelihoods, Co-management, Ecosystem services, Tenure rights
© The Author(s) 2019. This article is distributed under the terms of the Creative Commons Attribution 4.0 International License (http://creat iveco mmons .org/licen ses/by/4.0/), which permits unrestricted use, distribution, and reproduction in any medium, provided you give appropriate credit to the original author(s) and the source, provide a link to the Creative Commons license, and indicate if changes were made. The Creative Commons Public Domain Dedication waiver (http://creat iveco mmons .org/ publi cdoma in/zero/1.0/) applies to the data made available in this article, unless otherwise stated.
Open Access
*Correspondence: [email protected]
1 Center for Biodiversity Outcomes, Arizona State University, Tempe, AZ,
USA
Background
Forests comprise a key natural resource to help reduce poverty and advance other UN Sustainable
Develop-ment Goals [1, 2]. International investment in forest
conservation and management increased markedly
beginning in the early 1990s [3, 4], with major funding
directed toward sustainable forest management [5], and
reducing emissions from deforestation and forest
deg-radation (REDD+) projects [6], among other efforts.
Given the importance of poverty alleviation for national governments and many international organizations, forest-related economic investments have also sought to contribute to this goal. It is estimated that approxi-mately 20% of the global population (~ 1.3 billion) relies on forests and forest products to support some portion of their livelihoods, from sources of income and
build-ing materials to primary supply of food and water [7,
8]. A large proportion of the population living in or
near forests in low-income countries remains below the
poverty line [9]. Large donors such as the World Bank
Group are now explicitly supporting forest-based pov-erty alleviation strategies through investment lending operations, technical assistance, and analytical work [10].
While the link between forest resources and poverty is explicitly stated in numerous declarations, mission statements, and strategies, the nature of the relation-ships between ecosystems and poverty is complex with linkages and mechanisms connecting them not clearly
defined [11–13]. In part, the multi-dimensionality of
poverty poses a significant challenge for policy devel-opment and implementation. Poverty can be defined as the deprivation of well-being related to lack of material income or consumption, low levels of education and health, vulnerability and exposure to risk, lack of agency,
and powerlessness [8]. Thus, alleviating poverty through
environmental improvement will require clear hypothe-ses about how these different aspects of poverty respond, both individually and synergistically, to dynamic environ-mental and socio-economic factors, including ecosystem health, ecosystem service delivery, livelihood diversifica-tion, governance and access rights [14, 15].
Existing research shows that forests provide an essential contribution to the livelihoods of both rural and urban communities [8, 10, 16, 17]. Forests can be assessed according to three different roles in relation to poverty alleviation: (1) by offering subsistence, through incomes and consumption, (2) as a “safety net” to prevent people from sliding into or further into poverty and (3) as
a pathway out of poverty [16–19]. Estimates of
depend-ence on forests vary, with studies suggesting that forests may contribute from a fifth, to more than a quarter of
incomes among households living near forests [17]. The
level of dependence on forest income varies based on regional, governance and ecological factors [14, 20].
Beyond income, forests can provide ecosystem services such as clean waterways, sustenance, recreation, and cul-turally important sites that can benefit society through promoting improved human health, physical security, empowerment, cultural integrity, individual
happi-ness and social relations [21]. However, utilizing forest
resources to alleviate poverty also promotes increased use of limited resources, raising concerns over trade-offs between conserving ecosystems and achieving improved human well-being [12, 22, 23]. Careful consideration of how to negotiate such trade-offs is needed. However, relatively little is known about how forests can serve as a pathway out of poverty let alone to more widespread prosperity through sustainable income streams and
other means [23]. New holistic frameworks, such as the
PRIME [24] are now available to help conceptualize and
analyze forest contributions to poverty reduction. PRIME describes how a forest landscapes approach is needed to understand the pathways through which forests con-tribute to poverty reduction outcomes. It illustrates five primary pathways—productivity, rights, investments, markets, and ecosystem services—and is being applied by World Bank Group forest project development teams in several countries. However, understanding when and where these pathways are best suited (whether individu-ally or synergisticindividu-ally) to achieve improved poverty will require evidence derived from empirical evaluation of impacts.
Several syntheses documenting empirical evidence on the relationships between forests and poverty are avail-able, but they have remained limited in scope, focusing on one type of forest intervention and/or a single
dimen-sion of poverty [25–28]. Two evidence gap maps recently
examined the impact of forest conservation [29] and land
use change [30] on environmental and socio-economic
outcomes, including poverty within a subset of forest types. While these efforts to characterize evidence on the linkages between forests and poverty are encourag-ing, they are still limited in geographic scope (concern-ing low- and middle-income countries only), and range of interventions (including only policies and programs or conservation actions) examined.
globally, identify gaps in the knowledge base, and com-municate results to researchers and decision-makers. Clarifying and strengthening knowledge on the contribu-tion of forests to poverty reduccontribu-tion is vital for informing forest-related policy, research and investment affecting forest ecosystems in countries around the world.
Objective of the review
The primary research questions this study addresses are:
What evidence exists for the role of forests in contributing to poverty alleviation? What are some critical gaps in the available evidence?
This question was scoped and set by the review team, including individuals from the World Bank’s Program on Forests who commissioned this systematic map. The scope of the question was then discussed by a larger group of experts from this field including those in research and in conservation and development practice, to ensure that the question reflected the broad needs of the sector.
The evidence base resulting from these parameters ena-ble us to answer the following set of secondary research questions:
• What is the distribution of the evidence base in terms of overall quantity of articles, study design types, interventions examined, outcomes measured, governance regimes, ecoregions, and geographical locations?
• What types of forest-based programs have been stud-ied and how much evidence is there from different types of research?
• What indicators are commonly used as measures of poverty in this area of research?
• What are the major gaps in the evidence base that represent research priorities?
• What are promising areas for future synthesis?
We answer these questions by creating a systematic evidence map based on the following parameters:
• Population: Discrete human populations living within or near forested or formerly forested areas from all nations.
• Intervention: Forest-based productive activities (see Table 1).
• Comparator: Temporal (before/after, continuous time series, interrupted times series), spatial (dis-tance), or between groups (control/intervention, socioeconomic, gender, racial/ethnic).
• Outcome: Measures of poverty in terms of forest-based income, consumption, capitals and assets (see Table 1).
• Study type: Experimental, quasi-experimental, non-experimental, systematic reviews and maps, evidence gap maps.
Given the scope of the systematic map, we did not attempt any critical appraisal of individual studies, nor did we try to quantify or validate direction of impact for poverty outcomes examined. Rather, this map is intended to provide insight on potential knowledge gaps and biases. Moreover, while many other syntheses on this topic area have aimed to examine the occurrence of trade-offs and synergies between poverty and other
eco-nomic or environmental outcomes (e.g. [30]), the scope
of this map does not explicitly examine these interactions as we are not examining direction of impact.
Methods
This systematic mapping process was undertaken as part of an initiative led by the World Bank’s Program on For-ests (PROFOR), which seeks to build knowledge on the contribution of forests to poverty reduction, sustainable economic development, and protection of global and local environmental services so as to inform program-matic activity by the World Bank and other actors in the forest sector. The protocol for this systematic map was scoped, discussed and drafted over multiple meetings between the project authors, comprised of evidence syn-thesis experts, and PROFOR experts. The original
pro-tocol was published in May 2017 [31] and this section
contains updates undertaken since. In summary, updates include:
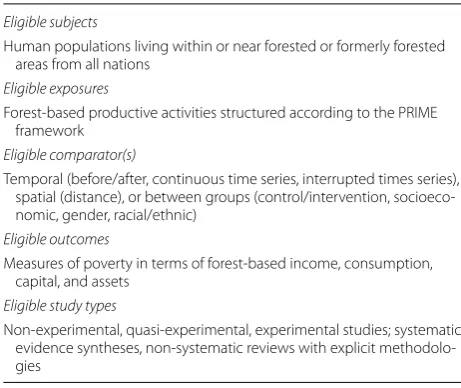
Table 1 Eligibility criteria
Eligible subjects
Human populations living within or near forested or formerly forested areas from all nations
Eligible exposures
Forest-based productive activities structured according to the PRIME framework
Eligible comparator(s)
Temporal (before/after, continuous time series, interrupted times series), spatial (distance), or between groups (control/intervention, socioeco-nomic, gender, racial/ethnic)
Eligible outcomes
Measures of poverty in terms of forest-based income, consumption, capital, and assets
Eligible study types
• Kappa statistics were not calculated between review-ers, but disagreements in coding between a team of three reviewers were discussed and reconciled with the broader research team during the training phase. • An additional data field on presence/use of a
concep-tual model/framework to frame study, shape meth-ods, and/or analyse findings was added to the data coding strategy.
Search for articles
Multiple online information sources, relating to pub-lished and unpubpub-lished reports, were searched in order to capture a comprehensive and unbiased sample of lit-erature. In total, six publication databases, 15 institu-tional and organizainstitu-tional websites, and the bibliographies of eight systematic evidence syntheses were searched between October 2016 and March 2017.
Search terms and languages
Given the multiplicity of disciplines at the intersection of forest and poverty research, substantial terminologi-cal diversity regarding actions and outcomes is likely to exist. In order to maximize comprehensiveness of our search to capture the breadth of ontologies, the search string was co-designed and tested by an interdisciplinary review team from different disciplinary backgrounds (e.g. economics, social science, natural science) and sectors (e.g. conservation, development, non-profit, academic). Comprehensiveness was checked by how many arti-cles were recovered from the test library (19 out of 25). Search terms were limited to English language due to project resource restrictions. The following search string was used to query online publication databases, organi-zational websites, and internet search engines.
Intervention terms “REDD+” OR “REDD” OR “Reduced
emissions from deforestation and degradation” OR “FLEGT” OR “forest management” OR “forestry” OR “CBNRM” OR “community-based natural resource manag*” OR “resource manag*” OR “conservation agree- ment” OR “national park” OR “biosphere reserve” OR “nature reserve” OR “conservation area” OR “extrac-tive reserve” OR “afforest*” OR “reforest*” OR “NTFP*” OR “non-timber forest product” OR “non timber forest product*” OR “silvicultur*” OR “silvi-cultur*” OR “PES” OR “payment for ecosystem services” OR “incentive*” OR “tenure*”
AND
Adjacent to “forest*” OR “woodland*” OR “agroforest*” OR “silvopast*” OR “coffee” OR “charcoal”
AND
Adjacent to “voluntary” OR “participatory” OR “col-lective” OR “public” OR “private” OR “commercial” OR “sustainable” OR “illegal” OR “community”
AND
Outcome terms “poverty” OR “income” OR “empower*” OR “job*” OR “livelihood*” OR “security” OR “attitude*”
OR “capital” OR “traditional knowledge” OR “TEK”1 or
“*equity”
Searches
This systematic map builds from a previous system-atic map on linkages between conservation and human
well-being [32]. Given the expanded scope of this map,
our search strategy was conducted in stages to first take advantage of existing work, followed by additional searching to strive for comprehensiveness. We first examined both included and excluded literature from
the McKinnon et al. [32] systematic map. Then, we
extended our search to six major publication databases (Web of Science, Agris, AGRICOLA, GreenFile, Econ-Lit, and CAB Abstracts), including nine indices in Web of Science, which cover natural and social science areas. Details on search settings and subscriptions can be found
in Additional file 1. We only searched these databases
for articles published between 2014 and 2016, reflecting time not covered by the McKinnon et al. systematic map. Searching was performed on November 30, 2016. Addi-tional searching was carried out in Web of Science from 1900–2014 to capture any articles missed by the McKin-non et al. search (conducted on March 3, 2017). Grey literature was identified from a list of organizational
web-sites and topical databases (Additional file 1) using the
full search string when possible. When search functions were limited, we used an abridged version of the search string (“forests” AND “poverty”). Lastly, given the num-ber of existing systematic efforts on subsets of this topic, we screened bibliographies of related systematic evidence syntheses for relevant articles [25, 26, 29, 30, 33–36]. Due to the volume of articles meeting inclusion criteria, we did not screen cited literature within included articles for inclusion in this study.
Article screening and study eligibility criteria
Eligibility criteria
After compiling results from the search strategy, recov-ered articles were screened according to an established set of eligibility criteria (Table 1). Intervention and out-come categories are based on working frameworks—
PRIME [37] and the Forestry modules published by
the FAO, CIFOR and the World Bank Living Standards
Measurement Surveys team [38]—for forest-based pro-ductive activities and dimensions of poverty. All articles must meet all inclusion criteria to be in the final dataset.
Screening process
All articles were screened in EPPI Reviewer 4.2 Titles
and abstracts were screened by three researchers (SHC, KM, PR) with 10% of titles and abstracts screened by at least two reviewers. All screeners screened 20 titles and abstracts as a training set to ensure consistency in screen-ing. Disagreements between reviewers occurred in ~ 30% of double screened titles and abstracts. If inclusion could not be resolved by the review team, a second opinion was sought from the author team, and resolved by consensus. At the full-text screening stage, two researchers
exam-ined ~ 5% of articles (n = 11) together to ensure
consist-ency, following the same set up for team-based review for inclusion.
Study validity assessment
Given the broad scope and size of this systematic map, we did not assess individual articles for quality (e.g. reli-ability and relevance based on study design).
Data coding strategy
For the purposes of this study, we did not distinguish between articles and studies, with all articles treated as a single case study. While articles could have reported on multiple studies, these were not prevalent in our data-set as they would have been excluded as non-systematic reviews or meta-analyses.
Each included article was coded with a standard-ized coding tool and codebook to extract relevant data
(Additional file 2). This coding tool was piloted by two
researchers (SHC, KM) for 11 articles to ensure consist-ency in extraction. Initial disagreement averaged around ~ 25% of extracted fields in the testing stage. These disa-greements were discussed and additional, more detailed guidance was added to the data extraction questionnaire
(Additional file 2) to ensure consistency between
review-ers. Given the large volume of included articles at the title and abstract stage, double extraction of all articles was not conducted. Rather, the research team discussed uncertain and unresolved articles on a regular basis for collective resolution. In the case where articles authored by members of the review team were encountered, we ensured that authors did not screen nor code their own work. The coding tool was deployed in Google Forms to aid in consistency in recording data between research-ers and articles. Extracted data was recorded in a comma
separated file and parsed into a standardized format in
R and analyzed using a customized script (https ://githu
b.com/schen g87/profo r).
The following categories of data were extracted from each article.
• Unique article ID and assessor information. • Bibliographic information.
• Information on forest-based productive activity. • Information on design, scale, and location of study. • Information on poverty outcomes including
indica-tors used.
• Information on causal mechanism (if available).
Study design was coded based on the following criteria
adapted from Margoluis et al. [39]: (1) data type
(quan-titative, mixed); (2) random assignment of treated group (yes, no, unknown); (3) presence of comparison group (yes, no, unknown); (4) comparisons conducted over time (punctuated, continuous, before/after). This clas-sification is not intended to infer quality of study design but to facilitate assessment of articles in terms of whether they demonstrate internal and external validity. As we are interested in examining articles that attempt to examine cause-and-effect relationships (i.e. links between forest activities and poverty), we are particularly interested in articles that use counterfactual to attribute observed out-comes to an action/intervention [40, 41].
The systematic map does not quantify or validate direc-tion of impact for poverty outcomes examined but aims to describe the distribution of research effort over forest-poverty linkages. Thus, in order to understand how dif-ferent poverty dimensions are measured, we recorded textual data (if available) on the types of indicators used. This data was categorized into common themes by the research team.
Data mapping method
The distribution of the evidence base was compiled into a structured heatmap (or “systematic map”) of linkages between individual intervention and outcome types. Evi-dence on outcomes (rows) were mapped on to different categories of interventions (columns). As articles can examine links between more than one intervention and outcome type, individual articles were mapped to more than one cell when applicable.
Results
Number and types of articles
Figure 1 details step-by-step results of the systematic
mapping process. Database and bibliographic search-ing yielded 5619 unique results, but most were excluded due to irrelevance (~ 2600 articles) (Fig. 1). Non-database
searching yielded 70 potentially relevant articles, of which nine met the inclusion criteria. This type of sup-plementary searching tends to turn up both peer-reviewed and grey literatures, and we ultimately included an additional five peer-reviewed and four grey literature sources from this search strategy. At the full-text screen-ing stage, most studies were excluded due to inappropri-ate study design to attribute causality (~ 41% excluded articles), such as lacking a comparator or poorly designed
comparators (e.g. comparisons across sites without
matching or accounting for differences) (n = 231).
Ulti-mately, 242 articles were included in the final map
(full bibliography in Additional file 3). Bibliography
of excluded articles with exclusion criteria is listed in Additional file 4. Coded data for all included articles are
included in Additional file 5. A ROSES reporting form is
included in Additional file 6.
(n= 4,233) McKinnon et al. 2016 search results (n= 2,656)Systematic evidence syntheses bibs (n= 524)
Records after removing duplicates (n= 5,619)
Records after screening titles & abstracts
(n= 1,633)
Articles retrieved at full text (n= 1,509)
Articles after full text screening (n= 233)
Pre-screened articles from organizational searches
and key informants (n= 9)
Articles included after full text screening
(n= 242)
Articles included in systematic map data and narrative synthesis
(n= 242)
Duplicates (n= 1,794)
Excluded at title and abstract (n= 3,985)
Unretrievable full texts (Not accessible, n= 76;
Not found, n= 48)
Excluded full texts (n= 1,276) Excluded on:
– Population (n= 28) – Comparator (n= 231)
– Intervention/exposure (n= 124) – Outcome (n= 271)
– Study design (n= 526) – Topic (n= 21) – Other (n= 37) – Duplicates (n= 38)
SEARCHING
SCREENING
SY
NTHESIS
Fig. 1 Diagram illustrating articles recovered in initial search and included following screening and full text assessment. This diagram follows RoSES
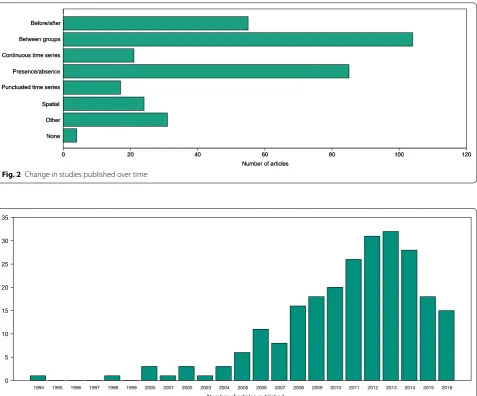
Few articles were published prior to 2000, with the vol-ume of articles published increasing steadily from 2000 to 2013, with a slight decrease in the rate of publication
since 2014 (Fig. 2). Included articles used a range of
dif-ferent comparators to examine the contribution of forest-based activities to changes in poverty over time, space,
and populations (Fig. 3). Most of the studies employed
a non-experimental study design (76%). Approximately
35% of articles (n = 85) compared effects of the
interven-tion over time (either before/after, or over a time series) while a majority of articles compared effects between groups and/or presence/absence of intervention (65%,
n = 158). However, only 49 articles employed a control—
either set a priori or observed explicitly post hoc. Overall, about half of the primary research articles used a combi-nation of quantitative and qualitative methods to
exam-ine change in poverty over time (n = 122, 52%).
Geography of included studies
Included studies in the systematic map span a range of
geographic areas (Fig. 4). The most studied areas are
South Asia, East Asia, Southeast Asia, South America, and East Africa, while Europe, North America and West Africa had relatively few articles. The five countries with
the most articles are Nepal (n = 38), China (n = 25),
India (n = 25), Bangladesh (n = 16), and Brazil (n = 12). Together, they account for ~ 44% of all included studies.
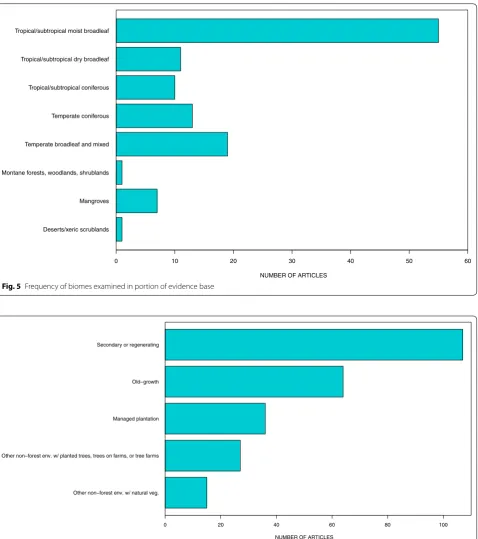
Ecological coverage and forest types examined
Articles included in this study only documented explicit for-est and biome type haphazardly using inconsistent typologies and terminologies. We were unable to extract information on forest type from 42% (n = 97) and biome from 61% (n = 143) of articles. When explicitly indicated, tropical/subtropical
Be Beffore/afterore/after
Bet Betwween groupseen groups
Conti
Continnuous time seuous time serriesies
Presence/absence Presence/absence
Punctuated time se Punctuated time serriesies
Spatial Spatial
Other Other
None None
Number of articles Number of articles
00 2020 4040 6060 8080 100100 120120
Fig. 2 Change in studies published over time
1994 1995 1996 1997 1998 1999 2000 2001 2002 2003 2004 2005 2006 2007 2008 2009 2010 2015 2016 Number of articles published
0 5 10 15 20 25 30 35
2011 2012 2013 2014
forests were most frequently studied (79%, n = 68 out of 87)
(Fig. 5), while recorded forest types were mostly secondary or regenerating natural forests (Fig. 6).
Types of forest‑based productive activities
As forest interventions can be complex, articles can be classed into multiple different sub-categories of forest-based productive activities. In general, the productivity, rights, and markets strategies from the PRIME frame-work are the most studied, however, concentration of evi-dence is focused on activities in specific sub-categories within these strategies. For example, forest management (P), governance (R), individual rights and empowerment (R), and managing and enhancing ecosystem services (E) were well-studied. Comparatively, few articles examined activities aimed at enhancing capitals (produced and social) (I), utilizing and harnessing market forces (M), and protecting and augmenting non-monetary benefits (E) (Fig. 7).
As forest interventions are rarely one-dimensional, and often include a wide portfolio of activities and objec-tives, articles often examined multiple interventions
(75% examined more than 1, n = 175). The interventions
that were most commonly studied within a single article
were: forest management and governance (n = 33), forest
management, governance, and empowerment (n = 17),
and empowerment and governance (n = 10). For
exam-ple, institutional forms of forest management that com-bine these types of approaches include forest user groups or Joint Forest Management. In practice, this appears in implemented programs for example in the Grain for
Green Program and the Sloping Land Conversion Pro-gram in China.
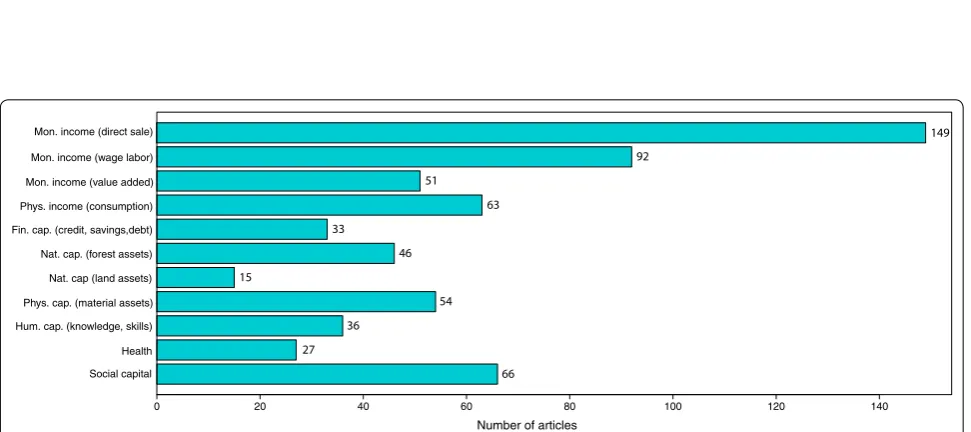
Dimensions of poverty examined
Overall, most articles examined some element of mon-etary income, whether from sales, wage labor, or value
addition (Fig. 8), with the majority focusing on
mon-etary income derived from direct sales. Commonly measured capitals and assets included changes in social capital (e.g. relationships, trust, conflict, empower-ment), physical capital (e.g. material assets), and natu-ral capital (forest-based assets). Land-based natunatu-ral capital and health were not as commonly examined. Overall, a little less than 50% of articles disaggregate measurements of outcomes across different sectors of
society (n = 120). Amongst these articles, most examine
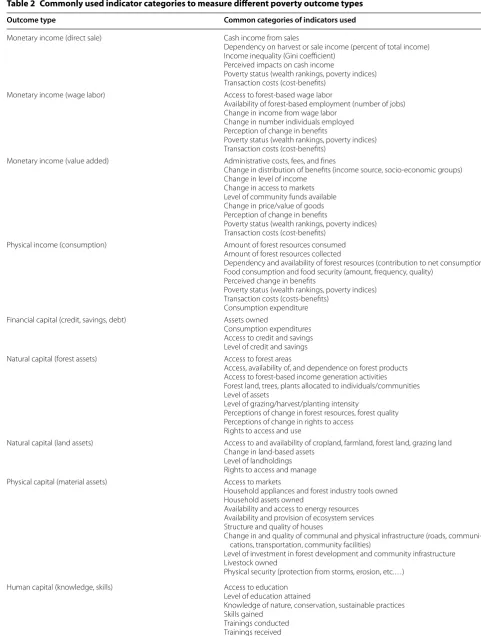
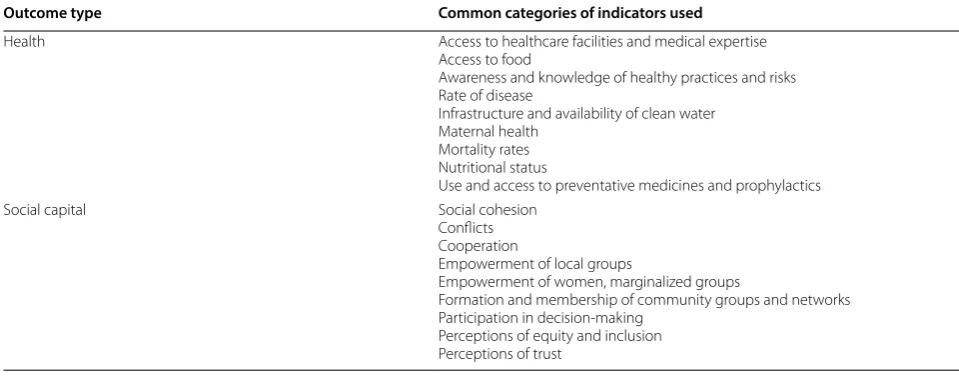
differences in poverty impacts across different socio-economic groups (e.g. poor versus not poor, socio-economic stratifications) (Fig. 9). Comparatively, far fewer articles examine heterogeneity in outcomes across race/eth-nic groups or gender groups in a landscape. Outcomes were measured using a wide variety of indicators, with most revolving around measured and perceived changes in access, availability, and use. Common indi-cators used to measure changes in income, consump-tion, capitals and assets are detailed in Table 2.
Intersection of forest‑based productive activities and poverty outcomes
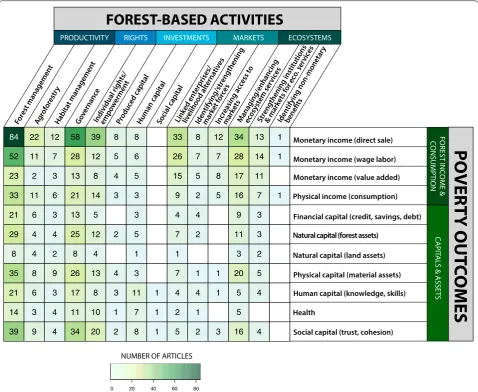
The systematic map at the center of this study is pre-sented as a visual heat map of the distribution and
0 10 20 30 Number of articles
40
frequency of linkages across the framework of forest-based productive activities and poverty dimensions. Linkages with darker colors indicated higher occurrences of articles while lighter colors indicate lower occurrences
(Fig. 10). Forest management, agroforestry, and habitat
management (P) and their links to monetary income and to social capital—i.e. the P component of PRIME—are the most commonly studied productivity-enhancement strategies in the literature. The majority of included
articles (75%, n = 174) examined linkages between “P”
Deserts/xeric scrublands Mangroves Montane forests, woodlands, shrublands Temperate broadleaf and mixed Temperate coniferous Tropical/subtropical coniferous Tropical/subtropical dry broadleaf Tropical/subtropical moist broadleaf
NUMBER OF ARTICLES
0 10 20 30 40 50 60
Fig. 5 Frequency of biomes examined in portion of evidence base
Other non−forest env. w/ natural veg. Other non−forest env. w/ planted trees, trees on farms, or tree farms Managed plantation Old−growth Secondary or regenerating
NUMBER OF ARTICLES
0 20 40 60 80 100
Forest mgmt Agroforestry Habitat mgmt Governance Indiv. empowerment Produced capital Human capital Social capital Linked enterprises/livelihood alt. Market forces Market access Managing/enhancing eco. serv. Institutions & markets for eco. serv. Non−monetary benefits
Number of articles
0 20 40 60 80 100 120 140
142
103 63
66 26
16 14
49 2
22 13
25 32
1
Fig. 7 Distribution and frequency of forest-based activities examined within relevant PRIME categories. Articles can appear in more than one
activity type
Mon. income (direct sale)
Mon. income (wage labor)
Mon. income (value added)
Phys. income (consumption)
Fin. cap. (credit, savings,debt)
Nat. cap. (forest assets)
Nat. cap (land assets)
Phys. cap. (material assets)
Hum. cap. (knowledge, skills)
Health
Social capital
Number of articles
0 20 40 60 80 100 120 140
149 92
51 63 33
46
15
54 36
27
66
Fig. 8 Frequency of poverty dimensions examined in included articles. As many articles examined more than one dimension, articles can appear in
more than one category
No
0 50 100 150 200
Unclear No Yes
Race/ethnicity Socio-economic
Gender
Number of ar
ticles
Fig. 9 Frequency of poverty dimensions examined disaggregated across gender, race/ethnic group, and socio-economic stratifications. Articles
Table 2 Commonly used indicator categories to measure different poverty outcome types
Outcome type Common categories of indicators used
Monetary income (direct sale) Cash income from sales
Dependency on harvest or sale income (percent of total income) Income inequality (Gini coefficient)
Perceived impacts on cash income
Poverty status (wealth rankings, poverty indices) Transaction costs (cost-benefits)
Monetary income (wage labor) Access to forest-based wage labor
Availability of forest-based employment (number of jobs) Change in income from wage labor
Change in number individuals employed Perception of change in benefits
Poverty status (wealth rankings, poverty indices) Transaction costs (cost-benefits)
Monetary income (value added) Administrative costs, fees, and fines
Change in distribution of benefits (income source, socio-economic groups) Change in level of income
Change in access to markets Level of community funds available Change in price/value of goods Perception of change in benefits
Poverty status (wealth rankings, poverty indices) Transaction costs (cost-benefits)
Physical income (consumption) Amount of forest resources consumed
Amount of forest resources collected
Dependency and availability of forest resources (contribution to net consumption) Food consumption and food security (amount, frequency, quality)
Perceived change in benefits
Poverty status (wealth rankings, poverty indices) Transaction costs (costs-benefits)
Consumption expenditure
Financial capital (credit, savings, debt) Assets owned
Consumption expenditures Access to credit and savings Level of credit and savings
Natural capital (forest assets) Access to forest areas
Access, availability of, and dependence on forest products Access to forest-based income generation activities Forest land, trees, plants allocated to individuals/communities Level of assets
Level of grazing/harvest/planting intensity
Perceptions of change in forest resources, forest quality Perceptions of change in rights to access
Rights to access and use
Natural capital (land assets) Access to and availability of cropland, farmland, forest land, grazing land
Change in land-based assets Level of landholdings Rights to access and manage
Physical capital (material assets) Access to markets
Household appliances and forest industry tools owned Household assets owned
Availability and access to energy resources Availability and provision of ecosystem services Structure and quality of houses
Change in and quality of communal and physical infrastructure (roads, communi-cations, transportation, community facilities)
Level of investment in forest development and community infrastructure Livestock owned
Physical security (protection from storms, erosion, etc.…)
Human capital (knowledge, skills) Access to education
Level of education attained
Knowledge of nature, conservation, sustainable practices Skills gained
activities and its relationship to monetary income, and to some extent, to social capital. Other frequently explored linkages were those between governance, individual rights/empowerment (R) and linked market-based enter-prises/livelihood alternatives (M) with monetary income from direct sale of goods and/or changes in social capital (Fig. 10).
Other pathways were less studied. For example, only 32 articles looked at investments in public services and infrastructure with very little evidence on the links between these actions and monetary income through direct sales of forest goods or with social capital out-comes. Sixty-four articles focused on actions related to markets (enterprises and livelihood alternatives; mar-ket access and forces) with most evidence correlating these actions with monetary income through direct sales of forest goods and wage labor. Finally, 76 articles report evidence on the links between actions related to ecosystem services management and enhancement, stronger institutions and markets for ecosystem services and welfare outcomes with their impacts on monetary income through direct sales of forest goods and wage labor.
Overall, capital and asset dimensions of poverty were comparatively less studied, with the exception of social
capital (n = 66) and physical capital (n = 54). Only one
article examined identifying non-monetary benefits. Linkages between any activity and changes in health, along with changes in natural capital in terms of land assets were explored in very few articles.
Synthesis of systematic evidence syntheses
Nine systematic evidence syntheses (seven systematic reviews and two evidence gap maps) were included in our
study (Table 3). In general, the systematic reviews
con-verge with areas that have high occurrences of evidence including links between forest management, governance, linked enterprises/livelihood alternatives, and manag-ing/enhancing ecosystem services across the majority of
poverty dimensions (Fig. 11). Our systematic map had 55
overlapping articles with those captured in the nine evi-dence syntheses reviewed. Differences in which studies were included between this synthesis and the others, are most likely due to the differences in scope and to inclusion criteria. We found that the two evidence gap maps cov-ered similar linkage areas as we did and also found simi-lar knowledge gaps (Table 3). For example, both Puri et al. [29] and Snilsveit et al. [30] did not find any articles on the impacts of forest conservation and land-use change and forestry programmes (respectively) on human health.
Types of mechanisms linking activities to changes in poverty
Documenting causal mechanisms can be fraught with difficulties, thus, this systematic map aimed to be as comprehensive as possible in accounting for attempts to causally link forest-based activities to impacts. We docu-mented whether articles attempted to utilize any type of conceptual or causal model or framework to frame their study, inform study design, and/or validate a model with empirical data. Only 29 articles used a conceptual model in this way. Models fell into the following types:
concep-tual models or frameworks (n = 18), theories of change
[42] (n = 4), results chains [43] (n = 2), logic models [44]
(n = 1), or unknown (n = 4). Models generally were used
to frame the study (n = 19). Comparatively fewer were
used to infer a model from the data (n = 2) or analyze
data (n = 2). Finally, only a handful of studies (n = 5) used
models to validate data. Table 2 (continued)
Outcome type Common categories of indicators used
Health Access to healthcare facilities and medical expertise
Access to food
Awareness and knowledge of healthy practices and risks Rate of disease
Infrastructure and availability of clean water Maternal health
Mortality rates Nutritional status
Use and access to preventative medicines and prophylactics
Social capital Social cohesion
Conflicts Cooperation
Empowerment of local groups
Empowerment of women, marginalized groups
Formation and membership of community groups and networks Participation in decision-making
Discussion
This study provides an up-to-date systematic map docu-menting the state of evidence on the contribution of for-est-based productive activities worldwide to changes in poverty. The resultant map highlights several knowledge gaps and biases in current research efforts, including a relatively heavy concentration on specific geographic areas, and linkages between intervention and outcomes types. In particular, it highlights a number of absolute evidence gaps (where limited or no evidence exists) as well as synthesis gaps (where substantial volume of evi-dence exists, but lacks synthesis). Absolute evievi-dence gaps exist (1) between all forest management intervention types and impacts on human health, (2) the impacts of investments in produced, human, and social capital in forested landscapes on all dimensions of poverty, and (3)
the impacts of efforts to identify non-monetary benefits of ecosystem services (e.g. cultural and spiritual values and uses of forests) on all dimensions of poverty. Syn-thesis gaps are found at the intersections of (1) govern-ance and individual rights/empowerment on capitals and assets and (2) impacts of livelihood alternatives/linked enterprises on incomes and consumption. We discuss these gaps in greater detail in the following sections.
Limitations of the map
While the search strategy employed to generate this map was designed to capture the breadth of relevant topics, it was not exhaustive (i.e. does not attempt to capture all existing evidence) due to finite time and resources. Thus, while we attempted to capture the diversity of terminology in use across multiple relevant
39 9 4 34 20 2 8 1 5 2 3 16 4
14 3 4 11 10 1 7 1 2 1 5
21 6 3 17 8 3 11 1 4 4 1 5 4
35 8 9 26 13 4 3 7 1 1 20 5
8 4 2 8 4 1 1 3 2
29 4 4 25 12 2 5 7 2 11 3
21 6 3 13 5 3 4 4 9 3
33 11 6 21 14 3 3 9 2 5 16 7 1
23 2 3 13 8 4 5 15 5 8 17 11
52 11 7 28 12 5 6 26 7 7 28 14 1
84 22 12 58 39 8 8 33 8 12 34 13 1
FOREST-BASED ACTIVITIES
Fore st m
anag emen
t
PRODUCTIVITY RIGHTS INVESTMENTS MARKETS ECOSYSTEMS
Agro fore
stry
Habitat managemen t
Governanc e
Indi vidu
al ri ghts
/
em pow
ermen t
Produc ed capital
Human capitalSocial capitalLinked enterprises/ livelihood al tern ativ
es
Identifying/strengthening mar ket f
orce s
Incr easin
g ac cess
to
mark ets
Managing/enhancing ecosy stem
servi ces
Strengthening institution s
& m arke
ts fo r eco
. ser vices
Identifying non-monetar y
Health
Human capital (knowledge, skills) Physical capital (material assets) Natural capital (forest assets)
Financial capital (credit, savings, debt) Monetary income (value added)
Monetary income (wage labor)
POVERTY OUT
COMES
Monetary income (direct sale)
Natural capital (land assets) Physical income (consumption)
Social capital (trust, cohesion)
20 40 60 80
0
NUMBER OF ARTICLES
FOREST INC
OME
&
CONSUMPTION
CAPI
TA
LS & ASSE
TS
Fig. 10 Distribution of evidence across PRIME forest-based productive activities and dimensions of poverty outcomes. Numbers reflect total
Table
3
C
rossw
alk of included sy
st
ema
tic e
videnc
e syn
theses and their char
ac teristics Type A uthors Popula tion Sta ted in ter ven tion Rela ted in ter ven tion ca tegor y Sta ted out comes Rela ted out come ca tegor y Study t ype Top G eo . In c. O v. SR Bo wler et al . [ 25 ] Less de veloped countr ies Communit y f or est management For est manage -ment, go ver nance , individual r ights/ empo w er ment Global en vir on
-mental and local welfar
e benefits
For
est income and consumption, social capital
, human capital , ph ysical capital Qual
, Quant, C
omb India, Nepal 42 8 SR Br ooks et al . [ 76 ] Lo w
er and middle
-income countr ies Communit y-based conser vation G ov er nance , individual r ights/ empo w er ment A
t least t
w
o of the
four out comes of int er est —attitu -dinal , beha vioral , ecolog ical , and economic For
est income and consumption
Qual
, Quant, C
omb Tanzania, M ada -gascar 123 4 SR La wr ence et al . [ 77 ] Unit ed K ingdom Communit y w ood -lands For
est management, gover
nance Bioph ysical impac ts , social impac ts ,
economic and financial impac
ts , par ticipation M onetar y f or est income — wage labor
, social capital
Qual
, Quant, C
omb N/A ( only UK ) 78 0 SR Leisher et al . [ 27 ] Non-OECD Communit y-based natural r esour ce
management with diff
er
ent gender
compositions of natural r
esour
ce
management groups
For est manage -ment, go ver nance , individual r ights/ empo w er ment
Changes in go
v-er nance (incl . rule -mak ing and compliance), con -flic t r esolution, and accountabilit y and transpar enc y. All out comes r elat ed to conser vation efficac y, incl . impr ov ements in f or est co ver and g reat er f or est pr ot ec tion Social capital , access to f or est Qual
, Quant, C
omb India, Nepal 17 4 SR Pullin et al . [ 26 ] Global Pr ot ec ted ar eas M anag ing and enhancing ecosys -tem ser vices Liv elihood strat eg ies , social capital , empo w er ment, human r ights , access t o eco -syst em goods and ser vices and natural r esour ces essential t o w ell-being For
est income and consumption, access t
o f or ests , access t o land ,
health, social capital
Qual
, Quant, C
omb
Uganda, I
ndia
48
Includes inf
or
ma
tion on study t
ype , popula tion, sta ted in ter ven
tion and out
come ca tegor ies , c or respondenc
e with in
ter
ven
tion and out
come ca
tegor
ies included in the sc
ope of this sy
st ema tic map , da ta t ype , na tions
with highest fr
equenc
y of ar
ticles (t
op geo
), number of included ar
ticles (I
nc
.), and number of o
ver
lapping ar
ticles with this sy
st
ema
tic map (
O v.). Total o ver lapping ar ticles = 55 Table 3 (c on tinued) Type A uthors Popula tion Sta ted in ter ven tion Rela ted in ter ven tion ca tegor y Sta ted out comes Rela ted out come ca tegor y Study t ype Top G eo . In c. O v. SR Samii et al . [ 34 ] Lo w
er and middle
-income countr ies Pa yments f or en vi -ronmental ser vices M anag ing and enhancing eco -syst em ser vices , str engthening
institutions and mar
kets Po ver ty conditions of f or est dw ell -ing communi -ties—impac ts on
consumption, income
, or income
pot
ential
For
est income and consumption
Qual
, Quant, C
omb Costa R ica, M exico 20 7 SR Samii et al . [ 35 ] Lo w
er and middle
-income countr ies D ecentraliz ed f or est management For
est management, gover
nance Po ver ty conditions of f or est dw ell -ing communi -ties—impac ts on
consumption, income
, or income
pot
ential
For
est income and consumption
Qual
, Quant, C
omb Uganda 12 7 EGM Pur i et al . [ 29 ] Lo
w- and middle
-income countr ies For est conser vation int er ventions All Kno wledge and beha vior change , transpar enc y and accountabilit y out comes , en vir on -mental , social , and cost -eff ec tiv eness impac ts Human capital , f or -est income , social capital , ph ysical capital Quant Costa R ica, Brazil 118 33 EGM Snilsv eit et al . [ 30 ] Global
Land-use change and f
or est pr o-grammes Habitat manage
-ment, identifying and str
engthening mar ket f or ces , social capital , str engthening
institutions and mar
kets , human capital , pr oduced capital Uptak
e of ag
ricul
-tural prac
tices
,
land-use or f
or
est
management; envir
onmental out comes r elat ed to g reenhouse gas
emissions; human welfar
e out
comes
For
est income and consumption, health, ph
disciplines, we recognize that terms that may have been missed may result in bias in our evidence map. First, the search was limited to English language only. We recognize that a substantial volume of literature likely exists in other languages, for example in French, Spanish, Portuguese, Farsi, and Chinese, however, we did not have the resources to conduct these searches. Second while we searched the bibliographies of eight systematic evidence syntheses, we did not conduct for-ward and backfor-ward citation screening of included pri-mary literature. Nevertheless, because we have clearly and transparently outlined our search methodology
here and in the original protocol [31], this search can
easily be updated in the future with additional sources. Third, the topic of this systematic map straddles multi-ple disciplines and sectors (conservation, development,
natural resource management), thus substantial seman-tic diversity is more than likely to exist. Unlike medical fields, these fields lack a standardized ontology [45, 46] and are characterized by rapid radiation of terms in use over the past few decades. While our search strategy attempted to capture this diversity through piloting and testing with an interdisciplinary and multisector review team, we recognize that not including specific terms in our search may have resulted in literature areas missed.
In addition to limitations to the search strategy, we highlight several caveats regarding the screening pro-cedure, how data were synthesized, and how it is pre-sented, that should be considered when interpreting this systematic map and using it for decision-mak-ing. First, while the studies included in this system-atic map are critical for understanding the current
FOREST-BASED ACTIVITIES
Forest management
PRODUCTIVITY RIGHTS INVESTMENTS MARKETS ECOSYSTEMS
Agro fore
stry
Habitat managemen t
Gove rnanc
e
Individual rights/ empow ermen t
Produc ed capital
Human capitalSocial capitalLinked enterprises/ livelihood alternativ es
Identifying/st rengthening
mar ket f
orce s
Incr easin
g ac cess
to
market s
Managing/enhancin g
ecos ystem ser
vices
Stre ngth
enin g in
stitu tions
& m arke
ts fo r eco
. serv ices
Iden
tifying non-monetar y
Health
Human capital (knowledge, skills) Physical capital (material assets) Natural capital (forest assets)
Financial capital (credit, savings, debt) Monetary income (value added)
Monetary income (wage labor)
POVERTY OUT
COMES
Monetary income (direct sale)
Natural capital (land assets) Physical income (consumption)
Social capital (trust, cohesion)
20 40 60 80
0
NUMBER OF ARTICLES
FOREST INC
OME
&
CONSUMPTION
CAPI
TA
LS & ASSE
TS
Systematic review 2
3
2
2
3 1 1 1
4
4
3
3
1
1
1
1
3 2
2
2
2
1
1
1
1
2
2
2
2
2
1 1
1
1 1
1
1
1
1
Fig. 11 Distribution of systematic reviews/systematic maps and evidence gap maps across linkages between forest-based productive activities and
state of knowledge, there is also significant insight to be gleaned from those that were excluded. Many of these were narrative case studies, which likely con-tain important contextual information that may not be always captured in a quantitative, counterfactual study. Another significant portion of excluded articles were ones that employed solely qualitative data to explore people’s experiences and perceptions of changes in poverty dimensions. Research design is critically important to ensure reliability and robustness of evi-dence for decision-making and understanding causal impacts, and while quantitative study designs using counterfactuals are the gold standard for conservation and environmental research, arguments can also be made regarding the important insights that qualitative
studies provide (see [47]). Excluding qualitative study
designs and narrative case studies with no comparators likely influenced the low number of articles examining impacts on social capital (e.g. 64 articles in McKinnon
et al. [32] documented impacts of forest conservation
on social relations (an element of social capital) using qualitative study designs, while an additional 25 arti-cles did not use a comparator). However, due to lim-ited time and resources, qualitative studies were not included in the scope of this map. They are identified in
Additional file 4 for future examination and
considera-tion for synthesis.
Conclusion
Implications for policy/management
A major finding from this systematic mapping effort was the overall lack of impact evaluations employing a cred-ible control. Without such an appropriate comparison site, it is unclear whether any observed changes in out-come can be attributed to the studied action or
interven-tion [48]. This is particularly the case where the causal
chains linking activity and outcome may be complex and/ or long. While the value of this kind of impact evaluation is widely recognized for understanding the impact of con-servation and development projects [40, 41, 48], applica-tions of impact evaluation methods in peer-reviewed literature in conservation, natural resource management,
and development fields remains limited [49–51],
particu-larly in relation to long-term impacts [52].
This systematic map did not critically appraise the quality of included impact evaluations, which limits our insights into the overall reliability of the evidence base to robustly measure impacts. However, while we can-not make any statements on the direction of impacts being measured, we can definitively state that much of the potentially relevant research that was recovered in searching did not utilize any type of comparator, which limits their reliability to link impacts to actions.
Furthermore, the majority of studies did not employ any type of causal model or conceptual framework about how actions were thought to lead to outcomes, to either jus-tify nor test hypotheses, or frame study design nor
analy-ses (n = 25). In order to understand what types of actions
will deliver poverty alleviation outcomes, we need well-designed studies that allow for confidence in testing and validating causal linkages between actions and outcomes [53]. The lack of use of explicit causal thinking is particu-larly concerning as it implies that we are continuing to ‘shoot in the dark’ when it comes to understanding what works [54].
Gaps in global research efforts
While global in scope, India and Nepal are two of the top studied countries, likely reflecting a boom of research following implementation of two major forest-based development initiatives in each country (Joint For-est Management initiated in 1990 in India and Com-munity Forest Management initiated in 1993 in Nepal)
[55]. China similarly has a high concentration of
stud-ies, followed by other well-studied regions of the world that lie within tropical forest zones and are also areas of
concentrated and widespread poverty [56] (e.g. South
Asia, Southeast Asia, South America, Eastern Africa). Importantly, however, high study concentration within a country does not imply even distribution of study efforts through all forested regions within national boundaries. This is a significant gap, particularly in regards to calls to understand what is effective for poverty alleviation and ecosystem sustainability and to scale these efforts across
landscapes [2, 10]. However, insight into how to apply
insights to different situations and decisions is limited when the context for learning lacks contextual diver-sity. Thus, we encourage increased research efforts and funding for such efforts in broader forest landscapes to deepen the evidence base for geographic representation.
Gaps in understanding multidimensional poverty
from national statistics offices and international organi-zations (e.g. Living Standard Measurement Survey, [LSMS], Labor Force Survey [LFS]), although in most of the world poverty is measured through consumption, as the latter is less seasonal and can be smoothed and more
related to current living standards [57]. Second, our
sys-tematic map included only studies that utilized quantita-tive or mixed methods data, which could unintentionally bias the map away from capturing poverty dimensions more easily measured through qualitative means. For example, human capital and social capital, which include many intangible dimensions such as sense of well-being, learning and perspectives, are not captured readily with quantitative designs.
While certain dimensions of poverty were well-stud-ied, our results indicate that how changes in poverty are distributed between sexes, different demographic
groups and social strata is not as well studied (Fig. 9).
Yet we know there are many differences in how, why and where men and women, and more empowered ver-sus less empowered individuals and groups, access, use,
manage and benefit from forests [58–60]. Thus, pathways
out of poverty for women, who are often the most forest-dependent, typically differ from those of men, and may require different types of interventions. The limited lit-erature addressing gender in the context of forest land-scapes suggests that participatory consultations, gender
working groups and learning networks [61–63],
gender-sensitive disaggregated data collection, monitoring and
evaluation systems [62, 64] and new benefit-sharing
models [65] can help address intra-household poverty.
However, we are still not able to identify evidence of the impacts of such strategies in forested landscapes.
Gaps in understanding system level actions on poverty in relation to forest resources
Pro-poor policies and strategies aim to alleviate poverty as well as reduce poverty—goals that while are inter-linked and synergistic, require different actions at differ-ent levels to address specific drivers of poverty. Poverty alleviation strategies tend to act primarily through prac-tical and direct changes at local levels to address direct drivers of poverty (e.g. materials, subsistence, income)
[66, 67]. On the other hand, poverty reduction
strate-gies tend to encompass both practical and strategic approaches that address both direct and indirect drivers of poverty at multiple scales. For example, through efforts to strengthen rights of poor people and build capacity
and infrastructure to sustain poverty-free societies [68].
There has been substantial emphasis and international effort towards poverty reduction, especially in forest eco-systems, since the inception of the Millenium Ecosystem Goals.
However, this evidence map shows that research focus appears to be on specific aspects of forest actions that act
directly on people or forest resources (Fig. 10) and less
on how changing infrastructure around these initiatives can have an impact despite considerable development literature that emphasizes the need for capacity building and improving social/economic/political atmospheres
required for facilitating poverty reduction [69–71].
For example, there were comparatively fewer articles that examined market-based activities and investments (aimed at increased produced, human, and social capi-tal), as well as natural capital (forest or land assets with access, use, sale, or exclusion rights) and health out-comes. In relation to the P.R.I.M.E. pathways, this raises concern that much of what we understand about forest-poverty linkages are limited to localized cases where forests are directly tied to changes in livelihoods (e.g. through Productivity), but we have far less clarity around effects to change the overarching systems within which forests and people operate (e.g. Investments and Ecosys-tem Services).
These gaps are particularly concerning given the cur-rent scale of implementation of forest-based develop-ment activities that aim to harness market forces and increase investments in institutions and infrastructure to strengthen sustainable forest management (e.g. par-ticipatory forest management projects, currently being implemented by the World Bank in countries such as Laos, Ethiopia or Kenya). While the limited evidence base may give pause to rapid and widespread implemen-tation of these types of activities, it is also a clarion call for implementers to design robust monitoring and evalu-ation plans to capture a broad range of poverty dimen-sions over a sufficient timescale to observe demonstrable change. Furthermore, these gaps may represent outcomes that may be more likely to take significant time to mani-fest, often beyond the life cycle of a program or project. Thus, future evaluation of efforts falling in these linkages
may be able to use “predictive proxy indicators” [52] or
other techniques to shed light on longer-term outcomes.
Implications for research
Our results suggest at least two areas in which the evi-dence warrants more detailed synthesis and analysis of impact (“synthesis gaps”). The first relates to impacts of rights-based activities within forest ecosystems on all dimensions of poverty. Forest policy has increas-ingly sought to focus beyond specific management approaches, towards creating and strengthening govern-ance and rights in an effort to ensure sustainability of
forest resources and improve human well-being [72, 73].
reviews examining the links between rights-based actions and poverty, including in forested landscapes, they are narrow in scope and based on evidence that has not been updated. Current evidence in this area now merits syn-thesis to investigate causal mechanisms and critical con-texts for achieving impact.
This systematic map also revealed potential interac-tions between forest management and rights-based approaches with 54 articles examining the impacts of programs incorporating both approaches. Thus, given long held hypotheses that successful forest manage-ment must be accompanied by activities that define and enforce access and use rights and assign responsibilities
for management [32, 58, 59], deeper, updated
synthe-ses present opportunities for assynthe-sessing optimal program design for rights-based forest management.
The second area with potential for deeper synthesis relates to the impact of actions around ecosystem ser-vices. Our results show significant occurrence of evi-dence around efforts to manage and enhance ecosystem services, for example through payments schemes, pro-tecting critical ecosystems, and providing mechanisms for linked-livelihood benefits. However, it also shows sig-nificantly less available evidence around the impacts of strengthening institutions to manage and deliver ecosys-tem services and identify and value their non-monetary benefits. This gap poses a particularly policy-relevant area to explore, especially in the context of understand-ing who the winners and losers may be of different approaches generating monetary and non-monetary benefits from ecosystem services. Further synthesis in this area could lead to a clearer understanding of spe-cific knowledge gaps on constructing stable mechanisms that ensure equitable and sustained delivery of ecosystem benefits across social-ecological systems.
Further empirical evaluation is needed to document the relationship between particular strategies to alle-viate and reduce poverty (“absolute evidence gaps”), in particular for mechanisms commonly assumed in development strategies and global policy goals. Despite significant emphasis on market-focused strat-egies (e.g. development of sustainable forest value chains, promotion of small- and medium sized forest enterprises), we found that these mechanisms are not particularly well-studied and merit further empirical investigation. In particular, actions to improve market forces (e.g. certification schemes, value chain analyses, creating forest funds) and improving access to mar-kets (e.g. producer/forest user group networks and platforms, credit access) were not well documented in the evidence base, particularly in relation to livelihood alternatives.
How to use this systematic map
This systematic map illustrates the quantity and distri-bution of evidence across forest activities and poverty dimensions. It does not, however, illustrate nor detail underlying quality of individual articles as we did not conduct a critical appraisal. In the heatmap, it is impor-tant to remember that higher occurrences of evidence do not necessarily imply high quality evidence, nor posi-tive impacts. Thus, if a linkage is characterized by many studies, it does not mean that the intervention is effec-tive—only that it is well-studied. Further systematic review is required to gauge the overall effectiveness of a given intervention type. The systematic map can be used to support the location of evidence to inform the design of studies, policies, and practical interventions, and to strengthen monitoring and evaluation frameworks fol-lowing the inclusion and exclusion criteria.
This systematic map serves as a single, searchable resource, showing areas ripe for future systematic review and evidence synthesis as well as understudied areas requiring more targeted and more robust research. Like other systematic maps produced in this topic area (e.g. [30, 32, 33]), this map aims to reduce time and resources required to find evidence to support decision-making for practitioners, researchers, and policy-makers. The map and all underlying coded data are hosted on the open
access Evidence for Nature and People Data Portal.3
The map does not formally assess the direction of the impacts, leaving this important task for future evidence synthesis. But this map does present important results to guide this effort and provides a comprehensive resource on evidence gathered to date. It details where effort and invest-ment in gathering evidence has so far focused, including the type of forest-based interventions and poverty meas-ures studied. Crucially, it also shows where more research is needed. In particular, research and evaluation efforts should consider collecting data on non-monetary dimensions of welfare, and health, along with a wider range of monetary dimensions including assets and wage income. Additional research on impacts by social group across different con-texts is also needed. Such work could provide much-needed evidence on a wider range of ways that forests may contrib-ute to reducing poverty in its multiple dimensions.
In summary, this systematic map provides a compre-hensive picture of available evidence on forest-poverty linkages globally. In so doing, it presents a resource that can support on-going efforts to advance knowledge of forest-poverty linkages and practical efforts seeking to reduce poverty and advance other UN Sustainable Devel-opment Goals, and acts as a benchmark for other initia-tives to build and expand on [74].