Open Access
Methodology
Optimising the Use of TRIzol-extracted Proteins in Surface
Enhanced Laser Desorption/ Ionization (SELDI) Analysis
Tsz-Kwong Man*
1, Yiting Li
1, Tu Anh Dang
2, Jianhe Shen
1, Laszlo Perlaky
1and Ching C Lau
1Address: 1Texas Children's Cancer Center, Department of Pediatrics, Baylor College of Medicine, Houston, TX, USA and 2Ciphergen Biosystems, Fremont, CA, USA
Email: Tsz-Kwong Man* - [email protected]; Yiting Li - [email protected]; Tu Anh Dang - [email protected]; Jianhe Shen - [email protected]; Laszlo Perlaky - [email protected]; Ching C Lau - [email protected]
* Corresponding author
Abstract
Background: Research with clinical specimens is always hampered by the limited availability of relevant samples, necessitating the use of a single sample for multiple assays. TRIzol is a common reagent for RNA extraction, but DNA and protein fractions can also be used for other studies. However, little is known about using TRIzol-extracted proteins in proteomic research, partly because proteins extracted from TRIzol are very resistant to solubilization.
Results: To facilitate the use of TRIzol-extracted proteins, we first compared the ability of four different common solubilizing reagents to solubilize the TRIzol-extracted proteins from an osteosarcoma cell line, U2-OS. Then we analyzed the solubilized proteins by Surface Enhanced Laser Desorption/ Ionization technique (SELDI). The results showed that solubilization of TRIzol-extracted proteins with 9.5 M Urea and 2% CHAPS ([3-[(3-cholamidopropyl)-dimethylammonio]propanesulfonate]) (UREA-CHAPS) was significantly better than the standard 1% SDS in terms of solubilization efficiency and the number of detectable ion peaks. Using three different types of SELDI arrays (CM10, H50, and IMAC-Cu), we demonstrated that peak detection with proteins solubilized by UREA-CHAPS was reproducible (r > 0.9). Further SELDI analysis indicated that the number of ion peaks detected in TRIzol-extracted proteins was comparable to a direct extraction method, suggesting many proteins still remain in the TRIzol protein fraction.
Conclusion: Our results suggest that UREA-CHAPS performed very well in solubilizing TRIzol-extracted proteins for SELDI applications. Protein fractions left over after TRIzol RNA extraction could be a valuable but neglected source for proteomic or biochemical analysis when additional samples are not available.
Background
TRIzol is a common RNA extraction reagent that has been extensively used in conjunction with microarray analysis and other applications [1-4]. One of the advantages of
TRIzol is its capability of extracting RNA, DNA, and pro-teins from a single sample. However, TRIzol is primarily designed for RNA extraction and the use of TRIzol extracted DNA and proteins for subsequent analysis is still
Published: 23 March 2006
Proteome Science2006, 4:3 doi:10.1186/1477-5956-4-3
Received: 15 November 2005 Accepted: 23 March 2006
This article is available from: http://www.proteomesci.com/content/4/1/3 © 2006Man et al; licensee BioMed Central Ltd.
limited. DNA and protein fractions from TRIzol extraction are valuable resources for researchers when the quantity of the starting material is limited, such as small clinical spec-imens. In addition, if different fractions extracted from the same sample are used for analysis on various high-throughput platforms, such as expression array, SNP array, and proteomic analyses, correlation of the resultant data sets will be less likely to be affected by tissue hetero-geneity [5,6]. We have reported that whole genome-amplified DNA extracted from TRIzol fraction revealed similar genotypic aberrations in Affymetrix 10 K SNP arrays when compared to unamplified DNA and tradi-tional comparative genomic hybridization [7]. However, the usability of TRIzol-extracted proteins in proteomics applications, such as mass spectrometry-based technology is still largely unknown. One of the reasons is that TRIzol-extracted proteins are very resistant to solubilization using the standard solubilizing reagent, 1% SDS as recommend by the TRIzol user manual. This hampers the use of these proteins for subsequent analysis.
To address this problem, we have evaluated the solubili-zation efficiency of TRIzol-extracted proteins by four com-monly used solubilizing reagents. We also examined the number of ion peaks detected and the reproducibility of peak intensity of the solubilized proteins on three differ-ent array types of Surface Enhanced Laser Desorption/ Ionization (SELDI). In addition, the combinations of sol-ubilizing regent and array type for TRIzol-extracted pro-teins were evaluated. We chose SELDI to analyze the proteins because it is a rapid and sensitive high-through-put proteomic technique, which has been used to discover protein biomarkers in basic and clinical studies using lim-ited amount of materials [8,9]. This is the first report of using TRIzol-extracted proteins in SELDI studies.
To identify the best solubilizing reagent, TRIzol-extracted proteins of a human osteosarcoma cell line (U-2O S) were first solubilized with four solubilizing reagents, namely ACN (10% Acetonitrile, pH 4.8), TRITON (1% Triton, pH 5.3), UREA-CHAPS (9.5 M Urea and 2% CHAPS, pH 9.1) and SDS (1% SDS, pH 5.3). These four solubilizing rea-gents were chosen in this study because they are com-monly used in dissolving various protein samples. The solubilization efficiency was calculated as the percentage of the amount of solubilized proteins divided by the weight of the initial protein pellet. The results showed that UREA-CHAPS solubilized significantly higher amount of proteins than the other three solubilizing reagents (Fig. 1). The solubilization efficiency of UREA-CHAPS was 8.8-fold higher than that of the standard 1% SDS, which is often used to dissolve TRIzol-extracted proteins. In addi-tion to the intrinsic differences of the reagents, pH of the solvent also plays an important role in the solubilizing efficiency. Our finding is consistent with Banerjee et al [10], which showed that higher pH significantly increases the yield of the total protein extracted from TRIzol protein pellets.
Number of ion peaks detected by SELDI
Although UREA-CHAPS gave higher solubilization effi-ciency, we were not sure if the solubilized mixture is suit-able for proteomic analysis. Therefore, we used a proteomic technique called SELDI to measure the number of detectable proteins in the solubilized mixtures. Solubi-lized proteins from different experiments were spotted onto three different types of SELDI arrays, hydrophobic H4, weak cationic CM10, and metal (Copper) binding IMAC-Cu. These three different types of arrays have differ-ent chemical properties for binding to differdiffer-ent subsets of proteins in the solubilized protein mixtures. Using differ-ent combinations of solubilizing reagdiffer-ents and array types, we could optimize the condition for analyzing the TRIzol-extracted proteins using SELDI method.
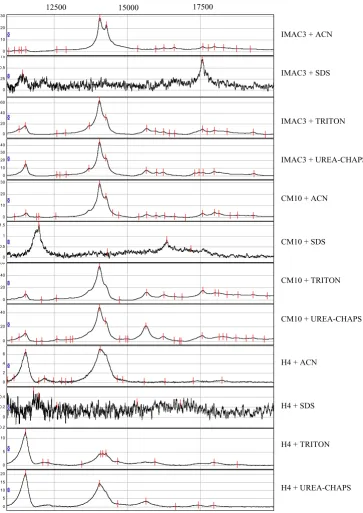
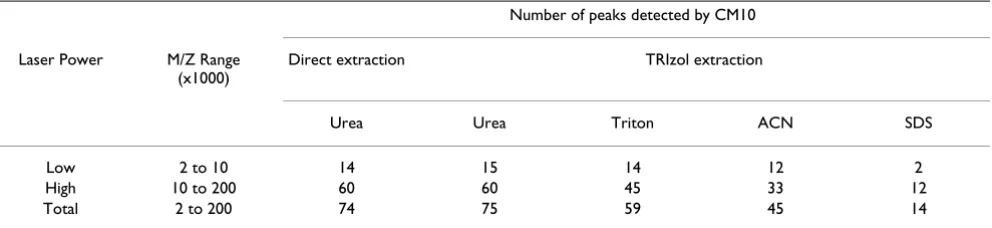
In order to detect proteins with different molecular weights, two levels of laser energy (low and high) were used in the SELDI analysis. After the corresponding pro-files were collected (Fig. 2), the number of detected ion peaks was measured. We found that the number of ion peaks increased with increase of laser energy (Table 1). This is consistent with the fact that we have a larger mass range in the higher laser setting when compared to the lower laser settings. Among the four solubilizing reagents, we detected the lowest number of ion peaks (in both low and high laser settings) in the standard 1% SDS solubi-lized protein preparation with all three-array types (peak number = 10 – 14, Fig. 3). However, when we combined all peaks detected by the three arrays, the highest number
Extraction efficiency of the four solubilizing reagents
Figure 1
Representative SELDI spectra of four solubilizing reagents and three types of array at the high laser energy (see text for details)
Figure 2
Representative SELDI spectra of four solubilizing reagents and three types of array at the high laser energy (see text for details). The x-axis represents the M/Z ratio and the y-axis represents intensity of the peaks. Peaks (tick marks) were detected by Ciphergen's Biomarker Wizard software (Ciphergen Biosystems, Fremont, CA).
0 10 20 30
0 0.25 0.5 0.75
0 20 40 60
0 10 20 30 40
0 10 20 30
0 0.5 1 1.5
0 20 40 60
0 20 40
0 2 4 6
-0.2 0 0.2 0.4
0 5 10
0 5 10 15 20
12500 15000 17500
IMAC3 + ACN
IMAC3 + SDS
IMAC3 + TRITON
IMAC3 + UREA-CHAPS
CM10 + ACN
CM10 + SDS
CM10 + TRITON
CM10 + UREA-CHAPS
H4 + ACN
H4 + SDS
H4 + TRITON
of ion peaks was detected in TRITON or UREA-CHAPS solubilized protein preparation (peak number is around 160, Fig 3). Although the three different arrays are designed to capture proteins with different chemical prop-erties, some proteins may bind to multiple array types. Therefore the number of unique peaks might be less than the numbers shown above. Interestingly, the number of solubilized proteins detected by SELDI did not correlate with the protein concentrations of the protein mixtures, suggesting that the number of ion peaks detected by SELDI may be affected by other factors other than the pro-tein concentration, such as binding efficiency of the solu-bilizing reagents to the arrays. Alternatively, the sensitivity of SELDI may be already high enough to detect ion peaks in the samples with low protein concentrations. When compared to various array types, the combination of UREA-CHAPS reagent and CM10 array captured the high-est number of peaks (peak number = 75, Fig. 3). However, TRITON solubilized protein preparations showed a rela-tively more consistent number of detectable peaks in all three types of array (peak number = 48–58, Fig. 3).
Reproducibility
Next, we measured the reproducibility of the solubiliza-tion and detecsolubiliza-tion by calculating the pair-wise parametric Pearson's coefficients of the peak intensities in triplicate solubilization experiments performed on different days (Fig. 4). In addition, the reproducibility of the duplicated spots of the same experiment was also calculated. The Pearson's coefficients of CM10, H4, and IMAC-Cu were 0.96, 0.82, 0.90, respectively. The high correlation of the duplicate spots of the same experiment suggested that the variability of the SELDI measurements was low. The reproducibility result of CM10 is consistent with a recent study using the same chip type [11].
When compared to the overall reproducibility, the stand-ard 1% SDS solubilization was the lowest among all four solubilization reagents tested (r = 0.76 – 0.83, Fig. 4). ACN showed high reproducibility with H4 array and TRI-TON showed high reproducibility with CM10 and H4 arrays. However, only UREA-CHAPS solubilization
showed consistently high reproducibility in all three array types (r > 0.9) (Fig. 4). UREA-CHAPS coupled with IMAC-Cu array achieved the highest reproducibility among all solubilizing reagent-array type combinations (Fig. 4).
Comparison between direct and TRIzol extractions
Although we were mainly interested in using TRIzol-extracted proteins in this study, to evaluate the usefulness of TRIzol-extracted proteins in SELDI applications, we also compared the number of extractable proteins retained in the TRIzol protein fraction to that of a direct extraction method. For this purpose, UREA-CHAPS, which showed the highest efficiency of solubilizing TRI-zol-extracted proteins in this study, was used to directly extract proteins from the U2-OS cell pellet. Peak numbers detected by SELDI from the protein mixtures extracted from the two approaches were compared on CM10 arrays. (Table 1). The results showed that the number of peaks extracted from the direct method was very comparable to TRIzol extraction coupled with the same UREA-CHAPS solubilizing reagent (Table 1). The number of peaks detected in our study is also similar to a previous study using SELDI analysis on directly extracted proteins (peak number = 50). [12] Nevertheless, since proteins bound to a specific SELDI array is only a subset of cellular pro-teome, the actual number of protein species in the TRIzol-extracted proteins should be even higher. Furthermore, fractionation or immunodepletion will also further increase the number of proteins being detected by reduc-ing the suppression effect of abundant proteins. There-fore, we believe that a significant fraction of proteins is still retained in TRIzol- extracted protein fractions. These protein fractions should be valuable for proteomic analy-sis, especially if another sample of the same tissue is not available.
Conclusion
In this study, we evaluated the use of TRIzol-extracted pro-teins in SELDI-based proteomic analysis. Our study is use-ful for the clinical proteomics investigations, which may have only limited-sized samples and have to rely on TRI-zol to extract both RNA and proteins from the same
sam-Number of peaks detected by CM10
Laser Power M/Z Range (x1000)
Direct extraction TRIzol extraction
Urea Urea Triton ACN SDS
Low 2 to 10 14 15 14 12 2
High 10 to 200 60 60 45 33 12
ple. Among the four solubilizing reagents tested, SDS-solubilized proteins showed the lowest peak numbers and poor reproducibility, suggesting the incompatibility of SDS with SELDI. Although SDS is recommend by the TRI-zol manual, the use of SDS should be avoided in SELDI-based proteomic applications. On the other hand, UREA-CHAPS performed very well in solubilizing TRIzol-extracted protein. SELDI analysis detected large number of peaks in UREA-CHAPS solubilized, TRIzol-extracted pro-teins and showed consistent reproducibility among all three types of SELDI arrays used. It also solubilized similar number of peaks in TRIzol-extracted proteins when com-pared to the direct extraction method, suggesting that sig-nificant amount of proteins is still present in the TRIzol protein fraction. In addition, since UREA-CHAPS is a commonly used solubilizing or extraction reagent [13,14], the use of UREA-CHAPS to solubilize TRIzol-extracted proteins could be extended to other proteomic techniques, such as 2-D gel. From the results of our study, ACN, TRITON and UREA-CHAPS are all compatible with SELDI application. Since different chip types detect differ-ent subset of proteins, the selection of chip type should be based on the proteins of interest.
Methods
Reagents
TRIzol reagent was purchased from Invitrogen (Carlsbad, CA). Isopropanol, guanidine hydrochloride, [3-[(3-chola-midopropyl)-dimethylammonio]propanesulfonate] (CHAPS) were purchased from Sigma (St. Louis, MO). Acetonitrile and Urea were from Fluka (Buchs, Switzer-land). Triton was from Supelco (Supelco Park, PA). McCoy's 5A medium, penicillin-streptomycin,
trypsin-EDTA, phosphate-buffered saline and 10% SDS were from Gibco-Invitrogen (Grand Island, NY). Fetal bovine serum was fromGemini (Woodland, CA). DC protein assay Kit was from Bio-Rad (Hercules, CA).
Cell culture
Human Osteosarcoma U-2 OS cell line (HTB-96) was pur-chased from American Type Culture Collection (Manas-sas, VA). Cells were cultured at 37°C in McCoy's 5A medium supplemented with 10% fetal bovine serum, 100
U/mL of penicillin and 100 µg/mL of streptomycin in a
5% CO2 environment.
Extraction of Proteins using TRIzol
Cells were digested with 0.25% trypsin-EDTA, washed three times with phosphate-buffered saline and pelleted by centrifugation at 200 g for 10 min. The cell pellets were stored at -80°C prior to use. One milliliter of TRIzol rea-gent was added to every 60 mg of cell pellet. After removal of RNA and DNA, proteins were precipitated by isopropa-nol. The protein pellet was washed three times in 0.3 M guanidine hydrochloride/95% ethanol, then centrifuged and washed with 100% ethanol. After centrifugation and removal of ethanol, the pellet was dried in SpeedVac. Pro-tein pellets were stored at -20°C prior to use.
Dissolving protein pellet using solubilizing reagents
The starting protein pellet was first extracted from 30 mg of cell pellet. It was then divided into four portions and
each portion was dissolved with 50 µl of one of the four
solubilizing reagents for two hours: namely ACN (10% Acetonitrile, pH 4.8), TRITON (1% Triton, pH 5.3),
Number of peaks detected by SELDI experiments using vari-ous solubilizing reagents and array types
Figure 3
Number of peaks detected by SELDI experiments using vari-ous solubilizing reagents and array types. The y-axis values represent the mean values of the three replicates performed on different days.
The reproducibility of peak intensities in SELDI experiments using various solubilizing reagents and array types
Figure 4
9.1) (ProteinChip Application Guide, Ciphergen Biosys-tems, Fremont, CA) and SDS (1% SDS, pH 5.3, TRIzol Reagent manual, Invitrogen, Carlsbad, CA). SDS solubili-zation was performed at 50°C with occasional vortex according to the TRIzol manual. Solubilization by other three reagents was performed at room temperature with shaking speed at 150 rpm (Ciphergen's ProteinChip Application Guide). After incubation, samples were cen-trifuged at 16,000 g for 10 min at 4°C to remove any par-ticulate materials. Protein solutions were aliquoted and stored at -20°C prior to use. The solubilization process was repeated two more times at different days (n = 3) to measure the reproducibility of the solubilization meth-ods. To compare the solubilization efficiency, protein concentrations of different solubilized samples were measured by Lowry-based DC (detergent-compatible) protein assay. For solubilization efficiency test, the pro-tein pellets were weighed and the solubilization efficiency was calculated as the percentage of the amount of the sol-ubilized proteins divided by the weight of the protein pel-let.
Capture of solubilized proteins using SELDI arrays
Equal volumes (5 µl) of solubilized proteins diluted with
binding buffer (1:5) from different experiments were spotted onto three different types of SELDI arrays, hydro-phobic H4, weak cationic CM10, and metal (Copper) binding IMAC3 (Ciphergen Biosystems, Fremont, CA). The pH of the diluted samples was confirmed to be the same before applying onto the array. Capture of proteins was performed according to the manufacturer's instruc-tion (Ciphergen Biosystems, Fremont, CA). For H4 array binding, arrays were pretreated with 75% acetonitrile in a humidified chamber for 3 min. After rinsing with HPLC
grade water, 5 µl of sample that has been diluted (1:5) in
5% acetonitrile was applied to each spot on the array. The arrays were incubated for 20 min and washed three times with PBS containing 10% Acetonitrile and 100 mM NaCl.
After air drying, 0.5 µl of saturated alpha-cyano-4-hydroxy
cinnamic acid (CHCA) was applied twice onto each spot.
For CM10 array binding, spots were pre-wetted twice with CM10 low stringency buffer (0.1 M sodium acetate, pH
4.0) for 5 min. Then 5 µl of sample diluted in low
strin-gency buffer (1:5) was applied to each spot and incubated for 1 h. Spots were washed three times with low stringency buffer and then twice with HPLC grade water. After air
drying, 0.5 µl of saturated Sinapinic acid (SPA) was
applied twice onto each spot.
For IMAC3 array binding, spots were coated twice with charging solution (100 mM copper sulfate) for 15 min. Arrays were then rinsed with running HPLC grade water
rinsing with running water for another 10 s, spots were
incubated in 5 µl of binding buffer (0.5 M NaCl in PBS)
for 10 min. Five microliters of sample diluted in binding buffer (1:5) was applied to each spot and incubated for 1 h after which the spots were rinsed 6 times with binding buffer and then twice with HPLC grade water. After air
drying, 0.5 µl of saturated SPA was applied onto each spot
twice.
SELDI and data analysis
Arrays were placed in the Protein Biological System II mass spectrometer reader (Ciphergen Biosystems, Fre-mont, CA) and time-of-flight spectra were generated using two different (low and high) laser spot protocols. The low laser spot protocol was performed to detect proteins of low molecular weight with settings of laser intensity 185, detector sensitivity 6 and optimization range from 1000 Da to 9000 Da. The high laser spot protocol with settings of laser intensity 250, detector sensitivity 8 and optimiza-tion range from 10 kDa to 150 kDa was applied to detect high molecular weight proteins. Center pulse and auto-matic deflector settings were applied in spot protocols.
Peak detection was performed using ProteinChip Soft-ware 3.1 (Ciphergen Biosystems, Fremont, CA). The molecular mass below 2000 Da were eliminated from analysis because this area contains adducts and artifacts of the Energy Absorbing Molecule (EAM) and possibly other chemical contaminants. Spectra of samples solubilized with the same reagent and generated under the same laser condition were grouped together and baseline subtracted. The spectra were normalized to the total ion current of m/ z starting from 1500 for the low molecular weight protein or from 10,000 for the high molecular weight protein. Peaks were autodetected with a signal to noise ratio of >5 and the peaks were clustered using second pass peak selec-tion with signal to noise ratio of >2. A 0.7% mass window was selected to obtain optimal label of peaks. Peak infor-mation was exported into Excel and peak number was cal-culated for each spectra. For the analysis of reproducibility, estimated peaks were added to make sure that the peak information is complete for each cluster.
Publish with BioMed Central and every scientist can read your work free of charge "BioMed Central will be the most significant development for disseminating the results of biomedical researc h in our lifetime."
Sir Paul Nurse, Cancer Research UK
Your research papers will be:
available free of charge to the entire biomedical community
peer reviewed and published immediately upon acceptance
cited in PubMed and archived on PubMed Central
yours — you keep the copyright
Submit your manuscript here:
http://www.biomedcentral.com/info/publishing_adv.asp
BioMedcentral
Competing interests
The author(s) declare that they have no competing inter-ests. TAD is an employee of Ciphergen Biosystems, Inc, the manufacturer of SELDI arrays and reader.
Authors' contributions
Yiting Li and Jianhe Shen were involved in the technical execution of the project. Tu Anh Dang was involved in data analysis and execution of some of the experiments. Laszlo Perlaky prepared the cell culture. Ching Lau pro-vided project direction and funding of this project, and participated in the preparation of the manuscript. Tsz-Kwong Man analysed the data and directed the study.
Acknowledgements
We thank Kwong-Kwok Wong and Carolyn Pena for reviewing the manu-script. This work is partially supported by NIH grant CA81465 (CL), Carl C. Anderson, Sr. and Marie Jo Anderson Charitable Foundation (TKM), and Robert J. Kleberg, Jr. and Helen C. Kleberg Foundation.
References
1. Baelde HJ, Cleton-Jansen AM, van Beerendonk H, Namba M, Bovee JV, Hogendoorn PC: High quality RNA isolation from tumours with low cellularity and high extracellular matrix component for cDNA microarrays: application to chondrosarcoma. J Clin Pathol 2001, 54:778-782.
2. Ren Q, Robertson SJ, Howe D, Barrows LF, Heinzen RA: Compar-ative DNA microarray analysis of host cell transcriptional responses to infection by Coxiella burnetii or Chlamydia tra-chomatis. Ann N Y Acad Sci 2003, 990:701-713.
3. Barbaric D, Dalla-Pozza L, Byrne JA: A reliable method for total RNA extraction from frozen human bone marrow samples taken at diagnosis of acute leukaemia. J Clin Pathol 2002,
55:865-867.
4. Stilgren LS, Rettmer E, Eriksen EF, Hegedus L, Beck-Nielsen H, Abra-hamsen B: Skeletal changes in osteoprotegerin and receptor activator of nuclear factor-kappab ligand mRNA levels in pri-mary hyperparathyroidism: effect of parathyroidectomy and association with bone metabolism. Bone 2004, 35:256-265. 5. Spruessel A, Steimann G, Jung M, Lee SA, Carr T, Fentz AK,
Spangen-berg J, Zornig C, Juhl HH, David KA: Tissue ischemia time affects gene and protein expression patterns within minutes follow-ing surgical tumor excision. Biotechniques 2004, 36:1030-1037. 6. Koh DC, Armugam A, Jeyaseelan K: Sputa nerve growth factor
forms a preferable substitute to mouse 7S-beta nerve growth factor. Biochem J 2004, 383:149-158.
7. Wong KK, Tsang YT, Shen J, Cheng RS, Chang YM, Man TK, Lau CC:
Allelic imbalance analysis by high-density single-nucleotide polymorphic allele (SNP) array with whole genome ampli-fied DNA. Nuclei Acid Res 2004, 32:e69.
8. Clarke W, Zhang Z, Chan DW: The application of clinical pro-teomics to cancer and other diseases. Clin Chem Lab Med 2003,
41:1562-1570.
9. Yip TT, Lomas L: SELDI ProteinChip array in oncoproteomic research. Technol Cancer Res Treat 2002, 1:273-280.
10. Banerjee S, Smallwood A, Chambers AE, Nicolaides K: Quantitative recovery of immunoreactive proteins from clinical samples following RNA and DNA isolation. Biotechniques 2003, 35:450-2, 454, 456.
11. Hong H, Dragan Y, Epstein J, Teitel C, Chen B, Xie Q, Fang H, Shi L, Perkins R, Tong W: Quality control and quality assessment of data from surface-enhanced laser desorption/ionization (SELDI) time-of flight (TOF) mass spectrometry (MS). BMC Bioinformatics 2005, 6(Suppl 2):S5.
12. Wong YF, Cheung TH, Lo KW, Wang VW, Chan CS, Ng TB, Chung TK, Mok SC: Protein profiling of cervical cancer by protein-biochips: proteomic scoring to discriminate cervical cancer from normal cervix. Cancer Lett 2004, 211:227-234.
13. Leimgruber RM, Malone JP, Radabaugh MR, LaPorte ML, Violand BN, Monahan JB: Development of improved cell lysis, solubiliza-tion and imaging approaches for proteomic analyses. Pro-teomics 2002, 2:135-144.