R E S E A R C H A R T I C L E
Open Access
Application of dynamic optimisation for
planning a haemodialysis process
Wojciech Stecz
1*, Radoslaw Pytlak
2, Aleksandra Rymarz
3and Stanislaw Niemczyk
3Abstract
Background: The aim of the study is to show that optimization tools can be used in planning the haemodialysis process in order to obtain the most effective treatment aimed at removing both urea and phosphorus. To this end we use the IV–compartment model of phosphorus kinetics.
Methods: The use of the IV–compartment model of phosphorus kinetics forces us to apply new numerical tools
which cope with a rebound phenomenon that can occur during haemodialysis. The proposed algorithm solves optimization problems with various constraints imposed on concentrations of urea and phosphorus.
Results: We show that the optimization tools are effective in planning haemodialysis processes aimed at achieving desired levels of urea and phosphorus concentrations at the end of these processes. One of the numerical
experiments reported in the paper concerns patients data who experienced a rebound phenomenon during haemodialysis due to a low level of phosphorus concentration.
Conclusion: In order to plan haemodialysis processes one should take into account the fact that these processes, in general, are described by different equations in different regions determined by phosphorus concentrations. This follows from the fact that mechanisms modelled by IV–compartment model are activated during dialysis. Therefore, advanced numerical tools have to be used in order to simulate and optimize these processes. The paper shows that these tools can be constructed and effectively applied in planning haemodialysis processes.
Keywords: Haemodialysis planning, Dynamic optimisation, IV-compartment model
Background
Hiperphosphatemia is associated with increased mortality among dialysis patients primarily due to accelerated car-diovascular disease (CVD) [1,2]. Altered calcium, phos-phorus and PTH levels which accompany chronic kidney disease, as well as an excessive burden of calcium supplied by calcium-based oral phosphorus binders are respon-sible for exaggerated vascular calcification and lead to enhanced atherosclerosis in this population [3].
European guidelines recommend lowering the phos-phorus level in the blood towards the normal range [4]. Serum phosphorus concentration in haemodialysis patients derives from phosphorus content in the diet, its elimination with residual renal function and its removal
*Correspondence:[email protected]
1Military University of Technology, Faculty of Cybernetics, Kaliskiego 2, 00-908 and Warsaw, Poland
Full list of author information is available at the end of the article
during haemodialysis (HD) sessions. Therefore, thera-peutic approaches focus on two directions: the usage of oral binders which decreases phosphorus absorption from the intestinum, as well as effective phosphorus elimina-tion by different modes of haemodialysis treatment. The problem for establishing the most efficient schedule of haemodialysis treatment is that the kinetics of phosphorus is much more complicated than other molecules such as urea or creatinine. During the first hour of an haemodial-ysis session, phosphorus concentration rapidly decreases, followed by a relatively stable level (plateau) until the end of haemodialysis. After haemodialysis the phospho-rus level increases rapidly reaching the predialytic level within 4–8 h [5]. Therefore the most effective strategy is to extend weekly dialysis time by enhancing the length of the sessions and/or by increasing the frequency of the sessions. It is estimated that the weekly dialysis time required to avoid the usage of oral binders is 18–30 h. Other methods such as increasing blood flow rate, greater
dialyzer size, increased dialysate flow rate are also used to increase phosphorus elimination however they are less effective [6].
Many mathematical models, from one to multi– compartment models, have been applied to describe phosphorus kinetics ([7–11]). During haemodialysis ses-sion phosphorus is removed from the plasma which is a compartment accessible for the treatment mode. The intradialytic plateau of phosphorus level suggests the exis-tence of second phosphorus storage which is inaccessible for the dialyser and provides a continuous inflow of phos-phorus resulting in the plateau of its level in the second part of haemodialysis. Therefore a two–pool model was proposed. However, it did not completely explain the constant phosphorus level during haemodialysis. There-fore Spalding et al. proposed a four-compartment model which suggested gradual phosphorus mobilization from the pools during dialysis [11]. Gotch et al proposed intra-cellular volume as a site of phosphorus storage [12]. Another conception of phosphorus kinetics assumes a pseudo I–compartment model where the phosphorus level during haemodialysis is determined by its clearance from distal compartment. The problem is that the rate of this clearance is dependent on the patient and clinical circumstances [13].
The aim of the study was to introduce advanced numeri-cal tools in planning the haemodialysis process in order to obtain the most effective treatment in removing urea and phosphorus as well. The mathematical model assumes the modified IV–compartment model of phosphorus kinetics. The organisation of the paper is as follows. “ Meth-ods” section gives the introduction to the haemodialysis problem. We concentrate on the mathematical models for urea and phosphorus kinetics. Next we present an opti-misation procedure that can be used for haemodialysis. In “Results” section we present some simulation and optimi-sation experiments. Last section discusses our results and possible future research directions.
Methods
Models of urea kinetics
The II–compartment model depicts a patient as a two– compartment system of different volumes of solutes that are regularly cleared, i.e., intracellular fluid and extracel-lular fluid. Between these solutes, diffusion of substances takes place according to different substances’ concentra-tions. II–compartment model is shown in Fig.1.
According to [11, 14] the equations describing II– compartment model are as follows:
dCECurea
dt =
Kurea IE ·
CICurea−CECurea
−Curea EC ·
KDurea+Krurea+Kufr
0.34·V(0)−UFR
(1)
dCureaIC
dt =
KIEurea·CureaEC −CICurea+Gurea
0.66·V(0) (2)
dUFR
dt =Uufr (3)
where:
UFR- ultrafiltration volume
Uufr- profile of the ultrafiltration rate Kufr- ultrafiltration coefficient
Kurea
r - urea clearance associated with residual renal func-tion
KDurea- dialyser clearance dCurea
EC
dt - variation of urea concentration in the extracellular fluid
dCureaIC
dt - variation of urea concentration in the intracellular fluid
KIEurea - diffusion speed between inner and outer cellular solute through a cellular membrane - the same in both directions
Gurea - urea generation in the human cells according to quick variations of ions during haemodialysis - unsur-veyed process, but was observed - we setGureato zero in our simulation and optimisation tests.
In the above equations we use the Watson formula ([15]) of intracellular to extracellular volume ratio of 2:1 (0.66·V(0) for intracellular volume and 0.34·V(0)for extracellular volume).
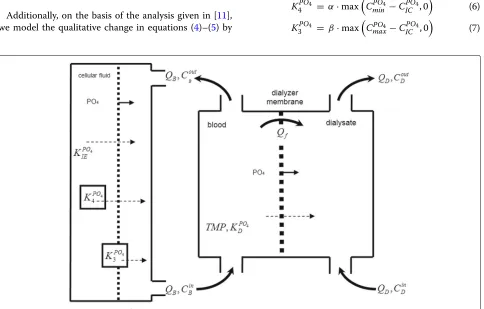
Models of phosphorus kinetics
In the paper we rely on the models described in the papers ([7,11,16]) presenting the phosphorus kinetics. We use especially Spalding’s IV–compartment model shown in Fig.2.
As far as phosphorus kinetics is concerned we have employed the model presented in ([7,11]):
dCPO4 EC
dt =
KPO4 IE ·(C
PO4
IC −C
PO4 EC )−K
PO4
D ·C
PO4 EC 0.34·V(0)−UFR +(4) KPO4
3 +K4PO4
dCPO4 IC
dt =
KPO4 IE ·(C
PO4
EC −C
PO4 IC )
0.66·V(0) (5)
where: dCPOEC4
dt - variation of phosphorus concentration in the extracellular fluid
dCPOIC4
dt - variation of phosphorus concentration in the intracellular fluid
KPO4
IE - diffusion speed between inner and outer cellular solute through a cellular membrane - the same in both directions
KPO4
D - phosphorus clearance coefficient in dialyzer KPO4
3 - phosphorus generation coefficient - used after
Fig. 1II-compartment kinetic model of toxins and substances
KPO4
4 - phosphorus generation coefficient - used after
exceeding the lower boundary of phosphorus concentra-tion for a healthy person
Additionally, on the basis of the analysis given in [11], we model the qualitative change in equations (4)–(5) by
the following algebraic equations (thereby, among other things, functions stated in [11] are continuous):
KPO4
4 = α·max
CPO4 min −C
PO4 IC , 0
(6)
KPO4
3 = β·max
CPO4
max−CICPO4, 0
(7)
where:
α,β - coefficients that describe the speed of return-ing the phosphorus concentrations to the initial levels.
KPO4
3 is activated only when a phosphorus level is below CPO4
max value (third compartment). AndK4PO4 is activated
only when a phosphorus level is belowCPO4
min respectively (fourth compartment).
Furthermore, we underline that a phosphorus clearance coefficientKPO4
D is a function of two parameters: prede-fined by producer phosphorus clearance of the dialyser membraneKPO4
D,base, and the clearance reduction coefficient
κfor the patient (in literature, one may see that from some group of patients there are suggested values ofκ[7,17], we assume valueκ =0.6 for hollow fiber dialyzers we used).
KPO4
D =κ·K
PO4
D,base. (8)
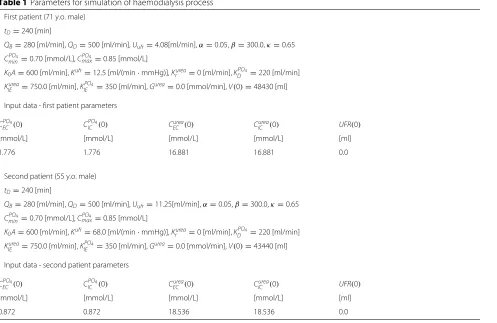
To check our model we used data of two patients such as: age, gender, body mass, height, serum urea and phosphorus levels, the dialyzers size, value of blood and dialysate flow during dialysis session, ultrafiltration vol-ume. On the basis of the data models parameters were determined for each patient by simulating equations (1)– (8) (see Table1). Hollow fiber dialyzers made by Allmed (Polypure series) or Gambro (Polyflux series) were used.
The study protocol was accepted by the local ethical committee. Each participant signed the informed consent.
Haemodialysis optimisation problem
The main optimisation problem considered in the paper is stated as follows. Having combined kinetic models of urea and phosphorus we look for proper concentrations of urea and phosphorus and the end of the haemodialy-sis process by controlling the parametersQB,QD,Uufr. In other words, by solving the optimal control problem we want to choose a proper dialysis membrane in order to achieve final parameters of haemodialysis.
That optimisation problem can be formulated as fol-lows:
min QB,QD,Uufr
CureaEC (tD) (9)
subject to the constraints (1)–(8), the following con-straints at final timetD
CECurea(tD) ≤LureaEC (10) CICurea(tD) ≤LureaIC (11)
LUFRmin ≤ UFR(tD) ≤LUFRmax, (12)
and the constraints on the control variables
Table 1Parameters for simulation of haemodialysis process
First patient (71 y.o. male)
tD=240 [min]
QB=280 [ml/min],QD=500 [ml/min],Uufr=4.08[ml/min],α=0.05,β=300.0,κ=0.65
CPO4
min=0.70 [mmol/L],C PO4
max=0.85 [mmol/L]
K0A=600 [ml/min],Kufr=12.5 [ml/(min·mmHg)],Krurea=0 [ml/min],KDPO4=220 [ml/min]
Kurea
IE =750.0 [ml/min],K PO4
IE =350 [ml/min],Gurea=0.0 [mmol/min],V(0)=48430 [ml]
Input data - first patient parameters
CPO4
EC (0) C PO4
IC (0) CECurea(0) CureaIC (0) UFR(0)
[mmol/L] [mmol/L] [mmol/L] [mmol/L] [ml]
1.776 1.776 16.881 16.881 0.0
Second patient (55 y.o. male)
tD=240 [min]
QB=280 [ml/min],QD=500 [ml/min],Uufr=11.25[ml/min],α=0.05,β=300.0,κ=0.65
CPO4
min=0.70 [mmol/L],CmaxPO4=0.85 [mmol/L]
K0A=600 [ml/min],Kufr=68.0 [ml/(min·mmHg)],Krurea=0 [ml/min],KDPO4=220 [ml/min]
Kurea
IE =750.0 [ml/min],K PO4
IE =350 [ml/min],Gurea=0.0 [mmol/min],V(0)=43440 [ml]
Input data - second patient parameters
CPO4
EC (0) C PO4
IC (0) CECurea(0) CureaIC (0) UFR(0)
[mmol/L] [mmol/L] [mmol/L] [mmol/L] [ml]
QminB ≤ QB(t) ≤QmaxB (13)
QminD ≤ QD(t) ≤QmaxD (14)
Uufrmin≤ Uufr(t) ≤Uufrmax, t∈[ 0,tD] , (15)
whereLureaEC andLureaIC mean maximum admissible values for urea concentrations.LUFRmin andLUFRmax mean minimum and maximum admissible values for the ultrafiltration.
QminB ,QmaxB , QminD ,QmaxD , Uufrmin,Uufrmaxdefine bound con-straints on decision variables, in particular Uufrmin, Uufrmax
limit the rate of ultrafiltration.
The stated optimisation problem is difficult to solve since it is defined by hybrid differential equations ([18, 19]). Hybrid systems are described by both discrete and con-tinuous variables—discrete variables indicate regions in which unique systems equations are applied, continuous variables are solutions to these equations. The model of haemodialysis has three discrete states which are defined by the phosphorus concentration threshold valuesCPO4 min and CPO4
max: if CPOIC4 has lower value than CminPO4 then the process is in the first discrete state; ifCPO4
IC is greater, or equal toCPO4
min but has lower value thanC PO4
maxthen we say that the process is in the second discrete state; eventually whenCPO4
IC assumes the values greater thanC PO4
max, the sys-tem is in the third discrete state. In each discrete state, the haemodialysis process is described by a different set of dif-ferential equations. The switch from one discrete state to another is trigged when one of the switching conditions is satisfied:CPO4
IC (ts) =C PO4
min, orCICPO4(ts)=C PO4
max, for some switching timets.
The numerical procedure which we used to solve the problem (9), (1)–(8),(10)–(15) is described, to much extent, in [20] and [21]. The main features of the proce-dure are:
a) it is based on the Radau IIa version of a Runge–Kutta method for integrating differential equations, b) it uses adjoint equations to evaluate gradients of
functions defining the optimization problem.
As far as the point a) is concerned we use a Runge–Kutta method in our optimisation procedure since we are deal-ing with optimal control problems and for these problems these integration procedures are the most suitable (the justification of that claim is given in Chapter 6 of [22]). Our optimisation method is based on the RADAU5 proce-dure ([23]) which we had to modify by incorporating into it subroutines for the location of switching pointsts.
Furthermore, we had to add to the RADAU5 procedure the subroutine for the consistent evaluation of adjoint equations associated with the equations which are used by the RADAU5 procedure for the evaluation of system equations. The second modification was needed in order to realize the feature b) of our method. In our opinion the
optimisation method for solving optimal ontrol problems with hybrid systems should follow the scheme in which at every optimisation procedure step system equations are solved first (due to the necessity of the switching points location) and then values and gradients of optimization functions are calculated. If we pursue the scheme we are in fact limited to the use of adjoint equations in gradient evaluations (more on that issue is in [20]).
The overview of our optimisation algorithm is as fol-lows:
1. Set initial values of the controlsu0 (u=(QB,QD,Uufr)) andk=0.
2. Integrate hybrid system equations for given initial conditions and the current controlsuk, while integrating system equations locate the switching points{tl
s}. Calculate values of all functionals which define the optimisation problem.
3. Evaluate adjoint equations for each optimisation problem’s functional. Having trajectories of adjoint equations evaluate gradients of the problem functionals.
4. On the basis of calculated gradients determine whether current controlsuksatisfy necessary optimality conditions. If this is the case then STOP, otherwise find new controlsuk+1(using some algorithm which refers to the gradients), increasek by one and go to Step 2.
Results
Simulation and optimisation results
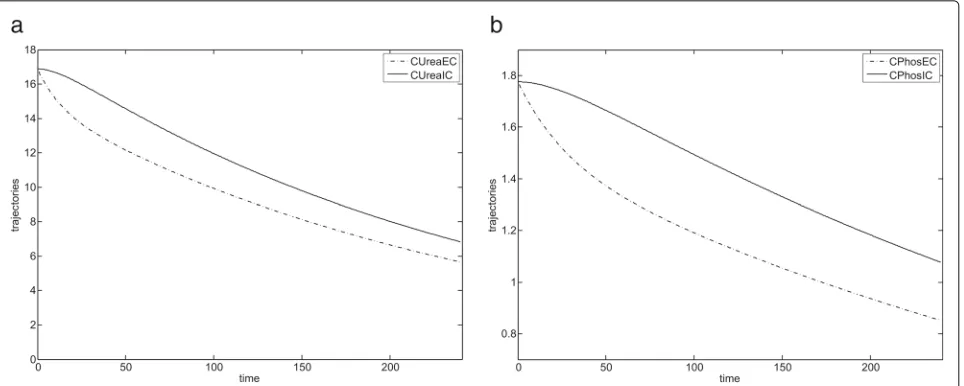
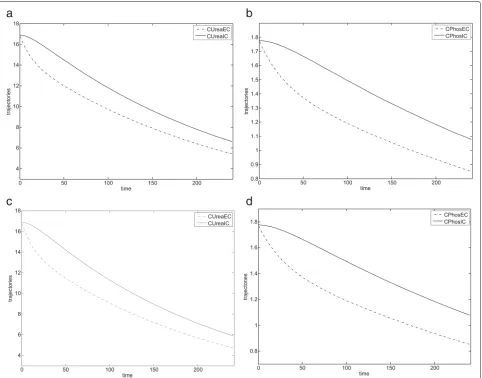
Both simulation and optimization were performed on the data of two patients. We first performed simulation of the model stated in the previous sections to verify its correct-ness and to analyse the relative behaviour of trajectories
CureaEC ,CICurea,CPO4
EC andC
PO4 IC .
The coefficients used in simulation are given in Table1. Notice that we assumed the following constant values for the control variables:QD = 500[ml/min] andQB = 280[ml/min]. A constant ultrafiltration rate (Uufr = 4.08[ml/min] for a first patient,Uufr=11.25[ml/min] for a second patient) was assumed throughout haemodialy-sis. These values, together with the other haemodialysis parameters, may be considered as typical.
Haemodialysis process simulation was conducted in
OpenModelica (which implements Modelica standard
Fig. 3Simulation results for IV-compartment model (first patient).aIV-compartment model presenting variations of urea concentration during haemodialysis.bIV-compartment model presenting variations of phosphorus concentration during haemodialysis
justifies our optimisation problem in which we only mini-mize the urea concentration at the end of the haemodial-ysis process (in that way we avoid solving more difficult multicriteria optimisation problem).
In the optimisation problem we used the model with the same coefficients as in the simulation experiment with the exception that control variables QD, QB, Uufr were not fixed but determined by the optimisation procedure outlined in the previous section.
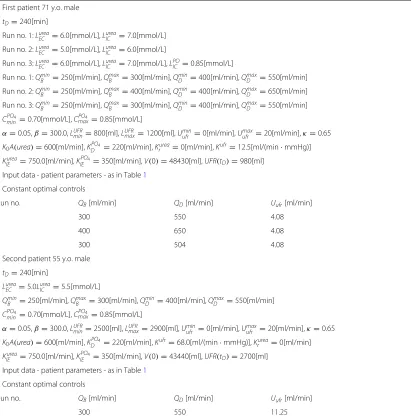
For the first patient three optimization problems were solved for different constraints imposed on control vari-ables – we changed the optimisation parameters such as
QminD ,QmaxD ,QBminandQmaxB . In the first run we setQmaxD =
550 [ml/min] andQmaxB = 300 [ml/min], in the second runQmaxD = 650 [ml/min] andQmaxB = 400 [ml/min]. In the second run we increased the control parametersQmaxD
andQmaxB to achieve assumed final concentrations of urea. We have observed that for the data of both patients, in order to minimise the objective function, the solver set the variable values (QB and QD) to the maxi-mum permissible values. It becomes obvious if we notice that we minimise the concentration of urea, so increasing the flow of fluids (blood and dialysate) is necessary.
However, the above conclusion is no longer valid when we impose additional constraints, for example on the value ofCPO4
IC at final timetD– in that case in addition to constraints (10)–(15) we impose the constraint (that case is stated in Table2as Run no. 3)
LPOIC ≤ CPO4
IC (tD). (16)
In the third optimization run the upper boundary QmaxD
is equal to 550 [ml/min] while the obtained optimal solution of QD is equal to 504 [ml/min]. This indicates
that there is a conflict between the removal of urea and achieving the desired level of phosphorus concentration at the end of haemodialysis - using optimisation can help to resolve it. On one hand the optimization pro-cedure tries to reach maximum level of QD in order to remove urea as much as possible, on the other hand the maximum levelQmaxD does not guarantee the desired level of phosphorus concentration, eventually the opti-mization procedure finds the compromise value of QD. It seems that this type of optimisation problem should be the important one, since the avoidance of low level of phosphorus concentration (and eventually the avoid-ance of rebound) is the important issue when planning haemodialysis.
As far as optimal values for the control Uufr are con-cerned, initially we assumed that Uufrmin = 0 [ml/min] and Uufrmax = 20 [ml/min] and the optimization pro-cedure found the following optimal trajectory for Uufr:
Uufr = 20.00 [ml/min] on the subinterval [ 0, 48),Uufr =
Table 2Parameters for optimisation of haemodialysis process
First patient 71 y.o. male
tD=240[min]
Run no. 1:Lurea
EC =6.0[mmol/L],LureaIC =7.0[mmol/L]
Run no. 2:Lurea
EC =5.0[mmol/L],LureaIC =6.0[mmol/L]
Run no. 3:Lurea
EC =6.0[mmol/L],LureaIC =7.0[mmol/L],LPOIC =0.85[mmol/L]
Run no. 1:Qmin
B =250[ml/min],QmaxB =300[ml/min],QminD =400[ml/min],QmaxD =550[ml/min]
Run no. 2:Qmin
B =250[ml/min],QmaxB =400[ml/min],QminD =400[ml/min],QmaxD =650[ml/min]
Run no. 3:Qmin
B =250[ml/min],QmaxB =300[ml/min],QminD =400[ml/min],QmaxD =550[ml/min]
CPO4
min=0.70[mmol/L],C PO4
max=0.85[mmol/L]
α=0.05,β=300.0,LUFRmin=800[ml],LUFRmax=1200[ml],Uminufr =0[ml/min],Umaxufr =20[ml/min],κ=0.65 K0A(urea)=600[ml/min],KDPO4=220[ml/min],Krurea=0[ml/min],Kufr=12.5[ml/(min·mmHg)]
KIEurea=750.0[ml/min],KPO4
IE =350[ml/min],V(0)=48430[ml],UFR(tD)=980[ml]
Input data - patient parameters - as in Table1
Constant optimal controls
Run no. QB[ml/min] QD[ml/min] Uufr[ml/min]
1 300 550 4.08
2 400 650 4.08
3 300 504 4.08
Second patient 55 y.o. male
tD=240[min]
LureaEC =5.0LureaIC =5.5[mmol/L]
QminB =250[ml/min],QmaxB =300[ml/min],QminD =400[ml/min],QmaxD =550[ml/min]
CPO4
min=0.70[mmol/L],C PO4
max=0.85[mmol/L]
α=0.05,β=300.0,LUFRmin=2500[ml],LUFRmax=2900[ml],Uminufr =0[ml/min],Umaxufr =20[ml/min],κ=0.65 K0A(urea)=600[ml/min],KPO4
D =220[ml/min],Kufr=68.0[ml/(min·mmHg)],Krurea=0[ml/min]
KIEurea=750.0[ml/min],KPO4
IE =350[ml/min],V(0)=43440[ml],UFR(tD)=2700[ml]
Input data - patient parameters - as in Table1
Constant optimal controls
Run no. QB[ml/min] QD[ml/min] Uufr[ml/min]
1 300 550 11.25
Although ultrafiltration could be modelled, we chose not to do so due to the its decreasing role in rou-tine clinical practice. However, the simulations allows using any profile of ultrafiltration to be modelled in the haemodialysis treatment.
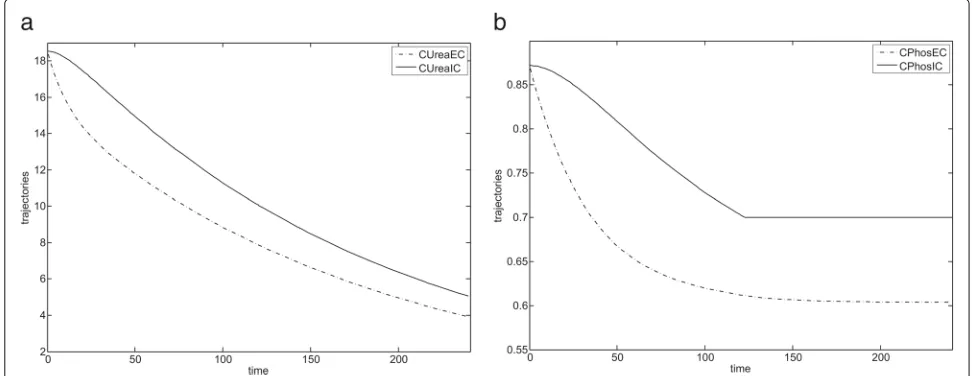
For the prescribed haemodialysis parameters and opti-mal control values, shown in Table2, the haemodialysis results for the first patient are shown in Fig.4. Dialysis for the first patient proceeded smoothly and the minimum concentration of phosphorusCPO4
min in the body was not exceeded.
During dialysis, second patient experienced a rebound phenomenon due to exceeding the minimum permissi-ble concentration of phosphorus in his body (CPO4
min)— the optimal trajectories obtained for the second patient are shown in Fig.5.
From these results, one can conclude that in order to achieve the optimal behaviour of haemodialysis (i.e. min-imise urea concentration) one could take constant values for QB and QD (dependent on patient and equipment parameters) – see optimal controls in Table2.
Figure 5 presents the optimal trajectories represent-ing parameter changes (CureaEC andCICurea) for the second patient. Notice that CECurea and CICurea steadily decrease althoughCPO4
IC assumes a constant value from some time. Furthermore, Fig.5reaffirms our earlier observation that by forcing concentrations ofCECureaandCICureato lie below some low values at the end of the haemodialysis process we also guarantee that concentrations ofCPO4
IC andC
PO4 EC steadily decrease.
Fig. 4Optimisation results for the first patient.aState trajectories for the ureaCurea
EC andCICureafor the first run.bState trajectories for the phosphorus
CPO4 IC andC
PO4
EC for the first run (c) State trajectories for the ureaCureaEC andCureaIC for the second run.dState trajectories for the phosphorusC PO4 IC and
CPO4
EC for the second run
phosphorus level is reached (at the level 0.70 [mmol/L]). In this case a phosphorus extraction mechanisms are acti-vated to preserve a phosphorus balance. It can be seen after 120 min of haemodialysis. From that time the value ofCPO4
IC does not change and the system exhibits a ’sliding mode’ during which it evolves – the details of the system behaviour in this mode are stated in [21].
A rebound process does not appear during urea removal. There is no body mechanism that pre-serves a minimum level of a toxic urea value. So, a proper balance of urea concentration is close to zero (theoretical value never gained because of nutrition process).
Discussion
In clinical practice, methods are required to assist nephrologists in the prescription and delivery of safe and
Fig. 5Optimisation results for the second patient.aState trajectories for the ureaCurea
EC andCureaIC .bState trajectories for the phosphorusC PO4 IC and
CPO4
EC (rebound ofC PO4
EC can be seen in 120 min of haemodialysis)
as a dynamic optimization problem. We using exist-ing physiological models of solute transport for different solutes, all imbedded within a simulation environment, in a way that results in plausible solutions to this difficult multicriteria optimization problem.
Our paper illustrates the use of this technique. We pre-sented the haemodialysis trajectories for two archetypal patients. The first represents a group that have a rather high level of phosphorus concentration at the start of dial-ysis with an intention to decrease levels to within, but not below, a clinically acceptable range. The second represents those with starting with a rather low concentration of phosphorus. We setQBandQDwithin acceptable ranges, and dialyser clearances to manufacturer specifications, as can be seen in Table 2. For the sake of simplicity, we set
Krurea(urea clearance associated with residual renal func-tion) to zero and urea generation during the dialysis to zero. Overall the simulations behaved appropriately and with adequate accuracy. The simulations demonstrated the expected interdependence between ultrafiltration pro-cess and the reduction of solute concentrations.
The results of our modelling show that in order to decrease the level of concentrations as much as possible we should use the maximal allowed QB andQD, which is not surprising. Our results also showed that the opti-mal strategy for solute removal is to maximize Uufr at the beginning of haemodialysis, which is also not surpris-ing since this is when the greatest solute mass is present in the blood. However, when we need to achieve a cer-tain reduction in urea concentrations but at the same time keep phosphorus concentrations above some prescribed level, these strategies are no longer appropriate and a dif-ferent set of values forQBandQDare required. For such patients, the use of dynamic optimization allowed us to
estimate these parameters in a reasonably precise manner to achieves a satisfactory reduction in urea concentra-tions, but at the same time resulting in a reduction in serum phosphate concentration that is not excessive. The use of a IV–compartment model in the simulation allowed detailed modelling of the time-concentration profile of phosphorus, and prediction of the presence, extent, and timing of rebound for given (in particular optimal)QBand QD. Under these conditions, our simulations showed sig-nificant rebound of phosphate between 120 and 180 min of haemodialysis.
Our experiment shows that it is feasible to develop a simple interface that uses in the background sophisti-cated numerical tools (such as numerical integrators for hybrid systems and optimisation procedures for optimi-sation problems with hybrid systems), with inputs from users that are no different from what is already undertaken in routine clinical care by medical staff while carrying out haemodialysis - routine patients’ parameters, and rou-tine haemodialysis operating parameter. The numerical procedures in OpenModelica can handle this dynamic optimization problem as a simulation with clear and com-prehensible results, although it would be better if this functionality in the software was available with sliding modes (unavailable at present). Furthermore, although we used plausible and generic inputs, the model can be indi-vidualised to any patient undergoing haemodialysis, with required inputs that can be guessed from cumulative clini-cal experience or even measuredKrurea,CPO4
EC (0),CureaEC (0), CPO4
min,CPOmax4,V(0),Gurea(0).
haemodialysis process. Our model contains parameters
α, β related to the rebound effect, these parameters should be estimated on a group of patients by performing the standard procedure for nonlinear regression mod-els ([25]): on a subgroup of patients these parameters are estimated by solving the corresponding nonlinear least squares problem (see [26], [27] for the descrip-tion of possible numerical procedures to carry out that task) and on the other subgroup of patients the perfor-mance of the calibrated model is examined. Note that results in ([7]) indicate that parameters related to rebound do not vary in models used in short and conventional haemodialysis treatments so these parameters could also be estimated individually for patients after performing a trial haemodialysis and then used in the subsequent haemodialyses. Secondly, clinical trials are needed to resolve doubts about negative consequences of perform-ing haemodialysis on the basis of solutions to optimisation problems. To this end stage patients used in clinical trials should be examined with respect to other profiles which are not directly included in optimisation models, such as pH andHCO3variation during dialysis ([28]), changes in potassium, sodium, calcium levels and in uremic toxins not routinely controlled in every day practice.
The proposed approach to haemodialysis planning could be applied with other kinetics models which contain parameters that can be measured for individual patients, or could be based on estimates valid across groups of patients (so these estimates could be provided after clini-cal trials on these groups). Therefore, we intend to extend the presented model by including in it a submodel pre-senting the nature and the rate of vascular refilling during haemodialysis and ultrafiltration. In [28] such a submodel is presented that links together plasma volume, interstitial volume and the protein concentrations in both compart-ments. Another extension of our model can incorpo-rate differential equations representing potassium kinet-ics and constraints related to a desired concentration of potassium at the end of haemodialysis (see, for example, [29]). It should be noticed that potassium concentration can exhibit rebound during haemodialysis ([30]) so the model which includes potassium kinetics is hybrid and our optimization procedure could cope with the problem extended in this way.
All the mentioned directions of planned future research concerning the proposed approach should help to imple-ment a coherent dialysis model suitable for use in real haemodialysis.
Conclusions
Parameters of the haemodialysis process are routinely determined on the basis of a model of the process and its simulation. Having a model of the process we can go further by employing simulations in optimization of a
haemodialysis process. The paper considers several opti-mization problems associated with haemodialysis and shows results of solving one of them. In that way the paper indicates that applying optimization in haemodialysis is possible and that it can lead to the process improvement.
Abbreviations
CVD: Cardiovascular disease; DOML: Dynamic optimization modeling language; HD: Haemodialysis; TBW: Total body water
Acknowledgements
We would like to thank Dr J.Smoszna for his help and support.
Authors’ contributions
WS built the haemodialysis model and carried out the model simulation. RP worked out the optimization model and optimization procedure, he also developed the optimization software. Both authors performed the optimization calculations. The substantive description of the model from the medical point of view and the discussion of the results were prepared by AR and SN. AR chose patient data for the purpose of checking the adequacy of the presented model. All authors have contributed to the preparation of the final version of the manuscript.
Authors’ information
Wojciech Stecz is an assistant professor at the Faculty of Cybernetics at Military University of Technology in Warsaw. He obtained his PhD at MUT in 2004 in the subject of information systems. Between 1997 and 1999 he was working at Institute of Command Systems Automation at MUT. From 2000 up to now he has been working as an assistant professor at Faculty of Cybernetics. He is an author of several articles in the scope of optimisation of the business processes in medicine, industry and logistics. He has been working as an ERP and the business processes consultant in industry, finance and military industry. e-mail: [email protected]
Radosław Pytlak is a Professor at Faculty of Mathematics and Information Science of Warsaw University of Technology. He teaches: modelling, simulation and optimisation of dynamical systems; numerical methods; theory and methods of nonlinear programming; scheduling. His interests lie mainly in dynamic optimisation and in algorithms for large scale optimisation problems. He is the author of two monographs published in Springer-Verlag: Numerical methods for optimal control problems with state constraints; Conjugate gradient algorithms in nonconvex optimisation. He published several papers in leading journals on optimisation such as: SIAM J. on Optimization; SIAM J. on Control and Optimization; Journal of Optimization Theory and Applications; Numerische Mathematik, European Journal of Operational Research, Optimization Methods & Software. e-mail: [email protected] Stanisłw Niemczyk is a Professor, Head of the Department of Internal Medicine, Nephrology and Dialysis, Military Institute of Medicine, Warsaw, Poland. He is a specialist in internal medicine, nephrology, endocrinology, clinical
transplantology and geriatrics. Project manager in many scientific subjects concerning dialysis techniques, endocrinology disorders in chronic kidney disease, protein energy-wasting and systemic vasculitis.
Aleksandra Rymarz is a specialist in internal medicine, nephrology and clinical transplantology. Lecturer in the Department of Internal Diseases, Nephrology and Dialysis, Military Institute of Medicine, Warsaw, Poland. Participant of many scientific subjects concerning dialysis techniques, endocrinology disorders in chronic kidney disease, protein energy-wasting and systemic vasculitis.
Funding
No funding was received for writing this study.
Availability of data and materials
Data sets generated and/or analysed during the current study are not publicly available because they are part of the medical records of the patients involved. Modelica models can be made available by the corresponding author upon reasonable request.
Ethics approval and consent to participate
Consent for publication Not applicable.
Competing interests
The authors declare that they have no competing interests.
Author details
1Military University of Technology, Faculty of Cybernetics, Kaliskiego 2, 00-908 and Warsaw, Poland.2Warsaw University of Technology, Faculty of
Mathematics and Information Science, Koszykowa 75, 00-662 Warsaw, Poland. 3Military Institute of Medicine, Szaserow 128, 04-141 Warsaw, Poland.
Received: 10 July 2018 Accepted: 3 June 2019
References
1. Natoli J, Boer R, Nathanson B, Miller R, Chiroli S, Goodman W, Belozeroff V. Is there an association between elevated or low serum levels of phosphorus, parathyroid hormone, and calcium and mortality in patients with end stage renal disease?. BMC Nephrol. 2013;17:14–88. 2. Tentori F, Blayney M, Albert J, Gillespie B, Kerr P, Bommer J, Young E,
Akizawa T, Akiba T, Pisoni R, Robinson B, Port F. Mortality risk for dialysis patients with different levels of serum calcium, phosphorus, and pth: the dialysis outcomes and practice patterns study (dopps). Am J Kidney Dis. 2008;52(3):519–30.
3. Copland M, Komenda P, Weinhandl E, McCullough P, Morfin J. Intensive hemodialysis, mineral and bone disorder, and phosphate binder use. Am J Kidney Dis. 2016;68(5S1):24–32.
4. KDIGO. Kdigo 2017 clinical practice guideline update for the diagnosis, evaluation, prevention, and treatment of chronic kidney disease-mineral and bone disorder (ckd-mbd). Kidney Int Suppl. 2017;7(1):1–56. 5. Minutolo R, Bellizzi V, Cioffi M, Iodice C, Giannattasio P, Andreucci M,
Terracciano V, Di Iorio B, Conte G, Nicola LD. Postdialytic rebound of serum phosphorus: pathogenetic and clinical insights. J Am Soc Nephrol. 2002;13:1046–54.
6. Daugirdas J. Removal of phosphorus by hemodialysis. Semin Dial. 2015;28(6):620–3.
7. Agar B, Akonur A, Ying-Cheng L. Kinetic model of phosphorus mobilization during and after short and conventional hemodialysis. Clin J Am Soc Nephrol. 2011;6(12):491–500.
8. Borah MF, Schoenfeld PY, Gotch FA. Nitrogen balance during intermittent dialysis therapy of uraemia. Kidney Int. 1978;14:2854–60. 9. Pohlmeier R, Vienken J. Phosphate removal and hemodialysis conditions.
Kidney Int. 2001;16:190–4.
10. Ratanarat R., Brendolan A., Volker G. Phosphate kinetics during different dialysis modalities. Blood Purif. 2005;23:83–90.
11. Spalding E, Chamney P, Farrington K. Phosphate kinetics during hemodialysis: Evidence for biphasic regulation. Kidney Int. 2002;61: 655–67.
12. Gotch F, Panlilio F, Sergeyeva O, Rosales L, Folden T, Kaysen G, Levin N. A kinetic model of inorganic phosphorus mass balance in hemodialysis therapy. Blood Purif. 2003;21(1):51–7.
13. Leypoldt J, Agar B, Culleton B. Simplified phosphorus kinetic modeling: predicting changes in predialysis serum phosphorus concentration after altering the hemodialysis prescription. Nephrol Dial Transplant. 2014;29(7):1423–9.
14. Lopot F. Evolution of mathematical methods for the assessement of dialysis adequacy. In: Filpot F, editor. Urea Kinetic Modelling vol. 4. 1st. Löddeköpinge: EDTNA-ERCA; 1990.
15. Watson P, Watson I, Batt R. Total body water volumes for adult males and females estimated from simple anthropometric measurements. Am J Clin Nutr. 1980;33:27–39.
16. Mieczkowski M, Lesniak K, Matuszkiewicz-Rowinska J. Potassium modeling during hemodialysis in patients with endstage renal disease -a pilot study. Nefrol Di-al Pol. 2012;78:80–4.
17. Gotch FA, Kotanko P, Handelman G. A kinetic model of calcium mass balance during dialysis therapy. Blood Purif. 2007;25:139–49.
18. Branicky MS, Borkar VS, Mitter SK. A unified framework for hybrid control: model and optimal control theory. IEEE Trans Autom Control. 1998;43: 31–45.
19. van der Schaft A, Schumacher H. An Introduction to Hybrid Dynamical Systems. London: Springer; 1989.
20. Pytlak R, Suski D. On solving hybrid optimal control problems with higher index daes. Optim Methods Softw. 2017;32:940–62.
21. Pytlak R., Suski D., Tarnawski T. Optimal control of hybrid systems with sliding modes. In: Awrejcewicz J., editor. Springer Proceedings in Mathematics and Statistics. Berlin: Springer; 2018. p. 283–93. 22. Pytlak R. Numerical Methods for Optimal Control Problems with State
Constraints. Lecture Notes in Mathematics 1707. Berlin: Springer; 1999. 23. Hairer E, Wanner G. Solving Ordinary Differential Equations II. Berlin:
Springer; 1996.
24. Modelica. A Unified Object-Oriented Language for Systems Modeling: Modelica Press; 2012.https://www.modelica.org/documents. 25. McCoy T, Castro V, Cagan A, Roberson A, Perlis R. Validation of a risk
stratification tool for fall related injury in a state wide cohort. BMJ Open. 2017;7:10–11362016012189.
26. Nocedal J, Wright S. Numerical Optimization. New York: Springer; 2006. 27. Pytlak R, Tarnawski T. Idos - (also) a web based tool for calibrating
modelica models. In: Proceedings of the 10th International Modelica Conference. Lund; 2014. p. 1095–1104.https://doi.org/10.3384/ ECP140961095.
28. Harris D, Yull E, Chester D. Correcting acidosis in hemodialysis: Effect on phosphate clearance and calcification risk. J Am Soc Nephrol. 1995;6: 1607–12.
29. Ciandrini A, Severi S, Grandi F, Mura C. Model-based analysis of potassium removal during haemodialysis. Artif Organs. 2009;33(10):835–43. 30. Ursio M, Donati G. Mathematical model of potassium profiling in chronic
dialysis. Contrib Nephrol. 2017;190:134–45.
Publisher’s Note