R E S E A R C H
Open Access
Triglycerides are a predictive factor for
arterial stiffness: a community-based
4.8-year prospective study
Xiaona Wang, Ping Ye
*, Ruihua Cao, Xu Yang, Wenkai Xiao, Yun Zhang, Yongyi Bai and Hongmei Wu
Abstract
Background:Epidemiological studies have disclosed an independent effect of triglycerides on coronary heart disease despite achievement of low-density lipoprotein cholesterol goals with statin therapy. Arterial stiffness has been increasingly recognized as a strong predictor of cardiovascular disease and atherosclerotic disease. The association between triglycerides and arterial stiffness is not well characterized. We aimed to determine the relationship between triglycerides and arterial stiffness in a community-based longitudinal sample from Beijing, China.
Methods:We related levels of plasma TGs to measures of arterial stiffness (carotid–femoral pulse wave velocity [PWV] and carotid–radial PWV) in 1447 subjects (mean age, 61.3 years) from a community-based population in Beijing, China.
Results:After a median follow-up interval of 4.8 years, multiple linear regression analysis revealed that TGs were independently associated with carotid–femoral PWV (β= 0.747,P< 0.001) and carotid-radial PWV (β= 0.367,
P= 0.001). In the group older than 65 years, the association between baseline TG levels and follow-up carotid– femoral PWV (β= 1.094,P= 0.001) and carotid-radial PWV (β= 0.524,P= 0.002) were strengthened. In forward stepwise multivariate logistic regression analysis, every SD increase in TGδwas associated with a 1.296-increased likelihood of the presence of carotid–femoral PWVδII (OR [per SD increase in TGδ]: 1.296; 95 % CI: 1.064 ~ 1.580;
P= 0.010) in Model 2, whereas the relationship between TGδand carotid-radial PWVδII disappeared. In addition, the relationship was strengthened between TGδand the presence of carotid–femoral PWVδII (OR 1.526, 95 % CI: 1.088–2.141,P= 0.014) in the group older than 65 years but not carotid-radial PWVδII. No association was noted in subjects younger than 65 years.
Conclusions:Lower triglyceride levels were significantly associated with decreases in carotid–femoral PWV, indicating that achieving low TG levels may be an additional therapeutic consideration in subjects with atherosclerotic disease.
Keywords:Triglycerides, Carotid–femoral pulse wave velocity, Carotid–radial pulse wave velocity
* Correspondence:[email protected]
Department of Geriatric Cardiology, Chinese PLA General Hospital, Fuxing Road #28, Beijing 100853, China
Background
Patients with cardiometabolic abnormalities remain at high risk of cardiovascular events when low-density lipo-protein cholesterol (LDL-C) goals are obtained. This residual risk is partially due to high TG levels despite achievement of LDL-C goals with statin therapy. Epi-demiological studies have disclosed an independent effect of triglycerides (TGs) on coronary heart disease (CHD) events in the presence of lower levels of high-density lipo-protein cholesterol (HDL-C) [1, 2], higher levels of LDL-C [1, 2] and T2DM [3, 4]. A decrease in initially elevated TG levels was associated with a decrease in CHD risk com-pared with stable high TG levels [5].
Arterial stiffness has been recognized as a strong pre-dictor of subclinical vascular disease as well as cardio-vascular mortality [6–9]. Great emphasis has been placed on the role of arterial stiffness, which can be noninvasively assessed via the measurement of pulse wave velocity (PWV) [10, 11]. Carotid-femoral PWV is the proven“gold standard”for arterial stiffness given the largest amount of epidemiological evidence for its pre-dictive value for CHD [12].
Whether arterial stiffening is associated with TGs in subjects is not well established. The present study inves-tigated the associations between TGs and measures of arterial stiffness (carotid–femoral PWV and carotid– ra-dial PWV) in a prospective community-dwelling popula-tion. We hypothesize that TGs are a predictive factor for arterial stiffness. In the present study, we examined the relationship between TGs and arterial stiffness by inves-tigating: (1) the predictive relationship of baseline TG levels with follow-up arterial stiffness; and (2) the rela-tionship between changes in TGs with changes in arterial stiffness in a large community-based longitudinal sample from China.
Methods Subjects
This paper analysed the association between TGs and ar-terial stiffness (carotid-femoral PWV and carotid-radial PWV) in a community-based cohort study of subjects living in the Pingguoyuan area of Beijing, China. After a routine health check-up between September 2007 and January 2009, a total of 1680 subjects were initially eligible for cross-sectional analysis. We prospectively followed this community-based population for the first time from February 1 to September 30, 2013. Complete follow-up data were obtained from 1499 subjects (follow-up rate 89.2 %), and 181 participants were lost during the period between the initiation of the study and the follow-up. No differences other that baseline risk factors were noted in those who completed baseline and follow-up assessments. Of these, 52 were excluded from analyses because of death; thus, 1447 participants were available for analysis.
The median follow-up interval for the original 1447 sub-jects was 4.8 years. During these visits, all participants re-ceived a questionnaire survey. Demographic information, a medical history, blood pressure measurements, and an-thropometric measurements were obtained. Fasting blood and urine samples were also collected. The study was ap-proved by the ethics committee of the People’s Liberation Army General Hospital, and each subject provided in-formed written consent.
Clinical data collection
Participants completed self-reporting standardized ques-tionnaires about lifestyle factors, prevalent diseases, family history, and medication use. Trained medical doctors eval-uated anthropometrics. Height (cm) was measured using a wall-mounted measuring tape, and weight (kg) was mea-sured using a digital scale without shoes. Systolic and dia-stolic blood pressures (SBP and DBP) were measured on the right arm twice in a sitting position after 5 min of rest.
Biomarker variable determination
Blood samples were collected from participants after over-night fast. Concentrations of fasting blood glucose (FBG), total cholesterol (TC), TGs, HDL-C, LDL-C were measured by the Roche enzymatic assays (Roche Diagnostics GmbH, Mannheim, Germany) on a Roche autoanalyzer (Roche Diagnostics, Indianapolis, IN, USA). All testing was per-formed in the same laboratory by well trained personnel following the criteria of the World Health Organization Lipid Reference Laboratories.
Assessment of arterial stiffness
Definition of variables
Smoking status was defined as smoking 1 or more ciga-rettes per day for at least 1 year. Non-HDL-C levels were calculated by the following equation: TG (mmol/L) -HDL-C (mmol/L). Body mass index (BMI) was calculated by the following equation: weight (kg)/height2 (m2). Waist–hip ratio was calculated by the following equation: waist circumference (cm)/hip circumference (cm). The estimated glomerular filtration rate (eGFR) was calculated using the following Chronic Kidney Disease Epidemiology Collaboration equation: eGFR = 141 × min (Scr/κ,1) α× max (Scr/κ, 1)-1.209× 0.993Age× 1.018 [if female] × 1.159 [if black], where Scr is plasma creatinine (mg/dL),κis 0.7 for females and 0.9 for males, α is −0.329 for females and
−0.411 for males, min indicates the minimum of Scr/κor 1, and max indicates the maximum of Scr/κor 1. Hyper-tension was defined as a mean SBP ≥140 mmHg, mean DBP ≥90 mmHg, both, or the use of antihypertensive medication. Diabetes mellitus (DM) was defined as a fast-ing glucose ≥7.0 mmol/L, glucose ≥11.1 mmol/L at 2 h after an oral 75 g glucose challenge, the use of antihyper-glycaemic medication, or both.
Statistical analyses
The characteristics were expressed as the median (inter-quartile range) or mean ± standard deviation (SD) for continuous variables and percentages for dichotomous variables. Follow-up carotid-femoral PWV was defined as elevated (≥12 m/s) or normal level (<12 m/s) [8]. Differences in the baseline levels of risk factors and clin-ical characteristics between subjects with elevated and normal carotid-femoral PWV over 4.8 years of follow-up were analysed using at-test for continuous variables and a chi-square test for categorical variables.
The Pearson correlation was used to describe the corre-lations between the baseline TG level and follow-up arter-ial stiffness. Multiple linear regression analysis were performed to evaluate the associations between baseline TG levels and follow-up arterial stiffness (dependent vari-ables: carotid-femoral PWV or carotid-radial PWV as a continuous variable; independent variables: age, gender, hypertension, DM, current smoking, levels of plasma TGs, non-HDL, LDL-C, SBP, DBP, FBG, BMI, weight, waist, waist–hip ratio and eGFR). As necessary, TG levels and other biomarkers were normalized by natural logarithm transformation.
We investigated the association of change in TG levels with the change in arterial stiffness (carotid-femoral PWVδI vs. carotid-femoral PWVδII; carotid-radial PWVδI vs. carotid-radial PWVδII) with logistic regression models. The change in TG levels was expressed as TGδ (TGfollow-up -TGbaseline). The change in arterial stiffness was expressed as PWVδ (PWVfollow-up-PWVbaseline). PWVδ was categorized as PWVδI (PWVfollow-up-PWVbaseline<0) and PWVδII
(PWVfollow-up-PWVbaseline≥0). Forward stepwise multivari-ate logistic regression analysis was performed to evalumultivari-ate odds ratios (OR) and 95 % confidence intervals (CI). Regression models were adjusted for age and gender (model 1) as well as hypertension, DM, current smoking, change in TGs, change in non-HDL-C, change in LDL-C, change in SBP, change in DBP, change in BMI, change in weight, change in waist, change in waist–hip ratio and change in eGFR (model 2).
Receiver operating characteristic (ROC) curves were used to assess the ability of the baseline TG level indices to predict arterial stiffness assessed by carotid-femoral PWV and carotid-radial PWV.
All analyses were conducted using SPSS software for Windows, version 13.0 (SPSS, Chicago, IL, USA). We used Bonferroni correetion for multiple testing.P-values <0.05 were considered statistically significant.
Results
Clinical characteristics of the subjects categorized by gender
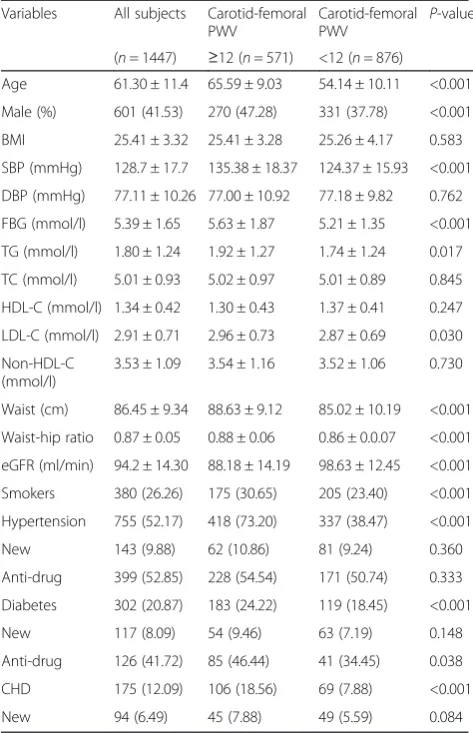
Altogether, we included 1447 subjects in the present study. The baseline characteristics of the study popula-tion according to carotid-femoral PWV groups (elevated or normal) are summarized in Table 1. The mean age (±SD) in the study was 61.30 ± 11.4 years. Older age, male gender, hypertension, DM, CHD, current smoking, higher SBP, higher waist, higher waist-hip ratio, higher FBG, higher TG and LDL-C levels, and lower eGFR levels were significantly associated with elevated carotid-femoral PWV.
Association of baseline TG with follow-up arterial stiffness
Age (r= 0.528; P< 00.001), SBP (r= 0.325; P< 0.001), Waist (r= 0.187; P< 0.001), waist –hip ratio (r= 0.084; P= 0.002), FPG (r= 0.129; P< 0.001) and TGs (r= 0.093; P= 0.001, Fig. 1) were significantly and posi-tively related to carotid-femoral PWV, but DBP (r=
−0.003; P= 0.904), weight (r= 0.007; P= 0.787), BMI (r= 0.011; P= 0.687), TC (r= 0.020; P= 0.457) and (r= 0.033; P= 0.233) were not. Non-HDL-C (r=−0.090;P= 0.001) and eGFR (r=−0.384; P< 0.001) were inversely related to carotid-femoral PWV.
SBP (r= 0.102; P< 0.001), DBP (r= 0.209; P< 0.001), weight (r= 0.171; P< 0.001), waist (r= 0.068; P= 0.016) and TGs (r= 0.089; P< 0.001, Fig. 2) were significantly and positively related to carotid-radial PWV, but age (r= 0.168; P= 0.245), BMI (r= 0.032; P= 0.238), waist– hip ratio (r= 0.082; P= 0.159), TC (r= 0.037; P= 0.180) and LDL-C (r= 0.062;P= 0.0.025) were not. Non-HDL-C (r=−0.073 = 0.007) was inversely related to carotid-radial PWV.
arterial stiffness are summarized in Table 2. In multivari-able linear regression analysis, baseline TG levels were positively and independently associated with follow-up carotid-femoral PWV (β= 0.747, P< 0.001) and carotid-radial PWV (β= 0.367, P= 0.001), respectively. Further-more, non-HDL-C, hypertension, diabetes (β= 0.623,P= 0.007), BMI and fasting blood glucose were positively and independently associated with carotid-femoral PWV, older age, LDL-C, SBP and weight; weakly associated with follow-up carotid-femoral PWV, and eGFR; and negatively associated with follow-up carotid-femoral PWV. Being male (β= 0.456,P= 0.001) was positively associated with follow-up carotid-radial PWV.
Subsequently, a subgroup analysis according to subject age was conducted (Table 2). In the group older than 65 years, the association between baseline TG levels and follow-up carotid-femoral PWV (β= 1.094, P= 0.001) and carotid-radial PWV (β= 0.524,P= 0.002) in multivariable
linear regression analysis were strengthened. However, in subjects younger than 65 years, none of the follow-up ar-terial stiffness measures were significantly related to base-line TG.
The receiver operating characteristic (ROC) curves for assessing the TG level indices as predictors of arterial stiffness assessed by femoral PWV and carotid-radial PWV are presented in Figs. 3 and 4.
Table 1Baseline characteristics of the subjects Variables All subjects Carotid-femoral
PWV
Carotid-femoral
PWV P
-value
(n= 1447) ≥12 (n= 571) <12 (n= 876)
Age 61.30 ± 11.4 65.59 ± 9.03 54.14 ± 10.11 <0.001
Male (%) 601 (41.53) 270 (47.28) 331 (37.78) <0.001
BMI 25.41 ± 3.32 25.41 ± 3.28 25.26 ± 4.17 0.583
SBP (mmHg) 128.7 ± 17.7 135.38 ± 18.37 124.37 ± 15.93 <0.001
DBP (mmHg) 77.11 ± 10.26 77.00 ± 10.92 77.18 ± 9.82 0.762
FBG (mmol/l) 5.39 ± 1.65 5.63 ± 1.87 5.21 ± 1.35 <0.001
TG (mmol/l) 1.80 ± 1.24 1.92 ± 1.27 1.74 ± 1.24 0.017
TC (mmol/l) 5.01 ± 0.93 5.02 ± 0.97 5.01 ± 0.89 0.845
HDL-C (mmol/l) 1.34 ± 0.42 1.30 ± 0.43 1.37 ± 0.41 0.247
LDL-C (mmol/l) 2.91 ± 0.71 2.96 ± 0.73 2.87 ± 0.69 0.030
Non-HDL-C (mmol/l)
3.53 ± 1.09 3.54 ± 1.16 3.52 ± 1.06 0.730
Waist (cm) 86.45 ± 9.34 88.63 ± 9.12 85.02 ± 10.19 <0.001
Waist-hip ratio 0.87 ± 0.05 0.88 ± 0.06 0.86 ± 0.0.07 <0.001
eGFR (ml/min) 94.2 ± 14.30 88.18 ± 14.19 98.63 ± 12.45 <0.001
Smokers 380 (26.26) 175 (30.65) 205 (23.40) <0.001
Hypertension 755 (52.17) 418 (73.20) 337 (38.47) <0.001
New 143 (9.88) 62 (10.86) 81 (9.24) 0.360
Anti-drug 399 (52.85) 228 (54.54) 171 (50.74) 0.333
Diabetes 302 (20.87) 183 (24.22) 119 (18.45) <0.001
New 117 (8.09) 54 (9.46) 63 (7.19) 0.148
Anti-drug 126 (41.72) 85 (46.44) 41 (34.45) 0.038
CHD 175 (12.09) 106 (18.56) 69 (7.88) <0.001
New 94 (6.49) 45 (7.88) 49 (5.59) 0.084
BMIbody mass index,SBPsystolic blood,DBPdiastolic blood pressure,FBGfast blood glucose,TGtriglyceride,TCtotal cholesterol,HDL-Chigh- density lipoprotein cholesterol,LDL-Clow-density lipoprotein cholesterol,eGFR
estimated glome-rular filtration rate,CHDcoronary heart disease,PWV
pulse-wave velocity
Fig. 1Relation between TGs and cf-PWV. The Pearson’s correlation was used to describe the relationships between TGs and cf-PWV. cf-PWV was positive relationship with TGs in 1447 subjects. cf-PWV, carotid–femoral pulse wave velocity; TGs, Triglycerides; X-axis: the value of TGs (mmol/L); Y-axis: the value of cf-PWV (ms−1); r, coefficient of Pearson’s correlation;
P< 0.001 with statistical significance
Fig. 2Relation between TGs and cr-PWV. The Pearson’s correlation was used to describe the relationships between TGs and cr-PWV. cr-PWV was positive relationship with TGs in 1447 subjects. cr-PWV, carotid–radial pulse wave velocity; TGs, Triglycerides; X-axis: the value of TGs (mmol/L); Y-axis: the value of cr-PWV (ms−1); r, coefficient of Pearson’s correlation;
Effect of change in TG on change in arterial stiffness
The relationship between the change in the TG levels (TGδ) and the change in the carotid-femoral PWV (ca-rotid-femoral PWVδI vs. carotid-femoral PWVδII) is presented in Table 3. The presence of carotid-femoral PWVδII (OR 1.107, 95 % CI: 1.039 ~ 1.299, P= 0.012)
was significantly related to TGδ in the unadjusted model. In the adjusted models (1 and 2), the association of TGδ with carotid-femoral PWVδII remained statisti-cally significant. Each SD increase in TGδwas associated with a 1.296-increased likelihood of the presence of carotid-femoral PWVδII (OR [per SD increase in TGδ]:
Table 2Multiple linear regression analysis of baseline parameters and follow-up arterial stiffness
Carotid–femoral PWV Carotid–radial PWV
β CI P-value β CI P-value
All subjects (n= 1447)
Age 0.097 0.078 ~ 0.116 <0.001 −0.025 −0.037 ~−0.012 <0.001
Male 0.253 0.180 ~ 0.686 0.252 0.456 0.179 ~ 0.734 <0.001
Smoking 0.081 −0.261 ~ 0.424 0.641 0.049 −0.170 ~ 0.269 0.659
Diabetes 0.623 0.171 ~ 1.076 0.007 0.232 0.058 ~ 0.522 0.117
Hypertension 0.444 0.083 ~ 0.805 0.016 0.018 0.014 ~ 0.149 0.881
TGa 0.747 0.394 ~ 1.100 <0.001 0.367 0.140 ~ 0.593 0.002
Non-HDL-C 1.672 0.629 ~ 2.715 0.002 0.173 0.062 ~ 0.409 0.149
LDL-C 0.453 0.001 ~ 0.905 0.049 0.020 −0.269 ~ 0.310 0.892
SBP 0.040 0.028 ~ 0.052 <0.001 0.007 0.001 ~ 0.014 0.074
DBP −0.041 −0.060 ~−0.022 <0.001 0.012 0.001 ~ 0.024 0.047
Weight 0.037 0.006 ~ 0.068 0.021 0.005 −0.016 ~ 0.025 0.657
BMI 0.160 0.073 ~ 0.246 <0.001 0.055 0.002 ~ 0.109 0.058
Waist 0.011 0.024 ~ 0.047 0.521 0.005 0.008 ~ 0.038 0.621
Waist–hip ratio 1.876 0.946 ~ 3.698 0.140 0.331 0.038 ~ 1.169 0.790
FBG 0.127 0.021 ~ 0.234 0.019 0.051 −0.017 ~ 0.119 0.143
eGFRa −1.672 −2.715 ~−0.629 0.002 0.084 −0.584 ~ 0.753 0.754
Subjects older than 65 years (n= 625)
Age 0.091 0.045 ~ 0.137 <0.001 −0.032 −0.056 ~−0.008 0.009
Male 0.308 0.059 ~ 1.372 0.408 0.029 −0.354 ~ 0.413 0.881
Hypertension 0.409 −0.148 ~ 0.966 0.138 −0.020 −0.311 ~ 0.272 0.894
Diabetes 0.664 0.019 ~ 1.346 0.057 −0.158 −0.516 ~ 0.199 0.385
Smoking 0.097 −0.456 ~ 0.650 0.732 −0.068 −0.358 ~ 0.221 0.644
TGa 1.094 0.449 ~ 1.738 0.001 0.524 0.186 ~ 0.861 0.002
Non-HDL-C 1.166 −2.574 ~ 1.965 0.174 −0.202 −1.840 ~ 1.436 0.809
LDL-C 0.364 0.013 ~ 1.191 0.388 0.053 −0.380 ~ 0.486 0.810
SBP 0.042 0.025 ~ 0.059 <0.001 0.010 0.001 ~ 0.019 0.026
DBP −0.052 −0.082 ~−0.023 0.001 0.001 −0.015 ~ 0.016 0.928
Weight 0.056 0.004 ~ 0.109 0.036 0.034 0.007 ~ 0.062 0.002
BMI 0.249 0.103 ~ 0.394 0.001 0.123 0.047 ~ 0.200 0.002
Waist 0.039 0.020 ~ 0.079 0.507 0.002 −0.027 ~ 0.035 0.779
Waist–hip ratio 1.745 0.035 ~ 3.004 0.066 1.022 −1.988 ~ 4.561 0.541
FBG 0.148 −0.045 ~ 0.341 0.132 0.074 −0.712 ~ 0.860 0.853
eGFRa −1.323 −2.631 ~ 0.242 0.083 0.063 −0.712 ~ 0.869 0.847
TGtriglyceride,non-HDL-Cnon-high-density lipoprotein cholesterol,LDL-Clow-density lipoprotein cholesterol,SBPsystolic blood pressure,DBPdiastolic blood pressure,BMIbody mass index,FBGfast blood glucose,eGFRestimated glomerular filtration rate,PWVpulse wave velocity
a
: natural logarithm transformed
1.296; 95 % CI: 1.064 ~ 1.580; P= 0.010) (Model 2, Table 3). In addition, the relationship was strengthened between TGδ and the presence of carotid-femoral PWVδII (OR 1.526, 95 % CI: 1.088–2.141, P= 0.014) in the group older than 65 years (Model 2) but not for carotid-radial PWVδII. No association was noted in sub-jects younger than 65 years.
Discussion
This is the first study to observe the relationship between levels of TGs and carotid-femoral PWV in a community-based prospective sample. In the present longitudinal study, we found an association between baseline TGs and follow-up arterial stiffness independent of age, gender and other vascular risk factors, primarily in the oldest subjects. We also identified an association between the change in TGs and the change in carotid-femoral PWV, which indi-cates that achieving low TG levels may be an additional therapeutic consideration in subjects with atherosclerotic disease.
Several large statin trials and meta-analyses have dem-onstrated a reduction in LDL-C and cardiovascular mor-bidity and mortality. Some trials have also highlighted the significance of residual cardiovascular risk after treatment of LDL-C to target levels. Even at the LDL-C goal, patients with cardiometabolic abnormalities remain at high risk of cardiovascular events. This residual risk is partially due to high TG levels despite achievement of LDL–C goals with statin therapy. Evidence from prospective studies of the TG association supports a stronger association with CVD risk in people with lower levels of HDL-C [1, 2], higher LDL-C [1, 2] and T2DM [3, 4]. In addition, few studies have reported the association of TG levels with arterial stiffness, and the results were controversial. Henna et al. found an association between TG and arterial stiffness index in non-pregnant women even after adjustment for HDL-C and other risk factors [14]. Recently, a study [15] including 537 subjects found that TG levels were signifi-cantly associated with arterial stiffness as measured by brachial-ankle PWV in both genders. Dabelea et al. did not identify a significant relationship between baseline TG levels and arterial stiffness as measured by PWV over Fig. 3Receiver operating characteristic (ROC) curves of baseline TGs
indices to predict cf- PWV. ROC analysis was performed to determine the sensitivity and specificity of the value of the area under the curve (AUC)
Fig. 4Receiver operating characteristic (ROC) curves of baseline TGs indices to predict cr- PWV. ROC analysis was performed to determine the sensitivity and specificity of the value of the area under the curve (AUC)
Table 3Logistic regression analysis for the association between change in TG and change in carotid–femoral PWV
Carotid-femoral PWVδII
TGδ
OR 95 % CI PValue
All subjects (n= 1447)
Unadjusted 1.107 1.039 ~ 1.299 0.012
Model 1 1.180 1.041 ~ 1.396 0.033
Model 2 1.296 1.064 ~ 1.580 0.010
Subjects older than 65 years (n= 625)
Unadjusted 1.312 1.057 ~ 1.745 0.002
Model 1 1.409 1.045 ~ 1.899 0.025
Model 2 1.526 1.088 ~ 2.141 0.014
TGtriglyceride,TGδchange in TG,PWVpulse wave velocity,PWVδII
PWVfollow-up-PWVbaseline≥0,ORodds ratio,CIconfidence interval model 1: age and gender
time, whereas they reported that an increase in TG levels of 48 mg/dL resulted in a 1.0 % increased PWV (P= 0.0483) [16].
The discrepancies among previous studies can be attrib-uted to the following factors. First, the study subjects were different. The present study (the average TG level was 1.80 ± 1.24 mmol/L) was based on a community sample in which selection biases were inherently low, unlike previ-ous studies that selected subjects with metabolic syn-drome or diabetes [15, 16]. Second, our study population is relatively old, with approximately half of the subjects being ≥65 years of age. The steepest rise of transmural pressure-induced arterial wall damage occurs after the age of 60 years [17–19], leading to the strengthening of ill effects by other risk factors in older subjects. In addition, elderly subjects had an increased presence of other vascu-lar risk factors, which may increase the susceptibility to the influence of arterial stiffness via interaction with TGs [20]. Third, the measurement of arterial stiffness was dif-ferent. Arterial stiffness was measured by brachial-ankle PWV in previous studies and response of central and peripheral carotid-femoral PWV, which has no predictive value in patients with end-stage renal disease (ESRD) [21]. In the present study, arterial stiffness was assessed via the measurement of carotid-femoral PWV, which is a direct measurement of the central artery with the largest amount of epidemiological evidence for its predictive value of CV events [9]. Fourth, the present study repeatedly measured risk factors (e.g., TGs) and each participant’s outcome (e.g., arterial stiffness) that would change with time, unlike previous studies based on cross-sectional design, which could not determine whether TGs are a predictive factor for arterial stiffness.
The main finding of this study was that a higher level of TGs was an independent predictor of carotid-femoral PWV. Several potential mechanisms support TGs as a biomarker of carotid-femoral PWV risk given the role of TG-rich lipoproteins. Following the hydrolysis of exogen-ously derived chylomicrons or endogenexogen-ously secreted very-low-density lipoproteins, cholesterol-enriched remnant by-products enter the subendothelial space [22]. Indirectly, elevated TGs impairs the capacity of high density lipopro-tein to deliver cholesteryl esters, which may promote ath-erosclerosis via the scavenger receptor class B Type I (SR-BI) [23]. Moreover, cross-sectional studies [24–27] found that enhanced arterial stiffness in hypertriglyceridaemic states might be partly attributed to triglyceride-related LDL atherogenicity, such as small, dense LDL particles and oxi-dative modification of LDL. Hypertriglyceridemia-induced proinflammatory and oxidative milieu may further enhance adhesion molecule expression, increase foam cell forma-tion, and increase the toxicity of smooth muscle [28, 29]. Hypertriglyceridemia also stimulates the release and/or expression of endothelial mediators in vitro, such as
endothelin-1, which significantly promotes endothelial dys-function, a critical early step in the development of arterio-sclerosis [30–32].
Additionally, we found that change in TGs was associ-ated with change in carotid-femoral PWV among subjects, indicating that lower plasma TG levels were associated with decreases in carotid-femoral PWV. The result was consistent with those reported by previous studies. As pre-viously shown, decreased TG levels were independently associated with a reduced risk of CHD events compared with stable high triglyceride levels [33]. Moreover, in the PROVE IT-TIMI 22 trial, on-treatment TGs <150 mg/dl dramatically affects CHD events after adjustment of LDL-C levels [22]. These data lend support to the concept that achieving low TG levels may be an additional therapeutic consideration in subjects with atherosclerotic disease. Furthermore, we also observed that change in TGs was positively associated with change in carotid-femoral PWV but not with change in carotid-radial PWV. This effect may be attributed to the different morphology, material properties, and mechanical behaviour of the arterial wall [34–36]. In an experimental study of minipigs, athero-sclerotic lesions were structurally heterogeneous, aniso-tropic, and incompressible [37]. All of these results can be explained by the theory that the composition of arterial wall material (smooth muscle cells and extracellular matrix, mainly collagenous tissue) is a strong determinant of PWV and extent of atherosclerosis [38].
In this study, we also found that age, hypertension, dia-betes, non-HDL-C, FBG and BMI were positively and in-dependently associated with carotid-femoral PWV. These results are consistent with those reported by previous studies [39]. The association between BMI and carotid-femoral PWV can be attributed to the following factors. First, insulin resistance, which accompanies abdominal obesity, has vascular effects through associated hyperinsu-linaemia and increased glycaemia [40, 41]. Second, ab-dominal obesity might contribute to carotid-femoral PWV through inflammation [42].
The present study has limitations. First, a significant proportion of subjects (181, 10.7 %) were excluded due to loss to follow-up. This loss is a well-known and unavoid-able limitation of epidemiological studies, which may be biased towards the null hypothesis. Second, the present study was based on subjects from Beijing communities; therefore, the conclusions may not represent Chinese individuals from other ethnic groups.
Conclusion
Ethics approval and consent to participate
The study was approved by the ethics committee of the People’s Liberation Army General Hospital, and each sub-ject provided informed written consent.
Abbreviations
cf-pwv:arotid–femoral pulse wave velocity; cr-pwv: carotid–radial pulse wave velocity; LDL-C: low-density lipoprotein cholesterol; TC: total cholesterol; TGs: triglycerides; CHD: coronary heart disease; HDL-C: high-density lipoprotein cholesterol; FBG: fasting blood glucose; eGFR: estimated glomerular filtration rate; BMI: body mass index; DM: diabetes mellitus; SBP: systolic blood; DBP: diastolic blood pressure; ESRD: end-stage renal disease; SR-BI: scavenger receptor class B Type I.
Competing interests
The authors declare that they have no competing interests.
Authors’contributions
XW and PY designed the study; RC, XY, WX, YZ and HW participated in acquisition of data; XW, PY and YB researched and evaluated the literature; XW undertook the statistical analysis and wrote the first draft of the manuscript. All authors read and approved the final manuscript.
Acknowledgements
Acknowledgments and disclosures: We thank colleagues at the Department of Laboratory Medicine, the PLA General Hospital for help with biochemical measurements. We are also grateful to all study participants for their participation in the study. This research is supported by the grant from the Key National Basic Research Program of China (2012CB517503,
2013CB530804) and the Key Science and Technology Foundation of China (2012ZX09303004-002) to Dr. Ping Ye.
Received: 6 November 2015 Accepted: 11 May 2016
References
1. Criqui MH, Heiss G, Cohn R, et al. Plasma triglyceride level and mortality from coronary heart disease. N Engl J Med. 1993;328:1220–5. 2. Laakso M, Lehto S, Penttila I, et al. Lipids and lipoproteins predicting
coronary heart disease mortality and morbidity in patients with non-insulin-dependent diabetes. Circulation. 1993;88:1421–30.
3. West KM, Ahuja MM, Bennett PH, et al. The role of circulating glucose and triglyceride concentrations and their interactions with other“risk factors”as determinants of arterial disease in nine diabetic population samples from the WHO multinational study. Diabetes Care. 1983;6:361–9.
4. Fontbonne A, Eschwége E, et al. Hypertriglyceridaemia as a risk factor of coronary heart disease mortality in subjects with impaired glucose tolerance or diabetes: results from the 11-year follow-up of the Paris Prospective Study. Diabetologia. 1989;32:300–4.
5. McBride P. Triglycerides and risk for coronary artery disease. Curr Atheroscler Rep. 2008 ;10(5):386-90.
6. van Popele NM, Grobbee DE, Bots ML, et al. Association between arterial stiffness and atherosclerosis: the Rotterdam Study. Stroke. 2001;32:454–60. 7. Zureik M, Temmar M, Adamopoulos C, et al. Carotid plaques, but not
common carotid intimamedia thickness, are independently associated with aortic stiffness. J Hypertens. 2002;20:85–93.
8. Blacher J, Guerin AP, Pannier B, et al. Impact of aortic stiffness on survival in end-stage renal disease. Circulation. 1999;99:2434–9.
9. Laurent S, Boutouyrie P, Asmar R, et al. Aortic stiffness is an independent predictor of all-cause and cardiovascular mortality in hypertensive patients. Hypertension. 2001;37:1236–41.
10. Avolio AP, Chen S, Wang R, et al. Effects of aging on changing arterial compliance and left ventricular load in a northern Chinese urban community. Circulation. 1983;68:50–8.
11. Asmar R, Benetos A, Topouchian J, et al. Assessment of arterial distensibility by automatic pulse wave velocity measurement: validation and clinical application study. Hypertension. 1995;26:485–90.
12. Laurent S, Cockcroft J, Van Bortel L, et al. Expert consensus document on arterial stiffness: methodological issues and clinical applications. Eur Heart J. 2006;27:2588–605.
13. McEniery C, Cockcroft JR. Does arterial stiffness predict atherosclerotic coronary events? Adv Cardiol. 2007;44:160–72.
14. Henna K, Heli S, Pirjo V, et al. Carotid artery elasticity decreases during pregnancy - the Cardiovascular Risk in Young Finns study. BMC Pregnancy Childbirth. 2014;14:98. doi:10.1186/1471-2393-14-98. Published online 2014 Mar 6.
15. Kim HL, Lee JM, Seo JB, et al. The effects of metabolic syndrome and its components on arterial stiffness in relation to gender. J Cardiol. 2015;65(3):243–9.
16. Dabelea D, Talton JW, D’Agostino Jr R, et al. Cardiovascular risk factors are associated wi-th increased arterial stiffness in youth with type 1 diabetes: the SEARCH CVD study. Diabetes Care. 2013;36(12):3938–43.
17. Franklin SS, Gustin 4th W, Wong ND, et al. Hemodynamic patterns of age-related changes in blood pressure. The Framingham Heart Study. Circulation. 1997;96:308–15.
18. O’Rourke MF. Arterial Function in Health and Disease. Edinburgh: Churchill-Livingstone; 1982.
19. Folkow B. Structure and function of the arteries in hypertension. Am Heart J. 1987;114:938–48.
20. Cameron JD, Bulpitt CJ, Pinto ES, et al. The aging of elastic and muscular arteries: a comparison of diabetic and nondiabetic subjects. Diabetes Care. 2003;26(7):2133–8.
21. Pannier B, Guerin AP, Marchais SJ, et al. Stiffness of capacitive and conduit arteries: prognostic significance for end-stage renal disease patients. Hypertension. 2005;45:592–6.
22. Miller M, Cannon CP, Murphy SA, et al. Impact of triglyceride levels beyond low-density lipoprotein cholesterol after acute coronary syndrome in the PROVE IT-TIMI 22 trial. J Am Coll Cardiol. 2008;51(7):724–30.
23. Greene DJ, Skeggs JW, Morton RE. Elevated triglyceride content diminishes the capacity of high density lipoprotein to deliver cholesteryl esters via the scavenger receptor class B type I (SR-BI). J Biol Chem. 2001;276:4804–11. 24. Vega GL, Grundy SM. Kinetic heterogeneity of low density lipoproteins in
primary hypertriglyceridemia. Arteriosclerosis. 1986;4:395–406.
25. Sane T, Nikkila EA. Very low density lipoprotein triglyceride metabolism in relatives of hypertriglyceridemic probands: Evidence for genetic control of triglyceride removal. Arteriosclerosis. 1988;8(3):217–26.
26. Deckelbaum RJ, Granot E, Oschry Y, et al. Plasma triglyceride determines structure-composition in low and high density lipoproteins. Arteriosclerosis. 1984;4:225–31.
27. Eisenberg S, Gavish D, Oschry Y, et al. Abnormalities in very low, low and high density lipoproteins in hypertriglyceridemia: Reversal toward normal with bezafibrate treatment. J Clin Invest. 1984;74:470–82.
28. Yu KC, Cooper AD. Postprandial lipoproteins and atherosclerosis. Front Biosci. 2001;6:D332–54.
29. Kawakami A, Osaka M, Tani M, et al. Apolipoprotein CIII links hyperlipidemia with vascular endothelial cell dysfunction. Circulation. 2008;118(7):731–42. 30. Maggi FM, Raselli S, Grigore L, et al. Lipoprotein remnants and endothelial
dysfunction in the postprandial phase. J Clin Endocrinol Metab. 2004;89:2946–50.
31. Jagla A, Schrezenmeir J. Postprandial triglycerides and endothelial function. Exp Clin Endocrinol Diabetes. 2001;109(4):S533–47.
32. Chowienczyk PJ, Watts GF, Wierzbicki AS, et al. Preserved endothelial function in patients with severe hypertriglyceridemia and low functional lipoprotein lipase activity. J Am Coll Cardiol. 1997;29:964–8.
33. Tirosh A, Rudich A, Shochat T et al. Changes in Triglyceride Levels and Risk for Coronary Heart Disease in Young Men. Ann Intern Med. 2007;147:377– 85.
34. Hayashi K, Ide K, Matsumoto T. Aortic walls in atherosclerotic rabbits-mechanical study. J Biomech Eng. 1994;116(3):284–93.
35. Lee RT, Grodzinsky AJ, Frank EH, et al. Structure-dependent dynamic mechanical behavior of fibrous caps from human atherosclerotic plaques. Circulation. 1991;83(5):1764–70.
36. Lendon CL, Davies MJ, Richardson PD, et al. Testing of small connective tissue specimens for the determination of the mechanical behaviour of atherosclerotic plaques. J Biomed Eng. 1993;15(1):27–33.
37. Hamilton AJ, Kim H, Nagaraj A, et al. Regional material property alterations in porcine femoral arteries with atheroma development. J Biomech. 2005;38(12):2354–64.
39. Athanase B, Bernard W, Joseph I, et al. Influence of Age, Risk Factors, and Cardiovascular and Renal Disease on Arterial Stiffness: Clinical Applications. Am J Hypertens. 2002;15:1101–8.
40. Wahrenberg H, Hertel K, Leijonhufvud BM, et al. Use of waist circumference to predict insulin resistance: retrospective study. BMJ. 2005;330:1363–4. 41. Lemieux I, Pascot A, Couillard C, et al. Hypertriglyceridemic waist: A marker
of the atherogenic metabolic triad (hyperinsulinemia; hyperapolipoprotein B; small, dense LDL) in men? Circulation. 2000;102:179–84.
42. Rana JS, Arsenault BJ, Després JP, et al. Inflammatory biomarkers, physical activity, waist circumference, and risk of future coronary heart disease in healthy men and women. Eur Heart J. 2011;32:336–44.
• We accept pre-submission inquiries
• Our selector tool helps you to find the most relevant journal
• We provide round the clock customer support
• Convenient online submission
• Thorough peer review
• Inclusion in PubMed and all major indexing services • Maximum visibility for your research
Submit your manuscript at www.biomedcentral.com/submit