S O F T W A R E
Open Access
BUGSnet: an R package to facilitate the
conduct and reporting of Bayesian network
Meta-analyses
Audrey Béliveau
1*, Devon J. Boyne
2,3, Justin Slater
2, Darren Brenner
2,3,4and Paul Arora
2,5Abstract
Background:Several reviews have noted shortcomings regarding the quality and reporting of network meta-analyses (NMAs). We suspect that this issue may be partially attributable to limitations in current NMA software which do not readily produce all of the output needed to satisfy current guidelines.
Results: To better facilitate the conduct and reporting of NMAs, we have created an R package called“BUGSnet”(Bayesian inferenceUsingGibbsSampling to conduct aNetwork meta-analysis). This R package relies upon Just Another Gibbs Sampler (JAGS) to conduct Bayesian NMA using a generalized linear model. BUGSnet contains a suite of functions that can be used to describe the evidence network, estimate a model and assess the model fit and convergence, assess the presence of heterogeneity and inconsistency, and output the results in a variety of formats including league tables and surface under the cumulative rank curve (SUCRA) plots. We provide a demonstration of the functions contained within BUGSnet by recreating a Bayesian NMA found in the second technical support document composed by the National Institute for Health and Care Excellence Decision Support Unit (NICE-DSU). We have also mapped these functions to checklist items within current reporting and best practice guidelines.
Conclusion:BUGSnet is a new R package that can be used to conduct a Bayesian NMA and produce all of the necessary output needed to satisfy current scientific and regulatory standards. We hope that this software will help to improve the conduct and reporting of NMAs.
Keywords:Network meta-analysis, Indirect treatment comparison, Systematic review, Bayesian inference, Knowledge synthesis, Health technology assessment, Clinical efficacy, R package, Reporting guidelines
Background
Indirect treatment comparisons (ITC) and network meta-analysis (NMA) are approaches for quantitatively summarizing an evidence base in which there are more than two treatments of interest. Unlike traditional pair-wise meta-analysis, ITC/NMA can incorporate indirect evidence that arises when a group of studies evaluating different treatments share a common comparator. The incorporation of such evidence within an NMA has sev-eral advantages over pairwise meta-analysis [1,2]. Unlike pairwise meta-analysis, an NMA allows for the compari-son of two or more treatments that have never been directly compared provided that the studies examining
such treatments are linked via a common comparator (i.e. an indirect comparison) [1, 2]. Another important advantage of NMA over pairwise meta-analysis is that it may provide greater statistical precision through its incorporation of indirect evidence which is not taken into account within pairwise meta-analysis [1,2]. Lastly, an NMA can be used to rank a set of treatments for a given disease indication with respect to their clinically efficacy or harm and can be used to quantify the uncer-tainty surrounding such which is useful when determin-ing policies, guidelines, and costs surrounddetermin-ing the choice of treatment [2].
The number of publications using NMA has increased
dramatically within the past decade [3]. Despite this
increase, several reviews have noted shortcomings with respect to the quality of the conduct and reporting of NMAs [4–9]. In particular, several authors have noted
© The Author(s). 2019Open AccessThis article is distributed under the terms of the Creative Commons Attribution 4.0 International License (http://creativecommons.org/licenses/by/4.0/), which permits unrestricted use, distribution, and reproduction in any medium, provided you give appropriate credit to the original author(s) and the source, provide a link to the Creative Commons license, and indicate if changes were made. The Creative Commons Public Domain Dedication waiver (http://creativecommons.org/publicdomain/zero/1.0/) applies to the data made available in this article, unless otherwise stated.
* Correspondence:[email protected]
1Department of Statistics and Actuarial Science, University of Waterloo, 200
that a considerable proportion of NMAs do not provide a descriptive overview of the network or its structure, fail to adequately describe the statistical methods employed and whether or not their underlying assump-tions were assessed and met, and lack a comprehensive summary of the results including effect estimates and measures of uncertainty regarding treatment ranks [4–9]. To improve the conduct, reporting, and appraisal of NMAs, a number of guidelines have been published which include the International Society of Pharmacoeconomics
and Outcomes–Academy of Managed Care Pharmacy–
National Pharmaceutical Council (ISPOR-AMCP-NPC) questionnaire for assessing the relevance and credibility of an NMA [10], the Preferred Reporting Items for Systematic Reviews and Meta-Analyses (PRISMA) extension for reporting systematic reviews incorporating NMAs of health care interventions [11], and the National Institute for Health and Care Excellence Decision Support Unit (NICE-DSU) reviewer’s checklist for appraising the synthesis of evidence within a submission to a health technology assess-ment agency (technical support docuassess-ment 7) [12].
Although the dissemination and uptake of such guide-lines will hopefully help to address some of the foregoing issues, we suspect that the such issues may, in part, be related to limitations in current user-friendly software and tools used to conduct NMA. As previously noted, current software packages do not readily produce all of the output necessary to satisfy current reporting guide-lines in a format that is suitable for submission to a
jour-nal or health technology assessment agency [13, 14].
Individuals must therefore rely upon multiple software packages, modify existing software, or generate code de novo in order to adhere to scientific and regulatory stan-dards [14]. The resulting increase in time, effort, and expertise has likely impacted the quality and reporting of NMAs done to date. Furthermore, we have found that the documentation and help files of current software packages sometimes suffer from a lack of clarity regard-ing their implementation and use. In addition, the current lack of approachable tutorials that demonstrate how to use current NMA software could be a hindrance to users with limited programming expertise. To address these limitations, we have developed an R package called “BUGSnet”(Bayesian inferenceUsingGibbsSampling to
conduct a Network meta-analysis) aimed at improving
the reporting and conduct of NMA/ITC. BUGSnet improves over its two main competing software packages for conducting a contrast-based Bayesian NMA: GeMTC
[15] and NetMetaXL [16]. While NetMetaXL does
pro-duce much of the output necessary to satisfy reporting guidelines, it is limited in the types of analyses it can carry out. Specifically, one cannot use NetMetaXL to analyze outcomes that are not dichotomous, to conduct meta-regression, or to analyzing evidence bases with
more than 15 treatments [16]. While GeMTC provides
an enhanced suite of functions for conducting NMA relative to NetMetaXL, its reporting capabilities are lim-ited. For example, GeMTC does not readily produce key reporting items for an NMA such as tabular overview of the evidence base or a SUCRA plot and league table of the NMA results on the original scale.
Implementation
BUGSnet is a suite of functions that will carry out a Bayesian NMA while generating all items needed to
sat-isfy the statistical components of the PRISMA,
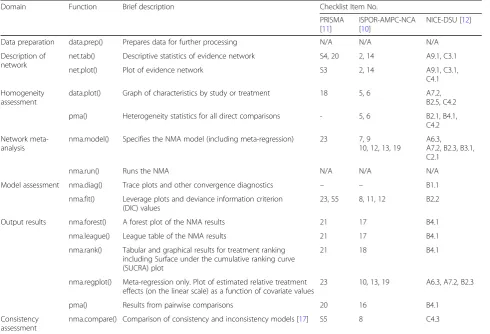
ISPOR-AMCP-NPC, and NICE-DSU checklists in a format that is suitable for publication or submission to a decision-making organization. These statistical components can be broadly categorized into: description of network (graphical and tabular), detection of heterogeneity, net-work meta-analysis (including meta-regression), model assessment, detection of inconsistency and reporting of the results. An overview of BUGSnet’s functions and the corresponding checklist items that they address is pre-sented in Table1.
BUGSnet is implemented within R software. BUGSnet requires that the user have installed Just Another Gibbs Sampler (JAGS) on their computer [18,19]. Information as to how to install JAGS can be found at the program’s
sourceforge homepage: http://mcmc-jags.sourceforge.
net/. BUGSnet is hosted and can be accessed at the
following URL: https://bugsnetsoftware.github.io/. We
encourage users to submit feedback on existing code and to provide suggestions for additional functions that should be added to BUGSnet at the aforementioned homepage. Detailed vignettes describing the step-by-step use of BUGSnet to conduct an NMA on various types of outcomes are currently available in the R package docu-mentation and on the BUGSnet homepage and add-itional applied examples are forthcoming.
Data preparation
The first step to using BUGSnet is to process the data using the data.prep() function where the user specifies the name of the columns variables that correspond to the study IDs and treatment arms. This way, the user does not have to enter this information over and over in subsequent functions.
Description of network
Current guidelines recommend that authors report plot of the evidence network [10–12]. The net.plot() and the net.tab() functions allow the user to describe the net-work of studies in a graphical and tabular format respectively.
that they reflect the number of studies examining a spe-cific treatment and the number of comparisons between any two given treatments respectively as per current recommendations. In addition, we have introduced an option that allows the user to highlight specific interven-tions of interest within the network graph and to label the edges with the names of the studies that have inves-tigated these particular treatments. The colour, size, and layout of the network graph is highly customizable to ensure that the resulting figure will meet industry and journal standards.
The net.tab() function produces descriptive tables that are based on the tables produced by NetMetaXL
– an excel-based software for conducting Bayesian
NMAs [16]. While the tables produced by NetMetaXl
are excellent descriptors of the network geometry, this software is currently only capable of handling di-chotomous outcomes and is limited to 15 treatments
[16]. We have expanded upon the tabular reporting
of NetMetaXL by allowing such tables to summarize other types of outcomes including continuous, dichot-omous, and count outcomes. An additional feature of
our function is a report on whether the network is connected or not.
Homogeneity
Current guidelines recommend a careful exploration of heterogeneity within the network, typically prior to con-ducting the NMA [10–12]. Researchers should identify which characteristics are likely to be important modifiers of the treatment effects a priori using content expertise or a literature review [20]. Once identified, one can use the data.plot() function within BUGSnet to assess the heterogeneity of these modifiers within an evidence net-work. Specifically, this function generates a graph that allows the user to display a characteristic of interest within each treatment arm, grouped by study ID or treatment.
In addition, BUGSnet also provides an option within the pma() function to produce a table summarizing a Cochrane chi-square test, the tau-squared statistic, and the I-squared statistic for assessing between-study heterogeneity within each possible pairwise comparison within the network in which there is direct evidence [21].
Table 1List of functions within the BUGSnet package and corresponding items on guidelines that they address
Domain Function Brief description Checklist Item No.
PRISMA [11]
ISPOR-AMPC-NCA [10]
NICE-DSU [12]
Data preparation data.prep() Prepares data for further processing N/A N/A N/A
Description of network
net.tab() Descriptive statistics of evidence network S4, 20 2, 14 A9.1, C3.1
net.plot() Plot of evidence network S3 2, 14 A9.1, C3.1,
C4.1
Homogeneity assessment
data.plot() Graph of characteristics by study or treatment 18 5, 6 A7.2,
B2.5, C4.2
pma() Heterogeneity statistics for all direct comparisons - 5, 6 B2.1, B4.1,
C4.2
Network meta-analysis
nma.model() Specifies the NMA model (including meta-regression) 23 7, 9 10, 12, 13, 19
A6.3,
A7.2, B2.3, B3.1, C2.1
nma.run() Runs the NMA N/A N/A N/A
Model assessment nma.diag() Trace plots and other convergence diagnostics – – B1.1
nma.fit() Leverage plots and deviance information criterion (DIC) values
23, S5 8, 11, 12 B2.2
Output results nma.forest() A forest plot of the NMA results 21 17 B4.1
nma.league() League table of the NMA results 21 17 B4.1
nma.rank() Tabular and graphical results for treatment ranking including Surface under the cumulative ranking curve (SUCRA) plot
21 18 B4.1
nma.regplot() Meta-regression only. Plot of estimated relative treatment effects (on the linear scale) as a function of covariate values
23 10, 13, 19 A6.3, A7.2, B2.3
pma() Results from pairwise comparisons 20 16 B4.1
Consistency assessment
Network meta-analysis
BUGSnet implements a Bayesian contrast-based NMA using a generalised linear model as described in the
NICE-DSU technical support document 2 [17]. The
BUGS code used to generate these models within the BUGSnet package borrows heavily from this source [17]. Within BUGSnet, the nma.model() function is used to generate the BUGS model that one wishes to fit which includes aspects such as the link function and the likeli-hood distribution appropriate for the outcome of inter-est, the choice of using a fixed effects or a random effects model, and the inclusion of covariates if one wishes to conduct a meta-regression. After the NMA model has been generated, one can run a Bayesian net-work meta-analysis with the function nma.run(). In the nma.run() function, the user can specify the number of burn-ins, iterations, and adaptations for the Markov Chain Monte Carlo (MCMC) algorithm and which vari-ables they wish to monitor.
Bayesian inference
BUGSnet conducts NMA using Bayesian inference. There were several practical and theoretical reasons for choosing to implement the package within a Bayesian as opposed to a frequentist framework as noted by others: 1) Bayesian methods are more popular among researchers who conduct network meta-analyses; 2) Bayesian methods for network meta-analysis have been developed to a fur-ther degree; 3) Bayesian methods allow one to better han-dle data from trials with multiple arms and trials in which there are arms with zero events; 4) Bayesian methods are currently better suited for modeling uncertainty surround-ing the heterogeneity between studies; 5) Bayesian methods present results as probabilities and are thus more suitable for ranking treatment efficacy and for incorpor-ation into health-economic decision modeling [1,22].
NMA models
BUGSnet can handle continuous, dichotomous, and count data (with or without varying follow-up times) as well as data from studies with more than two treatment arms. In what follows, we describe the NMA models that are implemented within BUGSnet. Suppose that we have data from studiesi= 1,…,M. In armkof studyi, treat-menttik∈{1,…,T} was used. The set {1,…,T} represents
the set of treatments that were assessed across the M
studies, where treatment 1 is a reference treatment. Let a1,…,aMrepresent the number of arms in studies 1,…,
M. LetRikbe the measured aggregate response in armk
of study i (e.g. proportion of individuals who were alive at one-year, average blood pressure, etc.). Those re-sponses are modeled as conditionally independent using
an appropriate distribution Fwhich is chosen based on
the type of outcome at hand. For continuous outcomes,
where the aggregate responses take the from of the sam-ple mean and standard error in each arm, the distribu-tion Fis the normal distribution; RikNormalðφik;se2ikÞ,
whereφik is the mean and se2ik is the observed standard
error of the responses in arm k of study i. When
out-come is dichotomous, the distribution Fis the binomial
distribution; Rik~Binomial(nik,φik ), where φik is the
probability of experiencing the event andnikis the
sam-ple size in arm k of study i. When outcomes take the
form of counts and the event rates can be assumed to be constant over the duration of follow-up, one can use the Poisson distribution;Rik~Poisson(eikφik), whereeikis the
observed person-time at risk andφikis the event rate in
arm kof study i. The latent parametersφik ’s are
trans-formed using an appropriate link functiong(·) sog(φik)≡
θik can be modeled with a linear model. Table 2
sum-marizes the link functionsg(·) and family distributionsF implemented within BUGSnet based on the type of out-come data. Following the NICE-DSU technical support document 2 [17], the linear model used is generally of the contrast-based form:
θik¼μiþδik;
where μi represents the fixed effect of the treatment from arm 1 in studyi (a control treatment) andδik rep-resents the (fixed or random) effect of the treatment from armkof studyirelative to the treatment in arm 1 and δi1= 0 for i = 1, …,M. In BUGSnet, two exceptions
to this model occur. First, when exploring a dichotom-ous outcome from studies with differing lengths of follow-up time, one can use a binomial family distribu-tion with the complementary log-log link and the linear model includes the observed follow-up time fi in triali: θik= log(fi) +μi+δik [17]. Second, when exploring a di-chotomous outcome with a binomial family distribution and a log link, the linear model takes the form θik= min(μi+δik,−10−16) to ensure that θik is negative and the probabilitiesφikare between 0 and 1.
In a random effect model, the δi’s¼ ðδi2;…;δiaiÞ ⊤ are
modeled as conditionally independent with distributions
δijdi;Σ
½ MVNormalðdi;ΣÞ; ð1Þ
where di¼ ðdðti1;ti2Þ;…;dðti1;tiaiÞÞ
⊤ and d
ðti1;tikÞ¼dð1;tikÞ− dð1;ti1Þ is the difference in the treatment effect of
treat-mentsti1and tikon theg(·) scale andd(1, 1)= 0. ForΣwe
adopt the usual compound symmetry structure described in (16), with variancesσ2and covariances 0.5σ2, whereσ2 represents the between-trial variability in treatment effects (heterogeneity). Independent priors are used on σ, d(1, 2),
…. ,d(1,T)and μ1, …, μM. For ease of implementation, in
δikjδi2;…;δik−1;di;Σ
½ Normal dðti1;tikÞþ
1
k−1 Xk−1
j¼1δij−dðti1;tikÞ
; k
2ðk−1Þσ2
:
In a fixed effect model, theδik’s are treated as“fixed”
(to use frequentist jargon) and are defined as δik
¼dðti1;tikÞ¼dð1;tikÞ−dð1;ti1Þ with d(1, 1)= 0. Independent
priors are used on d(1, 2), …. ,d(1,T) and μ1, …, μM. In
both the fixed and random-effects model, the posterior quantities of interest are all the mean treatment con-trasts dðti1;tikÞ which can be determined from d(1, 2), …. ,d(1,T)through the transitivity relation dðti1;tikÞ¼dð1;tikÞ− dð1;ti1Þ:
Meta-regression
Letxikbe a continuous covariate available in armsk= 1,
…,aiof studiesi= 1,…,M. Network meta-regression is
implemented in BUGSnet via the linear model
θik¼μiþδikþβðti1;tikÞðxik−xÞ;
wherexis the average of thexik’s across studies and the βðti1;tikÞ¼βð1;tikÞ−βð1;ti1Þ are regression coefficients for the
effect of the covariate on the relative effect of treatments ti1andtik, with β(1, 1)=…=β(T,T)= 0. A prior is used on
β(1, 2), …, β(1,K). When conducting a meta-regression
analysis, the output plots and tables described in the
Output section (league heat plot, league table, etc.) can also be produced but the user will need to specify a value for the covariate at which to produce treatment comparisons. Those treatment comparisons are calculated internally within BUGSnet by computing posterior quan-tities of interest at a specific covariate valuex0as dðti1;tikÞ
þβðti1;tikÞðx
0−xÞ;and using the transitivity relationsd
ðti1;tikÞ
¼dð1;tikÞ−dð1;ti1Þandβðti1;tikÞ¼βð1;tikÞ−βð1;ti1Þ:
Choice of priors
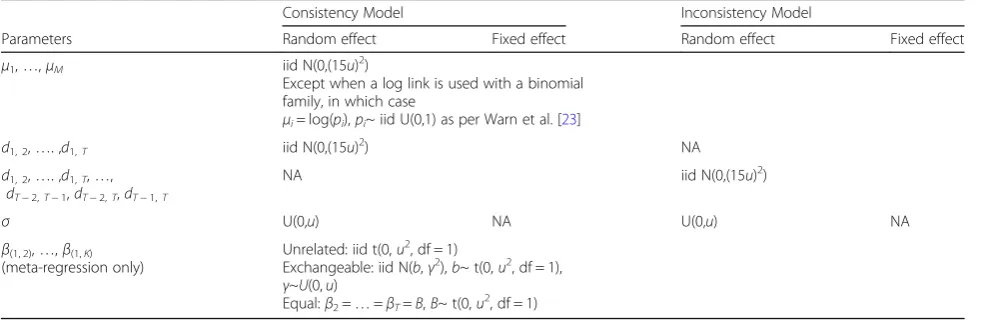
By default, BUGSnet implements the vague priors
de-scribed in Table 3. Our choice of priors was based on
the justifications made by van Valkenhoef et al. (2012) [15] which allow a prior variance to be easily calculated from the data without any user input. These priors are the same as the ones implemented in the GeMTC R
package [15]. The user also has the option within the
nma.model() function to specify their own prior which is useful for conducting sensitivity analyses, namely for the comparison of prior distributions on the random effects standard deviation, σ, to insure that they do not have a significant effect on the posterior estimates.
The variances 15u are taken from van Valkenhoef
(2012) et al., whereuis the largest maximum likelihood estimator of treatment differences on the linear scale in
Table 2Types of outcomes and corresponding link functions and likelihood distributions available within BUGSnet
Type of Outcome Arm-Level Data Required
Distribution Family Link function Measure of effect Assumption on follow-up time
Continuous Mean & Standard Error Normal Identity Mean Difference Outcome is unrelated to follow-up time
Dichotomous Events & Sample Size
Binomial Logit Odds Ratio
Log Risk Ratio
Events & Sample Size & Median Follow-Up Time
Complementary log-log
Hazard Ratio Event rates are constant over the duration of follow-up
Count Events & Person-Time at Risk Poisson Log Rate Ratio
Table 3Priors implemented by default in BUGSnet
Consistency Model Inconsistency Model
Parameters Random effect Fixed effect Random effect Fixed effect
μ1,…,μM iid N(0,(15u)2)
Except when a log link is used with a binomial family, in which case
μi= log(pi),pi~ iid U(0,1) as per Warn et al. [23] d1, 2,…. ,d1,T iid N(0,(15u)
2
) NA
d1, 2,…. ,d1,T,…, dT−2,T−1,dT−2,T,dT−1,T
NA iid N(0,(15u)2)
σ U(0,u) NA U(0,u) NA
β(1, 2),…,β(1,K)
(meta-regression only)
Unrelated: iid t(0,u2, df = 1)
Exchangeable: iid N(b,γ2),b~ t(0,u2, df = 1),
γ~U(0,u)
Equal:β2=…=βT=B,B~ t(0,u
2
single trials [15]. Note that t denotes Student’s t
distri-bution with parameters: location, variance and degrees of freedom.
Model assessment
After the NMA model has been run, guidelines recom-mend that one assesses the convergence and fit of the
model [10–12]. In BUGSnet, convergence can be
assessed using trace plots and other convergence diag-nostics produced by the nma.diag() function. Lastly, the fit of the model and the identification of potential out-liers can be carried out using the nma.fit() function which will produce a plot of the leverage values and also display the corresponding effective number of parame-ters, total residual deviance, and deviance information criterion (DIC). These latter values can be used to help determine or justify model choice when considering two or more competing models (e.g. between a fixed- or random-effects model) and to help identify data points that contribute heavily to the DIC and/or that are influential.
Consistency
A fundamental assumption of an NMA is the assump-tion of transitivity [2]. Under this assumption, one as-sumes that one can estimate the difference in the effect of two treatments by subtracting the difference in the effects of the two treatments relative to a common comparator as follows: dðti1;tikÞ¼dð1;tikÞ−dð1;ti1Þ[2]. Aside
from exploring clinical heterogeneity of treatment defini-tions and modifiers within the network using the data.-plot() function, one can also detect violations of the assumption of transitivity by examining statistical consistency within the network. Statistical consistency refers to the statistical agreement between indirect and direct evidence within an evidence network [2]. Evidence of inconsistency would indicate a violation of the transitiv-ity assumption. As noted by Efthimiou et al. (2015), statis-tical consistency can only be explored if there are closed loops within the network [2]. A variety of methods have been proposed to assess consistency within a network meta-analysis [2,24, 25]. Such methods are often catego-rized as being“global”or“local”depending upon whether they examine inconsistency within the entire network or within particular segments thereof [2]. BUGSnet currently implements the inconsistency model (or unrelated mean effects model) as described in the NICE-DSU TSD 4 [26]. An inconsistency model is an NMA model similar to the consistency models described above but transitivity dðti1;tikÞ¼dð1;tikÞ−dð1;ti1Þis not assumed. Instead,
independ-ent priors are defined on each of the dðti1;tikÞ ’s. Inconsistency models therefore have more parameters than consistency models, which needs to be weighted
against how well they fit the data compared to the consistency model to determine if there is evidence of inconsistency. The inconsistency model can be speci-fied using the type = "inconsistency" option in the nma.-model(). To examine inconsistency at the global level, the fit of the inconsistency model can be compared against a model in which consistency is assumed using the nma.fit() function and comparing the DICs. Local inconsistency can be explored on the leverage plots produced by nma.fit() and also using the nma.com-pare() function which produces a plot comparing the posterior mean deviance of each data point between the consistency and the inconsistency model.
We chose to implement the inconsistency model method for assessing inconsistency in BUGSnet because it easily handles different network structures and multi-arm trials, which is not the case with other methods for assessing inconsistency such as the Bucher method [26,
27]. More options for assessing inconsistency at both the global and local levels will be considered in further BUGSnet releases.
Output
We provide several functions for displaying the results of the NMA in both graphical and tabular formats (league tables, league heat plots, SUCRA plots, SUCRA tables, rankograms and forest plots) to satisfy current guidelines. With respect to plotting the magnitude and uncertainty of the treatment effects, users can the use the nma.forest() function to graph the effect estimates from the NMA against a comparator specified by the user. The effect estimates can also be presented within a league table using the nma.league() function. An import-ant presentation feature in BUGSnet, particularly for large league tables, is that the user can specify an option to colour and arrange the league table into a heatmap that highlights the magnitude of the effect estimates. Users can also graphically display the probability of the ranking of each treatment within a surface under the cumulative ranking curve (SUCRA) plot which can be specified within the nma.rank() function. This function can also be used to present treatment ranks in a tabular format, extract SUCRA values and produce a rankogram. All of the plots produced by these three reporting func-tions are produced with the ggplot2 package. As such, the user can easily customize the plots (e.g. change the background, add a title) by adding layers using the + command. Also, for reporting relative treatment effects the user can specify whether they want to plot the results on the the linear scale (log scale) or the original scale.
to specify for which value of the covariate they wish to present the results. Even though the covariate is cen-tered for meta-regression, the user does not have to do any conversion and results are provided on the original non-centered scale. Another function, nma.regplot() outputs a plot of relative treatment effects on the linear scale across the range of covariate values used in the meta-regression, as in the NICE-DSU TSD 3 [28].
It is sometimes recommended that users present re-sults from the direct evidence where available [29]. To accommodate this, we have also incorporated the pma() function within BUGSnet which will perform pairwise meta-analysis using the meta package in R and automat-ically output the results into a tabular format [30].
Results
The following is a demonstration of some of the
func-tions contained within BUGSnet (Table 1) and some of
the possible outputs. To accomplish this task, we have recreated an analysis of a dichotomous outcome where studies had variable follow-up times described in the NICE-DSU technical support document 2 (referred to as “Data Example 3”) [17]. The BUGSnet code used to produce this analysis is available in the vignette titled survival in the BUGSnet documentation, and appended as a supplement to this article (see Additional file 1). Additional outputs are presented in the vignette as well as a more detailed description of how to conduct and re-port network meta-analysis, which is only presented here in brief.
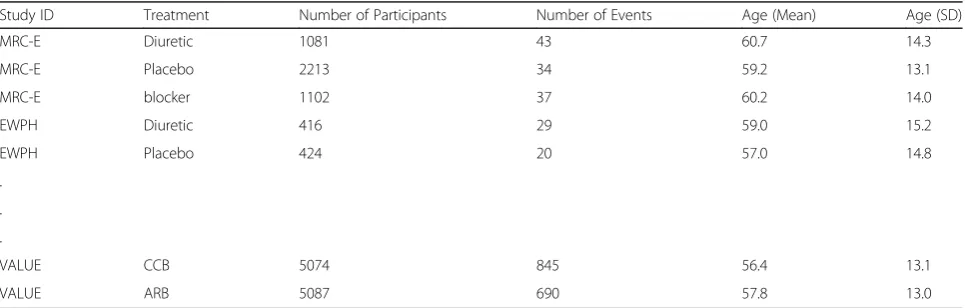
The evidence network used in this analysis consists of 22 randomized trials (including multi-arm trials) that examined the effects of six antihypertensive treatments on the risk of developing diabetes [31]. The outcome for this data is the number of new diabetes cases observed during the trial period. The data is organized in the long format (i.e. one row per treatment arm), with variables indicating the study ID, the treatment ID, the number of patients, the number of events, and the mean age (and standard
deviation) of participants for each treatment arm (see Table4). The results of our package are concordant with those reported in the TSD as well results obtained with GeMTC (code and outputs provided as supplement to this article (see Additional files2,3,4and5) and NetMetaXL.
Data preparation, description of network and homogeneity
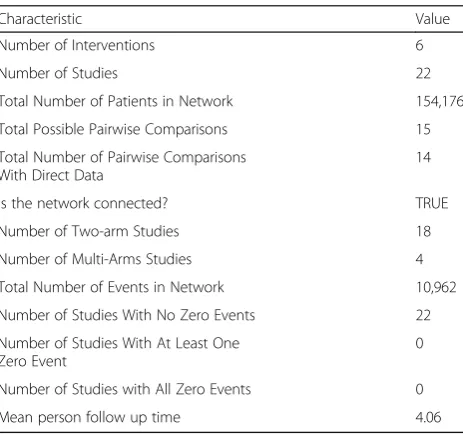
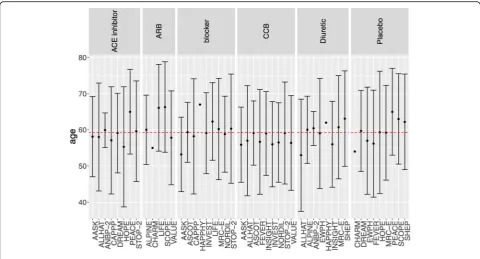
After the data was prepared using the data.prep() function, the net.plot() and the net.tab() functions were used to de-scribe the network of studies in a graphical (Fig. 1) and tabular format respectively (Table 5). As previously dis-cussed, the assumptions of network meta-analysis will be violated when an effect modifier is heterogeneously distrib-uted throughout an evidence base [20]. Prior to conducting the network meta-analysis, analysts can use the data.plot() function to examine the distribution of an effect modifier within the network. The determination of whether or not a variable is an effect modifier and whether or not the ob-served differences in its distribution are clinically meaning-ful is determined according to expert opinion and prior evidence. To demonstrate this function, we have simulated a patient characteristic that may modify the treatment effect (i.e. the age of participants). To mimic a lack of reporting, we have omitted the standard deviation for a few of the studies. As observed in Fig.2, the mean age of participants within each treatment arm (the individual points) is simi-lar to the overall mean age of participants within the evi-dence base (the red dotted line). According to the standard deviation (the +/− error bars), the variability of ages within each treatment arm appear to be similar as well (where available). Based on this analysis, one would conclude that there is no meaningful heterogeneity in the distribution of age. This analysis would be repeated for all potentially important effect modifiers identified a priori by clinical opinion and a review of previous studies. If no het-erogeneity is detected, then one may proceed to conduct-ing the network meta-analysis. If heterogeneity is detected, one can attempt to adjust for imbalances by
Table 4Organization of diabetes dataset used to demonstrate the capabilities of BUGSnet
Study ID Treatment Number of Participants Number of Events Age (Mean) Age (SD)
MRC-E Diuretic 1081 43 60.7 14.3
MRC-E Placebo 2213 34 59.2 13.1
MRC-E blocker 1102 37 60.2 14.0
EWPH Diuretic 416 29 59.0 15.2
EWPH Placebo 424 20 57.0 14.8
.
.
.
VALUE CCB 5074 845 56.4 13.1
using meta-regression (if there are an adequate number of studies) or by using alternative statistical techniques that leverage individual patient data (e.g. matching-adjusted in-direct comparison or simulated treatment comparison) [20].
Network meta-analysis
We conducted an NMA on the Diabetes dataset by fitting a generalized linear model with a complementary log-log link function and binomial likelihood function to account for the dichotomous outcome and differing follow-up times
between studies, which was specified through the use of nma.model(). To be consistent with the NICE-DSU tech-nical support document, we specified a burn-in of 50,000 it-erations followed by 100,000 itit-erations with 10,000 adaptations in the nma.run() function. We compared the fit of both a fixed- and random-effects model. According to a visual examination of the leverage plots and comparison of the DIC values produced by the nma.fit(), the random ef-fects model would be preferred over the fixed efef-fects model for this particular dataset because the DIC value is lower and because there are fewer outliers in the leverage plot (Fig.3).
Output
We present results from the generalized linear model that we previously fit to the Diabetes dataset. As visualized in
the SUCRA plot obtained from nma.rank(), the
angiotensin-receptor blockers’(ARB) curve is consistently above the other treatments’curves suggesting that it is the most beneficial treatment with respect to the outcome among the treatments included in the Diabetes evidence network (Fig. 4). The effect estimates and credible inter-vals produced by the foregoing model are displayed in a league heat plot (Fig. 5) obtained using nma.league(). In Fig. 5, one can see that the difference between ARB and other treatments are all statistically significant at the 95% level except for the ACE inhibitor and Placebo treatments.
Consistency
To assess the presence of inconsistency, we fit an NMA model similar to the one previously described but as-suming inconsistency. We obtain leverage plots similar Fig. 1Network plots produced by the net.plot() Function in BUGSnet
Table 5Network characteristics produced by the net.tab()
function in BUGSnet
Characteristic Value
Number of Interventions 6
Number of Studies 22
Total Number of Patients in Network 154,176
Total Possible Pairwise Comparisons 15
Total Number of Pairwise Comparisons With Direct Data
14
Is the network connected? TRUE
Number of Two-arm Studies 18
Number of Multi-Arms Studies 4
Total Number of Events in Network 10,962
Number of Studies With No Zero Events 22
Number of Studies With At Least One Zero Event
0
Number of Studies with All Zero Events 0
to Fig. 3using the nma.fit() function where we find that the DIC for the consistency model is marginally smaller than for the inconsistency mode. We also use the nma.-compare() function to plot the individual data points’ pos-terior mean deviance contributions for the consistency model vs the inconsistency model (Fig.6) as recommended
in the NICE-DSU TSD 4 [26]. Overall, we conclude that
there is a lack of evidence to suggest inconsistency within the network.
Discussion
BUGSnet is intended to be used by researchers when assessing the clinical efficacy of multiple treatments within the context of a submission to a journal or a health technology assessment agency. For conducting a contrast-based Bayesian NMA, the two main competing software packages that one may consider are GeMTC [15] and NetMetaXL [16], for which we have discussed limitations in the introduction. With BUGSnet, we Fig. 2Graph of patient characteristic by treatment using the data.plot() function in BUGSnet
aimed to create a single tool that would compete with the reporting capabilities of NetMetaXL and the analytic capabilities of GeMTC. We have also aimed to provide users with enhanced reporting options not included in existing software such as a function to produce graphs that show the distribution of effect modifiers by trial or by treatment arm and an option to print study names and highlight certain treatment comparisons within the
network plot. To help facilitate the use of BUGSnet among new users, we have provided three vignettes (with more vignettes forthcoming) in the R help files that walk users through conducting an NMA using BUGSnet by providing detailed R code and interpreta-tions of the statistical output. Despite these benefits, there are limitations of BUGSnet. BUGSnet is currently limited to exclusively analyzing arm-level data. In Fig. 4SUCRA plot produced by the nma.rank() Function in BUGSnet
contrast, GeMTC can be used to conduct an NMA using entirely arm-level or entirely contrast-level data [22]. Relative to GeMTC, another limitation of BUGSnet is that GeMTC currently provides a broader range of methods of assessing inconsistency such as the node-splitting method and a broader range of meta-regression analyses such as subgroup meta-analysis. Since it is implemented within the R environment, some users may find BUGSnet more difficult to use relative to NetMe-taXL, which is implemented within Microsoft Excel. At this point, arm-based models [22] have not been imple-mented in BUGSnet; the R package pcnetmeta allows such analyses, although it does not readily provide a complete suite of outputs like BUGSnet. We plan to address these shortcomings in future iterations of BUGS-net and interested users should check the previously men-tioned URL for updates.
Network meta-analysis is a rapidly evolving area of re-search with new methods constantly being developed [32]. While the work presented within this paper provides the essential tools required to conduct an NMA in accordance with current guidelines, we plan to implement additional functions and features within this package, based on user feedback, to provide enhanced flexibility and to ensure relevance. Some of the preliminary requests for short-term additions include: 1) additional functions for detect-ing inconsistency within the network such as the Bucher method [27]; 2) an option to allow the user to conduct an NMA using study-level effect estimates; 3) allowing for
the relaxation of the proportional hazards assumption when analyzing time-to-event outcomes; 4) allowing for sub-group meta-regression and the inclusion of more than one covariate into the meta-regression model; 5) a func-tion that will automatically generate a report or slide deck presentation of the results that could be saved as a pdf, html or Word.
As detailed in Table 1, the functions contained within BUGSnet can be used to address the items within the PRISMA, ISPOR-AMCP-NPC, and NICE-DSU reporting guidelines that are related to the statistical analysis component of an NMA [11,12, 29]. However, it should be emphasised that there are several non-statistical issues described within these guidelines that BUGSnet is not meant to address such as the identification of the research question, the specification of the study popula-tion and competing intervenpopula-tions, the development of the search strategy, and the assessment of the risk of bias
within each study [10–12]. Researchers are urged to
consult with these guidelines when planning their NMA to ensure that all aspects of the NMA, both statistical and non-statistical, adhere to current reporting and methodologic standards.
Conclusions
published best-practice guidelines to help overcome the lack of quality identified within this body of literature. In addition to these features, we have attempted to provide ample documentation describing the use and implementa-tion of BUGSnet to help promote the understanding and uptake of this software. Lastly, we plan to monitor the literature and to implement new features within BUGSnet based on the NMA analyst community to ensure that the package remains up-to-date with the latest advances in this rapidly developing area of research.
Availability and requirements
Project name: BUGSnet
Project home page:https://bugsnetsoftware.github.io/
Operating system(s): Windows 10 v1809 and Mac OS 10.14 (may work on earlier versions but not tested)
Programming language: R Other requirements: JAGS 4.3.0
License: Creative Commons
Attribution-NonCommercial-ShareAlike 4.0 International
Any restriction to use by non-academics: Contact authors for non-academic use.
Supplementary information
Supplementary informationaccompanies this paper athttps://doi.org/10. 1186/s12874-019-0829-2.
Additional file 1.Vignette on network meta-analysis of survival data. A vignette detailing how to obtain the outputs in the Results section using BUGSnet version 1.0.2. The vignette includes all the necessary R code as well as additional outputs and explanations that were not presented in this manuscript for the sake of brevity.
Additional file 2.R code to compare BUGSnet with GeMTC for the analysis of the diabetes data.
Additional file 3.Diabetes dataset to accompany the R code in Additional file2.
Additional file 4.BUGSnet league table obtained from the R code in Additional file2.
Additional file 5.GeMTC league table obtained from the R code in Additional file2.
Abbreviations
ISPOR-AMCP-NPA:International Society for Pharmacoeconomics and Outcomes Research - Academy of Managed Care Pharmacy - National Pharmaceutical Council; ITC: Indirect Treatment Comparisons; JAGS: Just Another Gibbs Sampler; NICE-DSU: National Institute for Health and Care Excellence Decision Support Unit; NMA: Network Meta-Analysis;
PRISMA: Preferred Reporting Items for Systematic Reviews and Meta-Analysis; SUCRA: Surface Under the Cumulative Ranking Curve
Acknowledgements
We would like to thank the two reviewers for their feedback which helped improve this manuscript. We would also like to thank the attendees of our 2019 CADTH Symposium workshop and UBC Network Meta-Analysis Work-shop for providing valuable feedback regarding the implementation and ease of use of BUGSnet. AB acknowledges the support of a start-up grant from the University of Waterloo and DBo acknowledges the support of the Barrie I Strafford Doctoral Scholarship for Interdisciplinary Studies on Aging.
Authors’contributions
All five authors (AB, DBo, PA, JS and DBr) contributed to the conception and design of the work. AB designed the software architecture. AB, DBo and JS coded the software. DBo and AB drafted the first version of the manuscript and all five authors (AB, DBo, PA, JS and DBr) substantially revised it. All five authors (AB, DBo, PA, JS and DBr) have read and approved the manuscript.
Funding
The author(s) received no financial support for the research, authorship, and/ or publication of this article.
Availability of data and materials
All of the datasets and material contained within the manuscript can be accessed within the BUGSnet package via the BUGSnet homepage:https:// bugsnetsoftware.github.io/
Ethics approval and consent to participate Not applicable
Consent for publication Not applicable
Competing interests
AB and DBo are consultants for Lighthouse Outcomes. JS is employed by Lighthouse Outcomes. PA and DBr are partners at Lighthouse Outcomes.
Author details
1Department of Statistics and Actuarial Science, University of Waterloo, 200
University Avenue West, Waterloo, Ontario N2L 3G1, Canada.2Division of Analytics, Lighthouse Outcomes, 1 University Avenue (3rd Floor), Toronto, Ontario M5J 2P1, Canada.3Department of Community Health Sciences,
University of Calgary, 2500 University Drive NW, Calgary, Alberta T2N 1N4, Canada.4Department of Oncology, University of Calgary, 2500 University Drive NW, Calgary, Alberta T2N 1N4, Canada.5Dalla Lana School of Public
Health, University of Toronto, Health Sciences Building, 155 College Street (6th Floor), Toronto, Ontario M5T 3M7, Canada.
Received: 26 April 2019 Accepted: 6 September 2019
References
1. Jansen JP, Fleurence R, Devine B, Itzler R, Barrett A, Hawkins N, Lee K, Boersma C, Annemans L, Cappelleri JC. Interpreting indirect treatment comparisons and network meta-analysis for health-care decision making: report of the ISPOR task force on indirect treatment comparisons good research practices: part 1. Value Health. 2011;14(4):417–28.
2. Efthimiou O, Debray TP, van Valkenhoef G, Trelle S, Panayidou K, Moons KG, Reitsma JB, Shang A, Salanti G. GetReal in network meta-analysis: a review of the methodology. Res Synth Methods. 2016;7(3):236–63.
3. Lee AW. Review of mixed treatment comparisons in published systematic reviews shows marked increase since 2009. J Clin Epidemiol. 2014;67(2):138–43. 4. Bafeta A, Trinquart L, Seror R, Ravaud P. Reporting of results from network
meta-analyses: methodological systematic review. BMJ. 2014;348:g1741. 5. Hutton B, Salanti G, Chaimani A, Caldwell DM, Schmid C, Thorlund K, Mills E,
Catala-Lopez F, Turner L, Altman DG, et al. The quality of reporting methods and results in network meta-analyses: an overview of reviews and suggestions for improvement. PLoS One. 2014;9(3):e92508. 6. Song F, Loke YK, Walsh T, Glenny AM, Eastwood AJ, Altman DG.
Methodological problems in the use of indirect comparisons for evaluating healthcare interventions: survey of published systematic reviews. BMJ. 2009; 338:b1147.
7. Donegan S, Williamson P, Gamble C, Tudur-Smith C. Indirect comparisons: a review of reporting and methodological quality. PLoS One. 2010;5(11): e11054.
8. Kovic B, Zoratti MJ, Michalopoulos S, Silvestre C, Thorlund K, Thabane L. Deficiencies in addressing effect modification in network meta-analyses: a meta-epidemiological survey. J Clin Epidemiol. 2017;88:47–56.
10. Jansen JP, Trikalinos T, Cappelleri JC, Daw J, Andes S, Eldessouki R, Salanti G. Indirect treatment comparison/network meta-analysis study questionnaire to assess relevance and credibility to inform health care decision making: an ISPOR-AMCP-NPC good practice task force report. Value Health. 2014; 17(2):157–73.
11. Hutton B, Salanti G, Caldwell DM, Chaimani A, Schmid CH, Cameron C, Ioannidis JP, Straus S, Thorlund K, Jansen JP, et al. The PRISMA extension statement for reporting of systematic reviews incorporating network meta-analyses of health care interventions: checklist and explanations. Ann Intern Med. 2015;162(11):777–84.
12. Ades A, Caldwell DM, Reken S, Welton NJ, Sutton AJ, Dias S. NICE DSU technical support document 7: evidence synthesis of treatment efficacy in decision making: a reviewer’s checklist. Decision Support Unit London UK. 2012;27905719.
13. Neupane B, Richer D, Bonner AJ, Kibret T, Beyene J. Network meta-analysis using R: a review of currently available automated packages. PLoS One. 2014;9(12):e115065.
14. Xu C, Niu Y, Wu J, Gu H, Zhang C. Software and package applicating for network meta-analysis: a usage-based comparative study. J Evid Based Med. 2018;11(3):176–83.
15. van Valkenhoef G, Lu G, de Brock B, Hillege H, Ades AE, Welton NJ. Automating network meta-analysis. Res Synth Methods. 2012;3(4):285–99. 16. Brown S, Hutton B, Clifford T, Coyle D, Grima D, Wells G, Cameron C. A
Microsoft-excel-based tool for running and critically appraising network meta-analyses--an overview and application of NetMetaXL. Systematic Reviews. 2014;3:110.
17. Dias S, Welton NJ, Sutton AJ, Ades A. NICE DSU technical support document 2: a generalised linear modelling framework for pairwise and network meta-analysis of randomised controlled trials; 2011.
18. Plummer M: JAGS: a program for analysis of Bayesian graphical models using Gibbs sampling. In: Proceedings of the 3rd international workshop on distributed statistical computing:2003: Vienna; 2003.
19. Plummer M: JAGS version 4.3.0 user manual.https://sourceforge.net/ projects/mcmc-jags/files/Manuals/. Accessed 30 Aug 2019.
20. Jansen JP, Naci H. Is network meta-analysis as valid as standard pairwise meta-analysis? It all depends on the distribution of effect modifiers. BMC Med. 2013;11:159.
21. Higgins JP, Thompson SG. Quantifying heterogeneity in a meta-analysis. Stat Med. 2002;21(11):1539–58.
22. Dias S, Ades A, Welton NJ, Jansen JP, Sutton AJ. Network meta-analysis for decision-making. Hoboken: Wiley; 2018.
23. Warn DE, Thompson SG, Spiegelhalter DJ. Bayesian random effects meta-analysis of trials with binary outcomes: methods for the absolute risk difference and relative risk scales. Stat Med. 2002;21(11):1601–23. 24. Veroniki AA, Vasiliadis HS, Higgins JP, Salanti G. Evaluation of inconsistency
in networks of interventions. Int J Epidemiol. 2013;42(1):332–45. 25. Donegan S, Williamson P, D'Alessandro U, Tudur Smith C. Assessing key
assumptions of network meta-analysis: a review of methods. Res Synth Methods. 2013;4(4):291–323.
26. Dias S, Welton NJ, Sutton AJ, Caldwell DM, Lu G, Ades A. NICE DSU technical support document 4: inconsistency in networks of evidence based on randomised controlled trials; 2011.
27. Bucher HC, Guyatt GH, Griffith LE, Walter SD. The results of direct and indirect treatment comparisons in meta-analysis of randomized controlled trials. J Clin Epidemiol. 1997;50(6):683–91.
28. Dias S, Sutton AJ, Welton NJ, Ades A. NICE DSU technical support document 3: heterogeneity: subgroups, meta-regression, bias and bias-adjustment; 2011.
29. Jaime Caro J, Eddy DM, Kan H, Kaltz C, Patel B, Eldessouki R, Briggs AH. Questionnaire to assess relevance and credibility of modeling studies for informing health care decision making: an ISPOR-AMCP-NPC good practice task force report. Value Health. 2014;17(2):174–82.
30. Schwarzer G. Meta: an R package for meta-analysis. R News. 2007;7(3):40–5. 31. Elliott WJ, Meyer PM. Incident diabetes in clinical trials of antihypertensive
drugs: a network meta-analysis. Lancet. 2007;369(9557):201–7.
32. Nikolakopoulou A, Mavridis D, Furukawa TA, Cipriani A, Tricco AC, Straus SE, Siontis GCM, Egger M, Salanti G. Living network meta-analysis compared with pairwise meta-analysis in comparative effectiveness research: empirical study. BMJ. 2018;360:k585.
Publisher’s Note
![Fig. 6 Posterior mean deviance comparison plot produced by the nma.compare() Function in BUGSnet.][Legend: Each data point represents atreatment arm’s contribution to posterior mean deviance for the consistency model (horizontal axis) and the inconsistency model (vertical axis)](https://thumb-us.123doks.com/thumbv2/123dok_us/9167083.1914108/11.595.57.540.86.350/posterior-comparison-represents-atreatment-contribution-consistency-horizontal-inconsistency.webp)
