Copyright © The Author(s). All Rights Reserved. Published by American Research Institute for Policy Development DOI: 10.15640/jfbm.v7n1a2 URL: https://doi.org/10.15640/jfbm.v7n1a2
Corporate Governance, Board Participation and Firm Performance of the Listed Companies
in Nigeria
Nwokwu, Tochukwu Christian
1,
Rathnasingha D. L. P. M.
2&
Pradeep Randiwela
3Abstract
This research is a cross sectional data and uses the correlation and regression models to publicly analyze available data for a sample of 69 firms quoted in the Nigerian Stock Exchange for one fiscal year. Several diagnostic tests have been used to justify the validity of the results. The empirical investigations reveal that board ownership and firm leverage have significant impact on performance. From a developing economy, this research paper is original that reveals the effect of board members participation on firm performance.
Keywords: Board Participation, TOBIN’S Q, Nigerian Stock Exchange, Capital Market, CEO Duality, Quantitative Research, Cross Sectional, and Diagnostic Tests.
1.Background of the Study
Corporate governance is an area of research that cuts across all companies whether multinational or non-multinational companies whether profit making or non-profit making organizations. In addition, corporate governance is practiced all over the globe, both in developed and developing countries. Though corporate governance can mean different things to different companies, but irrespective of these differences, there is one common central theme binding these differences, and that one common central theme is “The Proper Management of the Company” (Nwokwu, 2018).
A Board that is large has the tendency of having members who will not adequately contribute effectively to corporate performance. Whereas, Dharmadasa, Premarthne & Hearth (2014) supported the claim that small board size has influence on firm performance. However, resource dependency theory sees board members as essential resources.
Board ownership will encourage the board to protect the interest of shareholders by monitoring the managers (Coles, McWilliams & Sen, 2001). Carver (2010) argued that performance is attributed to board. Carver is right because it’s the board that manages the activities of the firm, in order to ensure that the interests of shareholders are protected in order to see that the company progresses. Combining the points of Coles, McWilliams & Sen (2001) and Carver (2010), it simply means that where there is board ownership, the board will be motivated to manage the activities of the company as well as ensuring that the interests of shareholders are protected. The boards of directors and its monitoring role have received increasing attention from researchers (Fama & Jensen, 1983). CEO non-duality will encourage effective monitoring of the companies activities as well as the management activities. In addition, the chairman of board should be a non-executive director also known as an independent director (Afolabi, 2015).
1 Post Graduate & Mid-Career Development Unit, Department of Finance, Faculty of Management and Finance, University of Colombo, Sri Lanka. E-mail: toojahchris@gmail.com
2 Senior Lecturer, Department of Finance, Faculty of Management and Finance, University of Colombo, Sri Lanka. E-mail:prasath@dfn.cmb.ac.lk
Governance is defined as the manner in which power is exercised in the management of economic and social resources for sustainable human development. This has assumed critical importance in these days of political pluralism. It is a vital ingredient in the maintenance of a dynamic balance between the need for order and equality in society, the efficient production and delivery of goods and services, accountability in the use of power, the protection of human rights and freedoms, and the maintenance of an organized corporate framework within which each citizen can contribute fully towards finding innovative solutions to common problems (Private Sector Corporate Governance Trust [PSCGT], 1999). Inamori, Analoui, and Korac-Kakabadse (2012) argue that positive perception and behaviour would bring out positive output in most organizations, which will therefore lead to organizational performance.
Consistent with the agency argument, the existing literature on BOD suggests that members of the BOD are expected to play an active role in monitoring the actions of managers on behalf of the owners, and that they will be more motivated to take such an active role if they have some claim to the firm’s output, possibly through their share ownership (Coles, McWilliams & Sen, 2001). However, any failure on the part of the board is a failure of the firm performance.
This study attempts to provide empirical evidence on the relationship between board participation and firm performance in Nigeria. This study intends to achieve this goal by taking the independent variables as a proxy for board participation, and taking the measure of performance utilized in this research as proxy for firm performance. Tobins Q. is the measure of performance utilized in this study.
2. Literature Review
Board ownership will encourage the board to protect the interest of shareholders by monitoring the managers (Coles, McWilliams & Sen, 2001). Though in previous literatures, some researchers are of the opinion that CEO non-duality is associated with performance (Azeez, 2015; Ruigrok, Peck & Keller, 2006). While on the other hand, other researchers are of the opposite opinion. Board Independenceis seen as unbiased and impartial in handling the affairs of the company. This view was supported by Iyengar & Zampelli (2009), who stated that independent boards are more effective at monitoring CEOs, in order to safeguard the interest of shareholders.
Board meeting is beneficial to both the shareholders and the stakeholders. And this was echoed in Vafeas (1999), when he observed that board meetings are essential during crisis in order to protect the interests of shareholders. He went on to say that board meetings will help to address issues of poor performance. Firm’s size has influence on firm’s activities. Also, on the other hand firm’s activities are expected to increase with firm size (Vafeas, 1999). The firm size being represented as the total assets of the firm is measured as the natural logarithm of total assets (Nwokwu, Dharmadasa, & Rathnasingha, 2018). Board members are expected to be qualified. However, to address the issue of board effectiveness and efficiency, board experience was introduced as another control variable. It is assumed that firms with qualified and experienced board members would be more effective in the discharge of their duties and responsibilities (Ehikioya, 2009; Nwokwu, Dharmadasa, & Rathnasingha, 2018). The use of leverage introduces positive changes like growth and expansion as well as motivating employees to work harder in order to service the debts and also to pay off the debts. Leverage also discourages self-serving behavior (Gibbs, 1993). In order to ascertain the monitoring level, another control variable known as firm’s leverage was introduced into this study. Because highly levered firms are closely monitored by debt providers (Broberg, Tagesson & Collin, 2010). The independent variable known as board size is very essential because, the board members are the people managing the affairs of the company. So therefore, it is needful to know the size of this board and to know how it is associated with corporate performance.
Also in order to effectively enforce and practice good corporate governance, it is advisable for countries that have different codes should ensure that those different codes are harmonized into one standard code in order to avoid any form of conflicts during the enforcement process of the good corporate governance. On the other hand if these different codes are not successfully harmonized into one standard code, it will have adverse effect on the companies as well as the economy as a whole (Aina & Adejugbe, 2015). This argument was supported by Senaratne & Gunaratne (2008), by saying that the presence of a number of codes and guidelines indicates a lack of uniformity in corporate governance rules. In addition to the above, there are different definitions of corporate governance by different reports, different countries, and different codes:
Corporate governance is the system by which companies are directed and controlled (Cadbury Report (1992) – UK).
Corporate governance describes the legal and factual regulatory framework for managing and supervising a company (Berlin Initiative Code (2000) - Tyskland).
Corporate governance is the goal, according to which a company is managed, and the major principles and frameworks which regulate the interaction between the company’s managerial bodies, the owners, as well as other parties who are directly influenced by the company’s dispositions and business (in this context jointly referred to as the company’s stakeholders). Stakeholders include employees, creditors, suppliers, customers and the local community (Nørdby Report & Recommendations (Des 2001) - Denmark).
Hypotheses
H1. Board meeting is associated with firm performance. H2. Board independence is associated with firm performance. H3. CEO Non-Duality is associated with firm performance. H4. Board ownership is associated with firm performance. H5. Board Relative is associated with firm performance. H6. Board size is associated with firm performance. 3. Method
As a result, researcher used the annual reports of the top companies quoted in the Nigerian Stock Exchange (NSE) as well as making use of secondary data sources; they indicate the internal consistency and validity. This section will be presenting the data analysis and interpretation of results. As well as several diagnostic tests has been applied to determine the validity of results. Empirical study on the impact of board participation on firm performance requires selection of appropriate performance measures for objective analysis.
3.1 The Model
The multiple regression models are defined by the equation below:
TOBIN’S Qi,t = ɑ0 + ɑ1BOMi,t + ɑ2BIDi,t + ɑ3CNDi,t + ɑ4BOWi,t + ɑ5BREi,t + ɑ6BOSi,t + ɑ7AGFi,t +
ɑ8BKNi,t + ɑ9FILi,t + μi,t……….……….(1)
TOBIN’S Q is the performance measure utilized in this research. BOM represents board meetings. BID stands for board independence. CND means CEO Non-Duality. BOW is board ownership. BRE simply means board relatives. BOS stands for Board Size. AGF represents Age of the Firm. BKN means board knowledge. FIL stands for Firm Leverage and μ represents Error Term.
Tobin’s Q. - This measure is also seen by researchers as a corporate performance measure. It is measured as the market value of equity capital and the book value of firm’s debt divided by the book value of total assets (Ehikioya, 2009).
3.2 Descriptive Statistics
Table 3.1: Descriptive Statistics of Corporate Performance
Source: Researcher’s Construction.
The findings and analysis of the results commenced by examining the data for certain corporate governance variables used in the empirical research. Table 3.1 presents a summary of the descriptive statistics of the dependent variable. The descriptive statistics is used to understand the nature of the variables. From the descriptive statistics, TOBIN’S Q has the respective values of 0.69 and 0.22 as its mean and standard deviation.
Table 3.2: Descriptive Statistics of Board Participation
BOM BID BOW BRE BOS AGF BKN FIL
Mean 5.289855 3.811594 0.159135 0.173913 9.811594 36.55072 9.739130 0.554220 Median 5.000000 4.000000 0.061600 0.000000 9.000000 32.00000 9.000000 0.520500 Maximum 12.00000 6.000000 0.893500 1.000000 18.00000 117.0000 18.00000 1.521300 Minimum 2.000000 1.000000 0.000300 0.000000 5.000000 5.000000 5.000000 0.063400 Std. Dev. 1.863752 1.101808 0.206456 0.381812 2.936962 23.00865 2.893462 0.275184 Skewness 1.384200 -0.353064 1.457124 1.720618 0.930323 1.107770 1.003356 0.497798 Kurtosis 4.982928 2.990061 4.422937 3.960526 3.322628 4.588135 3.558992 3.550318
Jarque-Bera 33.33862 1.433810 30.23809 36.69856 10.25251 21.36352 12.47566 3.720427 Probability 0.000000 0.488261 0.000000 0.000000 0.005939 0.000023 0.001954 0.155639
Sum 365.0000 263.0000 10.98030 12.00000 677.0000 2522.000 672.0000 38.24120 Sum Sq. Dev. 236.2029 82.55072 2.898444 9.913043 586.5507 35999.07 569.3043 5.149395
Observations 69 69 69 69 69 69 69 69
Source: Researcher’s Construction. 3.3 Correlation Analysis
Correlation Analysis is used to determine the association between the variables. Pearson’s correlation analysis has been applied.
TOBIN’S Q
Mean 0.699387
Median 0.700100
Maximum 1.545600
Minimum 0.243500
Std. Dev. 0.227131
Skewness 0.561644
Kurtosis 4.628025
Jarque-Bera 11.24769 Probability 0.003611
Sum 48.25770
Source: Researcher’s Construction.
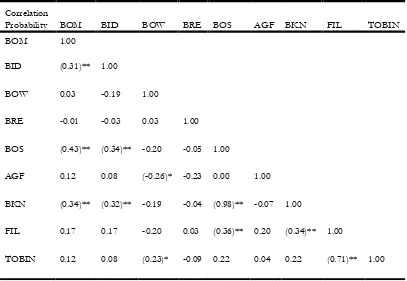
** and * indicate the significance levels at 0.01 and 0.05 respectively.
According to the correlation analysis, probabilities of the association between board meetings and board independence, board meetings and board knowledge, board independence and board size, board independence and board knowledge, board size and board knowledge, board size and firm leverage, board knowledge and firm leverage are all significant at 1% level, while board ownership and age of the firm, board ownership and TOBIN’S Q are having significant association at 5% level. Firm leverage also correlates with TOBIN’S Q at 1% significance level. This is highly significant.
Board ownership is the only independent variable whose hypothesis is accepted because it correlates with TOBIN’S Q., while board meeting, board independence, board relatives and board size are the independent variables whose hypotheses were all rejected because they did not correlate with TOBIN’S Q.
3.4 Regression Models and Diagnostics Tests
The results of the regression models and diagnostics tests are used in this section. 3.5 Diagnostic Test
Several diagnostic tests have been applied to test the validity of regression results. The researcher used Durbin-Watson statistics, Breusch-Godfrey Serial Correlation LM Test, heteroskedasticity test: Breusch-Pagan-Godfrey, multicollinearity test, cusum test and association between residuals and explanatory variables.
Table 3.4: Breusch-Godfrey Serial Correlation LM Test
F-statistic 0.214559 Prob. F(2,57) 0.8075 Obs*R-squared 0.515576 Prob. Chi-Square(2) 0.7728 Source: Researcher’s Construction.
Correlation
Probability BOM BID BOW BRE BOS AGF BKN FIL TOBIN
BOM 1.00
BID (0.31)** 1.00
BOW 0.03 -0.19 1.00
BRE -0.01 -0.03 0.03 1.00
BOS (0.43)** (0.34)** -0.20 -0.05 1.00
AGF 0.12 0.08 (-0.26)* -0.23 0.00 1.00
BKN (0.34)** (0.32)** -0.19 -0.04 (0.98)** -0.07 1.00
FIL 0.17 0.17 -0.20 0.03 (0.36)** 0.20 (0.34)** 1.00
TOBIN 0.12 0.08 (0.23)* -0.09 0.22 0.04 0.22 (0.71)** 1.00
According to Breusch-Godfrey Serial Correlation LM Test, probability of observed R square is 0.77. This is insignificant at 5%. It indicates that residuals are not correlated over the cross-sections. This means that results are valid. Table 3.3 provides heteroskedasticity test results.
Table 3.5: Heteroskedasticity Test: Breusch-Pagan-Godfrey
F-statistic 1.223425 Prob. F(9,59) 0.3241 Obs*R-squared 10.66821 Prob. Chi-Square(9) 0.2927 Scaled explained SS 22.08441 Prob. Chi-Square(9) 0.0072
Source: Researcher’s Construction.
Probability of the observed R-square of Breusch-Pagan-Godfrey Heteroskedasticity Test is 0.29. This is insignificant. Therefore, variance of residual is constant. It indicates that residuals are having homoscedasticity and model is appropriate.
Figure 3.1: CUSUM Test
Source: Researcher’s Construction.
Researcher tested the parameters stabilization using CUSUM test with respect to 5% level of significance. The curve behaves between the two (2) border lines. This indicates that the parameters (i.e. the constant and the individual beta values) of the regression models are stable. Accordingly, result is more valid. Furthermore, it also means that the model can be used for prediction because of the validity.
3.6 Effect of Board Participation on Tobin’s Q
The effect of board participation on TOBIN’S Q has been analyzed using multiple regression models. Result is provided by Table 3.6.
3.7 Multiple Regression Models
Multiple regression models are used to understand the effect of explanatory variables on firm performance. Regression model has been applied. When there is an outlier, the researcher applied a dummy variable to capture it.
-16 -12 -8 -4 0 4 8 12 16
45 50 55 60 65
Dependent Variable: Tobin’s Q Method: Least Squares
Sample: 1 69
Included observations: 69
Variable Coefficient Std. Error t-Statistic Prob.
C 0.286 0.084 3.416 0.001
BOM -0.008 0.010 -0.768 0.445
BID 0.008 0.015 0.545 0.588
BOW 0.382 0.084 4.528 (0.000)**
BRE -0.060 0.043 -1.407 0.165
BOS 0.019 0.031 0.606 0.547
AGF -0.000 0.001 -0.352 0.726
BKN -0.013 0.030 -0.429 0.670
FIL 0.567 0.069 8.179 (0.000)**
R-squared 0.726 Mean dependent var 0.699
Adjusted R-squared 0.684 S.D. dependent var 0.227
S.E. of regression 0.128 Akaike info criterion -1.145
Sum squared resid 0.962 Schwarz criterion -0.821
Log likelihood 49.501 Hannan-Quinn criter. -1.017
F-statistic 17.346 Durbin-Watson stat 1.824
Prob(F-statistic) 0.000 Source: Researcher’s Construction.
** and * indicate the significance levels at 0.01 and 0.05 respectively.
Probability of F-test statistics is 0.000. This is highly significant at 1% level. Therefore, explanatory variables jointly influence on TOBIN’S Q. As the P-value is highly significant, regression model is appropriate.
According to R squared, 72.6 % of TOBIN’S Q has been covered by the regression model. If the value is more than 60%, it means that the model is nicely fitted; hence, the model is more appropriate.
Only Hypothesis 4 was accepted because board ownership is positively significant at 1% level. Also firm leverage is positively significant at 1% level.
The independent variable known as CEO Non-Duality was dropped because it’s having singular matrix problem. In other words, there is no variability in the variable. This implies that the sample firms have it in record that both the chairman position and the CEO position were occupied by two different persons throughout the research.
When the results are briefed, board meetings, board independence, board relatives on board and board size are insignificant. Therefore, board meetings, board independence, board relatives on board and board size do not have individual effect on firm performance. But because the model is jointly significantly at 1% level (i.e. Prob. F-statistics = 0.000), therefore, board meetings, board independence, board ownership, board relatives and board size are having jointly influence on firm performance.
The researchers dropped firm size because it’s perfectly correlated with board knowledge. Therefore firm size is not available in the model, hence, no multicollinearity problem.
In connection with the regression model, probability of firm leverage is 0.000. This is highly significant at 1% level. It indicates that firm leverage significantly influence on TOBIN’S Q. Individual beta value is 0.56 and firm leverage has a significant positive effect on TOBIN’S Q. Since firm leverage is positively significant, the implication is that an increase in firm leverage will bring about an increase in firm performance and a decrease in firm leverage will lead to a decrease in firm performance.
Table 3.7: Relationship between Residuals and Explanatory Variables
Sample: 1 69
Covariance Analysis: Ordinary Correlation
Probability RESID
BOM 1.07E-16
P value 1.00
BID 2.68E-15
P value 1.00
BOW 1.03E-15
P value 1.00
BRE 3.68E-16
P value 1.00
BOS -6.12E-16
P value 1.00
AGF -6.78E-16
P value 1.00
BKN 5.54E-15
P value 1.00
FIL 7.45E-16
P value 1.00
Source: Researcher’s Construction.
Researchers tested the association between explanatory variables and residuals in Table 3.7. Probability of each independent variable is 1.00. They are perfectly insignificant. Therefore, residuals are not correlated with independent variables.
4 Discussion of Findings, Recommendations and Conclusion
Corporate governance researches have mainly been influenced by these three theories, which are: agency theory, stewardship theory and resource dependency theory. From an agency perspective, the board of directors helps to address the conflicts of interest between managers (agent) and shareholders (principal) and to bring their interests into congruence. In order to gain agent’s (manager’s) commitment to achieve the goals set by the principal (owner) and to promote goal congruent behavior, agents need to be given additional incentives over and above his/her basic remuneration. This was supported by Agrawal & Knoeber (1996), who argued that agency problems arise within a firm whenever managers have incentives to pursue their interests at shareholders expense. In situation like this, the board has to monitor such managers in order to protect the interests of the shareholders (Fama & Jensen, 1983). Furthermore, Dogan & Smyth (2002) made it clear that it is the board as a whole rather than the highest paid director that can be best regarded as the shareholders’ agent. Stimulated by the dominance of the agency theory in corporate governance, board effectiveness has commonly been viewed as the ability of boards to act independently from management to protect shareholders’ interest.
There is significant evidence that there is a need to encourage board ownership among board members in firms. This can be seen as result of their commitment in protecting the interests of investors, shareholders and other stakeholders by way of monitoring the activities of managers. Furthermore, this will create better incentives for the board members to undertake the monitoring process, and thus lead to superior performance. TOBIN’S Q revealed that board ownership is having positive influence on firm performance. This implies that an increase in board ownership will equally bring about an increase in the performance of the firm; also it means that a decrease in the board ownership will also lead to a decline in the company’s performance. As a result, firms should at all times consider the shareholdings of directors in order to achieve performance.
corporate governance variables. The reason is it’s having both individual and jointly influence on TOBIN’S Q. Also, board ownership correlates with TOBIN’S Q.
It should be noted that board ownership is the only independent variable that is significant with this measure of performance (TOBIN’S Q). In other words, board ownership is the only independent variable that is having significant association with market value of equity capital, book value of firm’s debt and book value of total assets. Also the hypothesis connected with board ownership is the only hypothesis accepted in this research. Furthermore, board ownership is the only independent variable with hypothesis that correlates with TOBIN’S Q at 5% significance level.
For Tobin’s Q, the firm leverage is positively significant at 1% level. This is highly significant. This implies that the more the Nigeria firms depend on debt to expand, the more they will have increase in their performance and the less they depend on debt, the lower their performance. This suggests that larger firms with higher levels of debt ratio perform better than smaller firms. The finding on leverage is in line with extant literature. Nwokwu (2018) findings reveal that the leverage of the firm is positively significant at 5% level with price earning. However, firm leverage is insignificant with EPS and ROA (Azeez, 2015; Nwokwu, Dharmadasa, & Rathnasingha, 2018).
Firm leverage is significant with TOBIN’S Q. Accordingly; Firm leverage is having association with market value of equity capital, book value of firm’s debt and book value of total assets. Firm leverage also correlates with TOBIN’S Q at 1% significance level. From the findings of other researchers, it shows that firm leverage is insignificant with other measures of performance (Nwokwu, Atapattu and Azeez, 2019; Azeez, 2015).
The regression model recorded that firm leverage is positively significant. This suggests that larger firms with higher levels of debt ratio perform better than smaller firms. It is recommended that Nigeria firms should also place firms leverage as priority when considering any of the corporate governance variables. The reason is because it’s having both individual and jointly influence on TOBIN’S Q. Also, firms leverage correlates with TOBIN’S Q. However, even though some of the other independent variables are not individually significant with TOBIN’S Q, but they are jointly having effect on TOBIN’S Q. Therefore, it’s of paramount important that those variables should not be taken in isolation; rather they should all be considered jointly in order for them to really have jointly effect on firm performance.
Though this research is on developing economy, it should not be limited to developing Nations. The applicability of these recommendations and suggestions should not only be limited to developing economy, but to developed countries who sees what will be of great importance to their corporate governance practices when they apply such recommendation(s) and suggestion(s).
5. Limitations and Further Research
Due to long distance, the researchers were unable to visit the sample firms and collect their annual reports. But the researchers made efforts to visit their websites and collect the needed data required. Though the internet was an easy access to collect the data, but on the other hand, some of the companies denied the researchers access to their official websites where the researchers can easily have access to their annual reports and while some other companies did not publish their annual reports online. Even though this study contributes to the body of literature on different ways, the results are not conclusive. Observations covering a period of one year may not be representative. Therefore, other researchers can look into this research by considering more than one year.
References
Afolabi, A. A. (2015). Examining corporate governance practices in Nigerian and South African firms. European Journal of Accounting, Auditing and Finance Research, 3(1), 10-29.
Agrawal, A., & Knoeber, C. R. (1996). Firm performance and mechanisms to control agency problems between managers and shareholders. The Journal of Financial and Quantitative Analysis, 31 (3), 377-397.
Aina, K. and Adejugbe, B. (2015). A review of corporate governance codes and best practices in Nigeria. Journal of Law, Policy and Globalization, 38, 78-87.
Azeez, A. A. (2015). Corporate governance and firm performance: Evidence from Sri Lanka. Journal of Finance and Bank Management, 3 (1), 180-189.
Broberg, P., Tagesson, T., & Collin, S. O. (2010). What explains variation in voluntary disclosure? A study of the annual reports of corporations listed on the Stockholm Stock Exchange. Journal of Management and Governance, 14, 351-377.
Cadbury Report (1992). The financial aspects of corporate governance.
Carver, J. (2010). A case for global governance theory: Practitioners avoid it, academics narrow it, the world needs it. Corporate governance: An International Review, 18 (2), 149-157.
Coles, J. W., McWilliams, V. B., & Sen, N. (2001). An examination of the relationship of governance mechanisms to performance. Journal of Management, 27 (1), 23.
Denmark Corporate Governance Report and Recommendations (2001).
Dharmadasa, P., Premarthne, G., & Hearth, S. K. (2014). Corporate governance, board characteristics and firm Performance. Evidence from Sri Lanka. 21 (1), 7-31.
Dogan, E., & Smyth, R. (2002). Board remuneration, company performance, and ownership concentration: Evidence from publicly listed Malaysian companies. ASEAN Economic Bulletin, 19 (3), 319-347.
Ehikioya, B. I. (2009). Corporate governance structure and firm performance in developing economies: Evidence from Nigeria. Emerald Group Publishing Limited, 9 (3), 231-243.
Fama, E. F., & Jensen, M.C. (1983). Separation of ownership and control. The Journal of Law and Economics, 26 (2), 301-325.
Fagbadebo, O. (2007). Corruption, governance and political instability in Nigeria. African Journal of Political Science and International Relation, 1(2), 28-37.
Gibbs, P. A. (1993). Determinants of corporate restructuring: The relative importance of corporate governance, takeover threat, and free cash flow. Strategic Management Journal, 14 (S1), 51-68.
Iyengar, R. J., & Zampelli, E. M. (2009). Self-selection, endogeneity, and the relationship between CEO duality and firm performance. Strategic Management Journal, 30 (10), 1092-1112.
Nwokwu, T. C. (2018). The Influence of Board Involvement on Price Earning: Evidence from Nigeria. International Journal of Recent Advances in Multidisciplinary Research, 5(7), 3967-3973. Retrieved from http://www.ijramr.com/issue/influence-board-involvement-price-earning-evidence-nigeria
Nwokwu, T. C., M. P. Dharmadasa, P., & D. L. M. Rathnasingha, P. (2018). Board Involvement on Earnings per Share (EPS): Evidence from a Developing Economy. International Journal for Innovation Education and Research, 6(5), 130-141. Retrieved from http://www.ijier.net/ijier/article/view/1031
Nwokwu, T. C., Atapattu, A. M. C. P. and Azeez, A.A. (2019). The Impact of Board Members Involvement on Return on Equity (ROE). Modern Economy, 10, 1334-1347.https://doi.org/10.4236/me.2019.104090 Private Sector Corporate Governance Trust, (1999). Principles for corporate governance in Kenya and a sample code
of best practice for corporate governance.
Ruigrok, W., Peck, S. I., & Keller, H. (2006). Board characteristics and involvement in strategic decision making: Evidence from Swiss companies. Journal of Management Studies, 43 (5), 1201-1226.
Senaratne, S. and Gunaratne, P. S. M. (2008). Corporate governance development in Sri Lanka: Prospects and problems”.