VOLUME 38, ARTICLE 58, PAGES 1777,1814
PUBLISHED 29 MAY 2018
http://www.demographic-research.org/Volumes/Vol38/58/ DOI: 10.4054/DemRes.2018.38.58
Research Article
Family structure and child development in
Chile: A longitudinal analysis of household
transitions involving fathers and grandparents
Sarah A. Reynolds
Lia C.H. Fernald
Julianna Deardorff
Jere R. Behrman
© 2018 Sarah A. Reynolds et al.
This open-access work is published under the terms of the Creative Commons Attribution 3.0 Germany (CC BY 3.0 DE), which permits use, reproduction, and distribution in any medium, provided the original author(s) and source are given credit.
1 Introduction 1778
1.1 Fathers 1778
1.2 Grandparents 1780
1.3 The Chilean context 1781
1.4 Contributions to the literature 1782
2 Data 1784
2.1 Variable definition 1784
2.2 Attrition and sample size 1786
2.3 Sample description 1787
3 Main analysis 1790
3.1 Empirical specification 1790
3.2 Results 1792
4 Supporting analyses 1796
4.1 Robustness checks for identity 1796
4.2 Does income explain the association between grandparent separation and reduced vocabulary scores?
1798
5 Discussion 1798
6 Acknowledgments 1803
References 1804
Family structure and child development in Chile:
A longitudinal analysis of household transitions involving fathers
and grandparents
Sarah A. Reynolds1
Lia C.H. Fernald2
Julianna Deardorff3
Jere R. Behrman4
Abstract
BACKGROUND
Adults support child development economically, socially, and emotionally. Household transitions may disrupt these support structures, impacting child development.
OBJECTIVE
We document the large portion of children in Chile that experience biological-father and grandparent household transitions, and test if these transitions are associated with child vocabulary and behavior and if income could be a mechanism behind our findings.
METHODS
We apply first-differences and lagged-dependent-variable analyses to a large, nationally representative, longitudinal survey of over 5,000 Chilean children.
RESULTS
We find that children whose mothers separated from their parents’ homes within the two years between two survey rounds have worse age-normalized Peabody Picture Vocabulary Test scores than children in households without such transitions. Changes in income per capita do not explain these associations. When fathers enter households between the two survey rounds there is a gain in income per capita but no association between father entrance and child’s vocabulary score. Similarly, there is no significant association between fathers separating from the household and child vocabulary, though
1 School of Public Health, University of California, Berkeley, USA. Email: [email protected]. 2 School of Public Health, University of California, Berkeley, USA. Email:[email protected]. 3 School of Public Health, University of California, Berkeley, USA. Email:[email protected]. 4 Department of Economics, University of Pennsylvania, Philadelphia, USA.
father departure is associated with lower income per capita. We find no association between household transitions and Child Behavioral Checklist (CBCL) scores.
CONCLUSIONS
These findings provide evidence that Chilean grandparents promote language development when coresiding with their grandchildren and that Chilean fathers are an important source of household income.
CONTRIBUTION
Our study examines fathers and grandparents simultaneously. We are able to take the directionality (i.e., movement in or out of the home) of biological father transitions into account.
1. Introduction
Better early child development is associated with improved cognitive development and achievement outcomes later in life (Britto et al. 2016; Engle et al. 2007, 2011). Enhanced early cognitive skills, including those related to language, are associated with lower levels of risky behavior and higher labor market earnings later in life (Gertler et al. 2014; Heckman, Stixrud, and Urzua 2006; Walker et al. 2011). Participation in programs designed to improve socio-emotional functioning early in childhood also correlates with academic and labor market earnings later in life (Bierman et al. 2010; Chetty et al. 2011).
Child development outcomes are affected by household composition and by changes to the household resulting from marriage, divorce, death, and other events. Changes in household structure during early childhood can result in insecure attachments and ambiguity in household rules, family relationships, and parental expectations about behavior (Pleck 2007; Hetherington, Bridges, and Insabella 1998). These transitions can influence cognitive development (Mikulincer, Shaver, and Pereg 2003) and can contribute to lower academic performance (Kurdek, Fine, and Sinclair 1995).
1.1 Fathers
Yet the conclusion that fathers support children’s socio-emotional development may not extend into early childhood. Only four of the twenty-three studies on socio-emotional outcomes reviewed by McLanahan, Tach, and Schneider include children younger than age five years, and the results are mixed (2013).
With respect to education, McLanahan et al.’s review indicates that father presence is strongly associated with higher levels of academic achievement, but less strongly with test scores (2013). They do not review any studies on academic achievement for very young children, however, but that omission is unsurprising since young children are not yet in school. More salient are two studies, both using child fixed effects, on family structure and test scores for children younger than age 5. Foster and Kalil find little association between family structure and vocabulary (Foster and Kalil 2007), but Cooper et al. find that more transitions (both coresidence with and dating of mothers’ romantic partners, which can include biological fathers) are negatively associated with children's verbal ability at age five (2009). Discrepancies in these results may arise from Foster and Kalil’s exploration of family types such as extended and single mother households, but they do not include transitions of romantic partners who do not coreside.
There are a variety of mechanisms by which father absence could influence child development. We discuss three, although our data only allows us to test one. First, income or wealth may explain some of the association between father absence and poor child development outcomes. There is strong evidence that parental union dissolution resulting in father absence is associated with economic disadvantage for children (Amato 2010; McLanahan, Tach, and Schneider 2013; Page and Stevens 2004; Thomson, Hanson, and McLanahan 1994). Engagement may also be a mechanism by which fathers support children’s well-being. In a meta-analysis, fathers’ engagement (through helping children with homework, listening to children’s problems, providing emotional support, and setting limits) is associated with fewer behavioral problems (Amato and Gilbreth 1999), and a randomized intervention of individual and group counseling to improve divorced, non-coresident fathers’ relationships with their children and ex-wives reduced behavioral problems among children aged four to twelve (Braver, Griffin, and Cookston 2005). Finally, community social capital available to fathers but not mothers (i.e., more prestigious positions in business, local community governance, or religion) could support child development by providing access to resources or status for the child (Astone et al. 1999; Pleck 2007). However, as it is more difficult to measure social capital there is less research on this mechanism.
child was born are cohabitating or married one year after the birth (Carlson, McLanahan, and England 2004). These transitions could have a positive or a negative influence on early child development, given the findings that father presence is generally positive but the stress of household transitions is negative. For example, the number of mothers’ romantic transitions (exiting or entering relationships with partners not limited to the children’s biological fathers) has been associated with worse children’s behavior at age three (Osborne and McLanahan 2007). A review of associations between step-parent presence and child outcomes suggests children with step-parents in the household do worse than children in households where both biological parents are present, but children with step-parents in the household fare similarly academically and behaviorally to children of single mothers (Coleman et al. 2000). However, there is limited evidence regarding how household formation with the child’s biological father after the child’s birth may relate to the child’s welfare.
In summary, theories suggest that fathers’ economic resources, engagement, and social capital are supportive of child development, and research finds that father presence is associated with economic benefits but not necessarily with gains in child development. Longitudinal studies on divorce show children with co-resident fathers have better socio-emotional outcomes, but find mixed evidence regarding gains in the cognitive and academic realms. In the subset of studies that examine the effects of divorce from early childhood (under age 5) the results regarding child outcomes are mixed. The family transition of fathers entering households is an important area of new research, which will provide insight on whether the stress of the transitions can be outweighed by the benefits of father presence.
1.2 Grandparents
presence and child outcomes when both parents are in the household (Aquilino 1996; Deleire and Kalil 2002; Dunifon and Kowaleski-Jones 2007; Monserud and Elder 2011). These findings suggest that grandparent impact on child development may be moderated by mothers’ partnership status, probably due to the fathers already providing support.
Another moderator may be the cultural role of grandparents’ engagement with grandchildren. There is emerging evidence that associations between grandparent coresidence and child outcomes vary by culture. For example, studies on early childhood in the United States find that grandparent coresidence is associated with higher child development scores for Hispanic and Black children, but not for White children (Pilkauskas 2014; Mollborn, Fomby, and Dennis 2010). These discrepancies may arise from different cultural norms influencing how grandparents engage with grandchildren, with some focusing more on nurturing care (stimulation, education, comfort) and others supporting functional care (feeding, cleaning).
Alternatively, grandparent care may be more important in some contexts than in others, even if that care is the same. For example, grandparent coresidence could have more impact in smaller, urban families than in large, extended rural families where children interact with many adults in the home. Similarly, the impact of social capital can differ depending on the community. These mechanisms could explain differences in research on grandparents in Asia. Using an OLS model that compares transitioning families to nontransitioning families in Taiwanese panel data, Pong and Chen (2010) find long-term coresidence with grandparents to be associated with higher cognitive test scores in young adolescents; a recent transition to coresidence confers no such advantage. By contrast, a cross-sectional analysis from rural China suggests that living with grandparents with low levels of schooling compared to the population does not affect children’s educational attainment, but living with relatively well-schooled grandparents is significantly associated with a lower likelihood of school dropout (Zeng and Xie 2014).
In comparison to research on fathers, research on the role of grandparents and their influence on children’s development is mixed, likely because the grandparental role is more heterogeneous across family situations and cultures. That findings appear to vary by grandparent and mother circumstances, as well as culture, suggests that context is crucial for understanding and interpreting findings.
1.3 The Chilean context
marriage has become less common. In 1999 children born out of wedlock were granted equal child support rights as those born to married couples and in 2004 divorce was legalized with mandated alimony, although prior to that annulments had been common. In contrast to 1970, when 51% of women aged 18–45 were married, only 43% were married by 2002 (Salinas 2011). By 2012 almost 70% of Chilean children age 1 year had mothers living out of wedlock; 30% of children’s mothers were not cohabitating with the child’s father (Centro Microdatos 2013). Second, Chile has a relatively high teen fertility rate. Though the level of the Chilean adolescent fertility rate was similar to that of the United States in 1960 (respectively 89 and 85 births per 1,000 adolescents ages 15–19), in 2015 Chile’s adolescent fertility was 48 births per 1,000 adolescents. This more recent figure is on a par with Colombia and Peru, two middle-income countries,5 while the US adolescent fertility rate, at 21 births per 1000, was less than
half that of Chile (United Nations, Department of Economic and Social Affairs, Population Division 2015). Young and single Chilean mothers have come to depend on their extended families for support. Similar to other Latin Americans, Chileans value and frequently live in extended family households. Indeed, in Chile and elsewhere in Latin America the portion of intergenerational households is on the rise (Ruggles and Heggeness 2008), as it is in the United States (Dunifon, Ziol-Guest, and Kopko 2014). The increased acceptability of single parenthood allows mothers to continue living with their parents until they are ready to cohabit with the children’s fathers or live on their own. Similarly, women choosing to separate from a spouse have more economic and social support than before. Consistently throughout the past decade, over 20% of mothers of children under age six lived with their parents (see Appendix). In the context of teen pregnancy and more young women entering the labor force (The World Bank 2014) the grandmother role has been transforming in Chile, moving from supportive (such as helping the mother with chores or occasional babysitter) toward primary caregiver (Moreno and Sandoval 2015).
1.4 Contributions to the literature
Although there is strong evidence that transitions in household membership are associated with child development, a number of gaps remain in the literature. Most research focuses on associations between a single household member (e.g., father or grandparent) and child well-being. We are aware of only one paper that compares these associations for both grandparents and fathers and examines child health; this paper found father exit, but not grandparent transitions, to be associated with child anemia in Mexico (Schmeer 2013). Using lagged dependent variable models, Schmeer finds the
lowest risk of child anemia among stable, father-present households; consistent maternal grandparent presence also reduces the risk of anemia, while a maternal grandparent transitioning in or out is not significant. Migration is one of the key reasons for the transitions in Mexico, so exploring transitions in Chile, where migration is less common, is of interest.
Directionality of transitions (i.e., movement in or out of the home) is also a relatively new area of research, as earlier studies focus mainly on father separation or divorce. Additionally, these studies focus on school achievement and adolescent behavior, not on early childhood outcomes. To our knowledge, in the literature only a few studies examine household transitions and behavioral and emotional outcomes during early childhood (Cavanagh and Huston 2006; Mollborn, Fomby, and Dennis 2010; Osborne and McLanahan 2007; Pilkauskas 2014). Compelling evidence suggests that transitions during early childhood may influence child behavior more than transitions in middle childhood (Ryan and Claessens 2013).
Studies of household transitions using natural experiments or instrumental variables6 that allow for a causal interpretation are rare in the household structure
context (McLanahan, Tach, and Schneider 2013), and actual experiments have not been performed and would have ethical concerns. We use a large, nationally representative, longitudinal survey of Chilean children aged 0‒5 years at baseline and apply first-differences and lagged-dependent-variable approaches as next-best options to measure the extent to which household transitions of biological fathers and grandparents impact child development outcomes. These methods reduce the concerns about omitted variable bias found in cross-sectional studies.
This rich survey data allows for two particular strengths of our study. First, we are able to take the directionality (i.e., movement in or out of the home) of biological father transitions into account, incorporating a relatively new innovation in the literature, although we are unable to assess the directionality of grandparent transitions because of the small sample size of grandparents entering the household. Second, we examine how two measures of early childhood development (vocabulary and behavioral scores) are associated with these transitions, and we test if change in family income accounts for the associations between household transitions and child outcomes. Based on the literature, we hypothesize that father transitions will be associated with developmental outcomes for children, with exit causing both more transition stress and father absence
6 We are unable to use grandparent death as an instrument because there is no information on why household
problems (e.g., reduced income). However, the impact of entrance may be smaller, although transition stress still occurs, in spite of benefits from father coresidence (e.g., increased income). Since the literature on grandparents is very heterogeneous we do not articulate a hypothesis about grandparent separation and child development.
2. Data
We used data from a nationally representative survey of 15,175 children born between January 1, 2006, and August 31, 2009, the Encuesta Longitudinal de Primera Infancia (ELPI, Longitudinal Survey of Early Life ‒ Centro Microdatos 2013). The first round of ELPI was conducted in 2010 among children 0–5 years old, and the second round was conducted in 2012. Only one child per household was surveyed.
2.1 Variable definition
We use the term household to refer to members of the household roster of the ELPI survey. Our household transition indicator variables for entry into the household take value 1 if the individual (father or grandparent) is in the household in 2012 but not in 2010. Likewise, the indicator variables for separation take the value of 1 if the individual is present in the household in 2010 but not in 2012.
These variables have some limitations. The grandparent indicator variables only consider if there is at least one grandparent in the household and do not take into account the identity (e.g., paternal grandfather) or number of grandparents, as exploring each of the distinct combinations would result in too small a sample size. We are unaware of the location of the household, but when the father separates from the household he is likely exiting the mother’s and child’s dwelling, while when the child’s household no longer includes grandparents the mother and her child are separating from the grandparent’s dwelling. We are unable to account for these distinctions in the analysis and use the term exit and separation interchangeably throughout.
The second outcome variable measures parent-reported child behavior. The Spanish version of the Child Behavioral Checklist (CBCL) was administered to parents of children aged 18 months to 6 years. The CBCL is a validated, reliable, parent-completed checklist consisting of 99 items assessing a range of problem behaviors relating to socio-emotional well-being (Achenbach and Rescorla 2000). It has been validated in Argentina and Uruguay, two Latin American countries near Chile (Corina 2008; Viola, Garrido, and Rescorla 2011). The CBCL has two major composite scales for Externalizing and Internalizing behaviors. The Externalizing scale is comprised of two subscales (Aggressive Behavior and Attention Problems), and the Internalizing scale has four subscales (Emotionally Reactive, Anxious/Depressed, Somatic Symptoms, and Withdrawn). We present results based on the total score because using the scores for the two sub-scales yielded similar results.
Within each year of the survey and using the entire population tested, we normalize the scores of both these tests. As implemented previously (Fernald et al. 2011), we generate means of 100 and standard deviations of 15 for children within two-month age windows but do not normalize separately by sex; we include sex as a control variable. In order to make sure that the TVIP and the CBCL can be interpreted in a parallel manner, we adjust the CBCL behavioral scale (maintaining the same mean and standard deviation) so that, for both scales, higher values can be interpreted as having better outcomes (e.g., larger vocabulary, better behavior). Interpretations of changes in outcomes should be considered relative, not absolute.
We control for a variety of potential confounders, including child variables (sex, age in months, ever attended preschool, grandmother caregiver), mother variables (age at first birth, employment status, normalized scores of math and vocabulary ability, education level, and indigenous status), and household variables (number of siblings, urban residence, and log per capita income). We also control for father and grandparent presence in the household in 2010 as indicator variables.
2.2 Attrition and sample size
About 15% of children in the 2010 sample were not resurveyed in the 2012 follow-up. Although in 2010 attriters and non-attriters had similar proportions of families with fathers, the non-attriters had a larger percentage of families with grandparents living in the household (39%) than attriters (33%). Appendix Table A-1 shows individual testing of means of the 2010 control variables and indicates that two-thirds of these variables differ significantly from each other by attrition status. An F-test of a logit predicting attrition, using the household structure and control variables from 2010, also indicates a statistically significant difference between the two populations, including the household structure variables. We apply inverse probability weights to our analyses to account for this attrition: We multiply the sample weights by the inverse of the probability of being in the sample. This probability is generated by a logit regression (Table A-2). Although some variables significantly predicted attrition the overall fit of the model was low, suggesting that attriters did not predictably differ much from non-attriters. Because of this poor fit the population weights that were re-weighted with the inverse probability weights differ little from the original population weights. Results are robust to using the original population weights.
Almost all young children surveyed lived with their mothers (over 98%), so we did not include a variable for mother presence and excluded from the analysis those who did not live with their biological mother. We maintained families with stepfathers in the analysis but did not analyze the associations of stepfather presence and child development, since few children had stepfathers (1.5% of children in 2010, 3% in 2012).
2.3 Sample description
In 2010 over third of children lived with at least one grandparent and almost one-third did not have their biological father living in their household; between 2010 and 2012, 21% experienced a household transition involving fathers and/or grandparents. Specifically, 20% of children with a grandparent in the household in 2010 no longer lived with their grandparents by 2012. 9% of children with a father in the household in 2010 no longer had the father in the household by 2012. 13% of children without a father in the household experienced their biological fathers joining the household. A transition table shows the percentages of children experiencing the different types of household transition (Table 1). The probability of children with cohabitating fathers experiencing father separation (9%) is lower than the probability of children without cohabitating fathers experiencing biological father entrance into the household (13%).
Table 1: Percentages of children in different household structures of fathers and grandparents by survey year
2012 Household structure
Neither grandparent nor father
Both grandparent
and father Grandparentonly Father only Total
2010 Household structure
Neither grandparent
nor father 6.70% 0.10% 0.70% 1.50% 9.10%
Both grandparent
and father 0.40% 8.70% 1.90% 4.30% 15.30%
Grandparent only 2.20% 1.60% 17.00% 1.70% 22.50%
Father only 3.70% 1.50% 1.00% 46.90% 53.10%
Total 13.10% 11.90% 20.60% 54.30% 100%
N = 12,898
Table 2: Summary statistics of household structure
Sample defined by availability of outcome: Vocabulary Behavior Income All*
Household structure in 2010
Father in household 70% 69% 69% 70%
Grandparent(s) in household 35% 37% 38% 35% Father in household X grandparent(s) in household 14% 14% 15% 13% Mother only in household 2010 9% 8% 8% 8%
Household transitions from 2010–2012
Separate from grandparent(s) 8% 8% 8% 8%
Join father 4% 5% 5% 4%
Separate from grandparent X join father 1% 2% 2% 1%
Separate from father 6% 6% 6% 6%
No transition 84% 83% 82% 84%
N 5,170 6,330 10,813 3,503
Note: * Observations have values for all outcome variables; referred to as ‘comparable sample’ in the text.
Source: 2010–2012 ELPI; Sample defined by children with complete values on all control variables; see Table 3 for controls and outcomes.
Table 3: Summary statistics
Sample defined by availability of
Vocabulary outcome
Behavior outcome
Income outcome
All outcomes*
N = 5,170 N = 6,330 N = 10,813 N = 3,503
Variable mean sd mean sd mean sd mean sd
Child variables
Vocabulary score (TVIP 2010) 100.06 14.93 100.06 15.09 99.99 14.90 100.12 15.09 Vocabulary score (TVIP 2012) 100.35 14.88 100.13 14.90 100.11 14.93 100.22 14.95 Behavior score (CBCL 2010) 99.55 14.94 99.53 14.98 99.73 14.93 99.43 14.99 Behavior score (CBCL 2012) 99.97 14.78 99.97 14.86 100.02 14.92 99.96 14.79 Female 0.50 0.50 0.50 0.50 0.49 0.50 0.50 0.50 Age in months (2010) 41.08 6.88 31.52 8.16 30.44 12.80 37.52 4.85 Ever attended preschool
(2010) 0.65 0.48 0.45 0.50 0.45 0.50 0.56 0.50 Grandmother caregiver (2010) 0.17 0.37 0.17 0.37 0.16 0.37 0.17 0.38
Mother variables
Mother's age at first birth 22.59 5.25 22.40 5.26 22.40 5.23 22.55 5.26 Mother employed (2010) 0.45 0.50 0.42 0.49 0.42 0.49 0.44 0.50 Mother's math ability score
(WAIS) 99.60 14.72 99.71 14.76 99.73 14.96 99.75 14.90 Mother's vocabulary ability
score (WAIS) 99.71 14.91 99.63 14.86 99.66 14.91 99.72 14.88 Primary education only
completed 0.19 0.39 0.18 0.39 0.18 0.39 0.19 0.39 Secondary education but no
tertiary 0.59 0.49 0.60 0.49 0.60 0.49 0.60 0.49 Indigenous 0.08 0.28 0.08 0.28 0.08 0.28 0.08 0.27
Household variables
Number of siblings 1.01 1.00 0.95 0.99 0.94 1.00 0.98 1.00 Urban 0.89 0.32 0.89 0.32 0.89 0.31 0.89 0.31 Log per capita income (2010) 4.92 0.84 4.92 0.84 4.93 0.85 4.92 0.84 Log per capita income (2012) 5.15 0.78 5.16 0.78 5.17 0.79 5.16 0.77
Note: *Referred to as the ‘comparable sample’ in the text. Variables without standard deviation are dichotomous. Vocabulary is standardized (mean 0; sd 15) score on the Spanish version of the Peabody Picture Vocabulary Test. Behavior is standardized (mean 0; sd 15) score on the Child Behavior Checklist. Income is log per capita income in Chilean pesos/500 ~1US$.
79% of children who had grandparents in the home in either survey year lived with maternal grandparents. Families were more likely to have grandmothers in the household than grandfathers: 40% of households with grandmothers did not have grandfathers, but only about 10% of households with grandfathers did not have grandmothers in either survey year.
The pattern of household transitions suggests that mothers tend to move away from their parents and form independent households with biological fathers. Over 50% of first-time mothers lived with the children’s grandparents in 2010, suggesting that many women do not leave their parents’ home before the first child is born; this portion drops for subsequent children (Figure 1). Additionally, older mothers are less likely than younger mothers to live with their children’s grandparents and more likely than younger mothers to live only with the children’s father (Figure 2). The fraction of mothers living with their own parents has stayed relatively constant over time; the Appendix includes additional details about historical data.
Figure 1: Percentages of mothers in different household arrangements by number of children
Source: ELPI 2010.
0
2
0
4
0
6
0
8
0
1
00
1 2 3 4
Number of children
% living with neither child's biological father nor grandparent(s) % living with child's grandparent(s) only
Figure 2: Percentages of mothers in different household arrangements by age
Source: ELPI 2010.
Children in our final sample were 7‒58 months old in 2010 and 33–83 months in 2012. Children in the TVIP sample were 30‒58 months and 52‒83 months in 2010 and 2012 respectively. Children in the CBCL sample were 18‒50 months and 39‒71 months in 2010 and 2012 respectively. Children in the comparable sample were 30–50 months and 52‒71 months in 2010 and 2012 respectively. Summary statistics for the outcome variables and additional covariates are presented in Tables 2 and 3. Between 2010 and 2012, two-thirds of the control variables differed statistically between families with a stable household structure and families that experienced a transition (Table A-3).
3. Main analysis
3.1 Empirical specification
We apply two estimation strategies to the longitudinal data to evaluate the association between household transitions and child development outcomes. If our models are correct, we can assign causality to the relationship. While we use causal terminology such as ‘bias’ in the empirical discussion, particularly since longitudinal analysis is more plausibly causal than a cross-sectional approach, we conservatively use the word ‘association’ to discuss the results.
The lagged-dependent-variable model implies that growth in child development in the current period is dependent on past levels as well as on fixed variables such as mother’s intelligence. The estimation strategy is a standard OLS model with additional controls for prior values of the outcome variables:
0
2
0
4
0
6
0
80
1
00
15 20 25 30 35 40 45
Age
Yj
2012= a0+ a1G- + a2F+ + a3G-x F+ + a4F- + a5X2010+ a6Y2010 + e (1)
Y is the jth outcome variable (vocabulary, behavior, or income per capita) in 2012.
F and G refer to biological father and grandparent transition indicator variables, with the superscript minus or plus indicating separation from or entry into the household, respectively. The omitted category is ‘no transition.’ We exclude 3% of households with transitions in which grandparents join the household or in which there is separation from both grandparent(s) and father. There are sufficient observations to allow including an interaction term indicating the grandparent separating and the father joining. X2010 are mother, child, and household characteristics, and we also control for
2010 values of the outcome variables (Y2010). In some specifications (larger samples),
however, we only include the jth outcome variable on the right hand side. The error term
is represented by e.
Since endogeneity of the lagged term is a concern with the lagged dependent variable model, we include first differences as a robustness check. This model examines changes in child development and assumes these changes are only based on time-varying factors. In the first difference estimation strategy (equivalent to child fixed-effects) we do not include controls because most of our covariates are time invariant, and those that were not – preschool attendance, number of siblings, and per capita income – are endogenous and dependent on household structures. Age varies with time, but our outcome variables are normalized by age and the variation is about the same for everyone: the two years between surveys.
∆Y =0+1G- +2F+ +3G-x F+ +4F- +δ (2)
To directly compare the first difference model to the lagged outcome variable model, the first-differences model changes the outcome to ΧY and removes Y2010 +
X2010 from the right side, in effect imposing the restriction that a6 be equal to 1.7 This
introduces the concern that the first-difference estimation will be biased should the restriction be unrealistic. Yet the lagged-dependent-variable estimation has its own concerns, since it does not control for unobserved, time-invariant factors. Fortunately, the lagged-dependent-variable and first-differences estimates bound the true value if the true model happens to be a combination of both types of model (and is not correlated with unobserved time-variant factors) (Angrist and Pischke 2008). We do not attempt to estimate this combined model because conditions for consistent estimation are much more demanding than for either alone (Angrist and Pischke 2008); instead we compare the two methods for robustness.
7 Empirical tests of a
6 = 1 fail, suggesting that the more complex model described in this paragraph is more
We apply the two approaches to each sample: the larger samples (one each for vocabulary, behavior, and income) and the comparable sample, which restricts the sample based on the availability of the other outcome variables. We delete observations with missing values of any variable, but also apply multiple imputation as a robustness check and get similar results (available upon request).
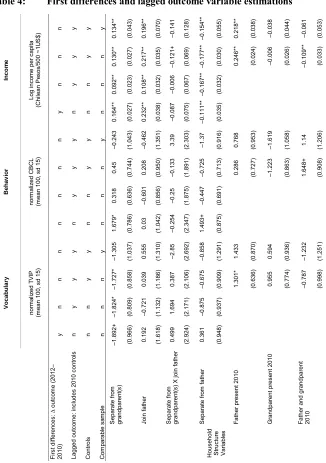
For each outcome we present four specifications: (1) first differences using the sample specific to the outcome variable, (2) and (3) lagged dependent variable with and without controls using the sample specific to the outcome variable, and (4) lagged dependent variable with controls using the comparable sample. In the comparable sample specifications we also include the other child development test’s lagged value as a control to gain precision. We apply the sample weights multiplied by the inverse probability weights generated to correct for attrition in all regressions.
3.2 Results
4. Supporting analyses
4.1 Robustness checks for identity
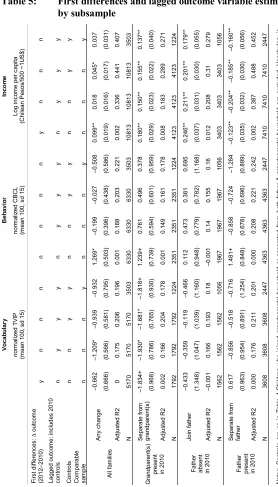
First, we pool all the transitions and test the associations for any transition. We find some evidence of transitions being associated with a small increase in income per capita, but less robust evidence of reductions in normalized vocabulary score and improvements in behavior (Table 5). These weaker results, due to not taking into account the family member’s identity, suggest that the transition itself is not the mechanism behind the main findings but the identity of the transitioner is important.
4.2 Does income explain the association between grandparent separation and reduced vocabulary scores?
Since income is also associated with grandparent separation, we test if income per capita explains the association between grandparent separation and child vocabulary; reduced income could be a reason why children’s normalized vocabulary scores are lower when grandparents exit the household. Because the association between household transitions and behavior is not statistically significant we do not explore income in this context. For the vocabulary outcome, we include change in log income per capita in the first-differences regression and include log income per capita in 2012 in the lagged-dependent-variable regressions; 2010 log income per capita is already included as a control variable. These analyses examine if the inclusion of these income variables weakens the original associations (Baron and Kenny 1986). We use the Stata commandmedeff (Hicks and Tingley 2011), which applies procedures developed by Imai, Keele, and Tingley (2010) to estimate the potential indirect effect of grandparent separation via income on child vocabulary, should the association indeed be causal. The bootstrapped estimates use 1,000 repetitions and range from 0‒0.19 standard deviations. Controlling for change in income, the coefficient estimate on grandparent separation changed by no more than 0.2 (15% of the main effect or 1.3% of a standard deviation) and the significance levels remained the same (full regression available upon request).
Though one might expect changes in income to be driven by changes in mothers’ employment, there is little change in female employment between rounds (Table A-4). The highest increase in the rate of mother employment, 14%, is found in families where the father separates. We also note that these families have the highest magnitude of change in grandparent caregiving, with 10% of families adding a grandparent as primary caregiver between rounds. By contrast, only 5% of families where the grandparent exits replace the grandparent as primary caregiver with someone else. Increases in preschool attendance are similar among all family types, whether experiencing a household transition or not, although families where the father exits had a notably higher level of preschool enrollment in 2010.
5. Discussion
grandparents and Chilean children frequently experience grandparent transitions. Grandparent separation is associated with lower child vocabulary development and greater household income per capita. By contrast, father transitions are not associated with child development outcomes, only with household income.
Though our literature review suggests that any type of household transition could be associated with changes in vocabulary and behavior, we find father transitions are not associated with vocabulary and behavioral child outcomes between ages 3 and 7 years. Grandparent presence, however, is positively associated with vocabulary: We find that child vocabulary scores are 10% higher in households where a grandparent remained living with their grandchildren rather than separated. We also find that changes in household income do not explain much of this association: Household income per capita increases upon grandparent separation, suggesting that grandparents’ average income per capita is lower than that of mothers and fathers. If income influences cognition we would expect vocabulary scores to increase when grandparents leave, but we find the opposite. Yet, though a potential financial liability, the contribution of grandparents to child development appears valuable in the vocabulary realm.
Per capita income may increase for a variety of reasons when the grandparents separate from the household. As mentioned above, they may not be earning income and therefore are a liability for their child to support. On the other hand, the increase may be purely functional: even if they provide income to the family, if two grandparents separate the remaining income is divided by even fewer people. Finally, the separation may be spearheaded by mothers’ employment, in which case income increases, but not due to the grandparents. However our descriptive statistics suggests mothers’ employment fluctuates relatively little in the face of household transitions (Table A-4). We refrain from drawing conclusions regarding whether the increase in income offsets the loss in vocabulary score because we did not assess the many other realms of child development and welfare. A tentative policy suggestion is for policymakers and educators interested in supporting children’s vocabulary to target families experiencing these transitions, although more data and analyses are needed to understand the mechanisms before designing interventions.
literature as we extend longitudinal analysis of grandparent influence beyond single mothers and include a sample of children in early childhood. Only the Dunifon and Kowaleski-Jones study includes some elementary-age school children; the other studies focus on adolescent or adult outcomes.
In comparison to non-US studies, our work complements the findings of Schmeer, who examines child anemia and family structure in Mexico in a context of family transitions arising from migration (2013). She finds father and grandparent transitions not to have significant association with child anemia, but the rates of transition for her sample were between 2% and 5% over a three-year period, lower than in our Chilean sample over a two-year period. She finds children with a stable maternal-grandparent presence have lower anemia, suggesting that grandparents can support child nutrition. In line with our general findings on grandparents, studies on pensions from Brazil (Ponczek 2011) and South Africa (Duflo 2003) have also found that grandparents can support early child development. We refrain from suggesting that our findings for grandparents are valid for other cultures, though other Latin American nations with high rates of teen and early pregnancy and where intergenerational coresidence is common would be most likely to yield similar results. Yet though Peru and Colombia have similar rates of adolescent pregnancy to Chile (United Nations, Department of Economic and Social Affairs, Population Division 2015), Chile is culturally more similar to the wealthier nations of Argentina and Uruguay. Thus it is possible that our Chilean findings on grandparents are unique to Chile; more research is needed to determine if these trends are consistent internationally.
focuses on differences between children rather than differences over time for the same children.
We do not find any longitudinal associations between household transitions and children’s behavior. This result is surprising because poor socio-emotional adjustment is one of the strongest findings in reviews of father absence, including lagged-dependent-variable studies, with effects potentially “more pronounced if father absence occurs during early childhood than during middle childhood” (McLanahan, Tach, and Schneider 2013). Many of the studies reviewed consider internal and externalizing behaviors, analogous to those measured by the CBCL in our study; however, none are from Latin America. On the other hand, a systematic review of literature on depressive symptoms (including internalizing behavior) and divorce finds little evidence of age at parents’ divorce being important, though the age of the children may matter: males aged 10 and females aged 15 are most at risk of depressive symptoms (Di Manno, Macdonald, and Knight 2015). Reduced engagement with the father may explain these results, with the sexes differing in sensitivity to father absence at different ages.
The lack of an association between father transitions and child vocabulary scores combined with the association between grandparent separation and child vocabulary scores suggests two possible explanations, which we are unable to test with this data. Although the understanding of fatherhood in Chile has evolved to include the ideals of confidant, friend, tutor, and nurturer in addition to protector and provider, Chilean fathers largely continue to be employed full-time and may be less available for children, even when living in the household (Rebolledo 2008; Valdés 2009). As such, fathers outside the household may maintain similar levels of interaction as fathers inside the household. Grandparents, on the other hand, may be unable to maintain the same levels of involvement when non-coresident. That involvement might include supporting the mother in household chores as well as caring for the children. Thus, if Chile has strongly delineated gender roles for household chores, father presence may not allow mothers to spend more time with their children to the same degree as grandparent presence. To understand which mechanisms are driving the results, more data is needed on interactions between non-nuclear family members, children, and mothers, and between non-coresident family members, children, and mothers. Information on the amount of time spent in different types of interaction can be helpful (educational, play, household, etc.), as well as the quality of the interaction (listening to children’s problems, providing emotional support, discipline).
and adolescents (Cabrera et al. 2007). With older children, fathers can participate in activities such as sports, video games, and camping, while interactions with younger children require more caretaking, which is often culturally considered ‘maternal.’ The age of the child may be more important than the age at which the transition took place, perhaps with father absence felt more acutely in later childhood and adolescence, the ages at which fathers are more involved with children. Follow-up research on these children will be important to determine if these mechanisms hold in the Chilean context.
Several study limitations should be noted. First, although the lagged-dependent-variable regression models included extensive controls and accounted for differences in baseline values of the outcome variables, we cannot fully account for all unobserved factors. The first-difference models do control for all fixed unobserved variables, but not for time-varying unobserved variables. Second, due to a lack of international or national standards for the PPVT and CBCL, the child development outcome variables are not normalized to an absolute scale but instead are relative to their peers in each survey year; thus results should be interpreted as relative changes rather than absolute changes. Third, while we adjusted for attrition using inverse probability weights, this method is not fully corrective if the attrition was related to unobserved variables. Finally, our transition variables are somewhat limited. We do not know how long the fathers and grandparents lived with the child prior to the survey, nor do we know when during the two-year window between survey rounds the transition occurred. We only examined grandparent separation; we do not examine grandparents joining households since this transition is not part of the pattern that emerges in our descriptive analysis. Even in the grandparent separation variable we do not distinguish grandmothers from grandfathers or maternal from paternal grandparents. We note that when grandparents are living in the home the most likely scenario is the presence of both maternal grandparents, followed by that of maternal grandmothers. We do not consider the case of one grandparent leaving the household but another remaining.
2014). However, the data limitations with respect to lower power for subgroup analyses imply that unless results are strikingly different the confidence intervals for the estimates will overlap, making conclusions in this regard tenuous. Our initial investigations suggested differences by gender, but they are not statistically significant so we do not report them.
In spite of these limitations and topics to be explored in future research, our study results contribute to the body of literature that suggests that non-nuclear family members influence child development, and that these influences do not work through income. Chilean policymakers and NGOs supporting children and families may wish to target mothers who move out of their parents’ household and provide them with additional support for their children’s cognitive development. In addition, there may be benefits to providing parental coaching for fathers who enter households, to help them better engage with their children. Programs that support children in families with separating parents can become even more effective by expanding to serve families experiencing different types of household transition, particularly since young Chilean children experience grandparent separation more frequently than father separation. More generally, directly involving grandparents may help family programs that support early childhood become more effective.
6. Acknowledgments
References
Achenbach, T.M. and Rescorla, L.A. (2000). Manual for the ASEBA preschool forms and profiles. Burlington: University of Vermont, Research Center for Children, Youth, and Families.
Amato, P.R. (2010). Research on divorce: Continuing trends and new developments.
Journal of Marriage and Family 72(3): 650–666. doi:10.1111/j.1741-3737. 2010.00723.x.
Amato, P.R. and Gilbreth, J.G. (1999). Nonresident fathers and children’s well-being: A meta-analysis.Journal of Marriage and Family 61(3): 557–573.doi:10.2307/ 353560.
Andersson, G. (2004). Children’s experience of family disruption and family formation: Evidence from 16 FFS countries. Vienna Yearbook of Population Research
2004: 313–332.
Angrist, J.D. and Pischke, J.-S. (2008).Mostly harmless econometrics: An empiricist’s companion. Princeton: Princeton University Press.
Anthony, C.J., DiPerna, J.C., and Amato, P.R. (2014). Divorce, approaches to learning, and children’s academic achievement: A longitudinal analysis of mediated and moderated effects. Journal of School Psychology 52(3): 249–261.doi:10.1016/ j.jsp.2014.03.003.
Aquilino, W.S. (1996). The life course of children born to unmarried mothers: Childhood living arrangements and young adult outcomes. Journal of Marriage and Family 58(2): 293–310.doi:10.2307/353496.
Astone, N.M., Nathanson, C.A., Schoen, R., and Kim, Y.J. (1999). Family demography, social theory, and investment in social capital. Population and Development Review 25(1): 1–31.doi:10.1111/j.1728-4457.1999.00001.x.
Augustine, J.M. and Raley, R.K. (2013). Multigenerational households and the school readiness of children born to unmarried mothers.Journal of Family Issues 34(4): 431–459.doi:10.1177/0192513X12439177.
Baron, R.M. and Kenny, D.A. (1986). The moderator–mediator variable distinction in social psychological research: Conceptual, strategic, and statistical considerations.Journal of Personality and Social Psychology 51(6): 1173–1182.
Bierman, K.L., Coie, J.D., Dodge, K.A., Greenberg, M.T., Lochman, J.E., McMahon, R.J., and Pinderhughes, E. (2010). The effects of a multiyear universal social– emotional learning program: The role of student and school characteristics.
Journal of Consulting and Clinical Psychology 78(2): 156–168. doi:10.1037/ a0018607.
Braver, S.L., Griffin, W.A., and Cookston, J.T. (2005). Prevention programs for divorced nonresident fathers. Family Court Review 43(1): 81–96. doi:10.1111/ j.1744-1617.2005.00009.x.
Britto, P.R., Lye, S.J., Proulx, K., Yousafzai, A.K., Matthews, S.G., Vaivada, T., Perez-Escamilla, R., Rao, N., Ip, P., Fernald, L.C.H., MacMillan, H., Hanson, M., Wachs, T.D., Yao, H., Yoshikawa, H., Cerezo, A., Leckman, J.F., Bhutta, Z.A., and the Early Childhood Development Interventions Review Group (2016). Nurturing care: Promoting early childhood development. The Lancet
389(10064): 91–102.doi:10.1016/S0140-6736(16)31390-3.
Cabrera, N., Fitzgerald, H.E., Bradley, R.H., and Roggman, L. (2007). Modeling the dynamics of paternal influences on children over the life course. Applied Development Science 11(4): 185–189.doi:10.1080/10888690701762027. Carlson, M., McLanahan, S., and England, P. (2004). Union formation in fragile
families.Demography 41(2): 237–261.doi:10.1353/dem.2004.0012.
Cavanagh, S.E. and Huston, A.C. (2006). Family instability and children’s early problem behavior.Social Forces 85(1): 551–581.doi:10.1353/sof.2006.0120. Centro Microdatos (2013). Presentacion: Segunda ronda encuesta longitudinal de la
primera infancia. Santiago: Departamento de Economia, Universidad de Chile. Chetty, R., Friedman, J.N., Hilger, N., Saez, E., Schanzenbach, D.W., and Yagan, D.
(2011). How does your kindergarten classroom affect your earnings? Evidence from Project Star. The Quarterly Journal of Economics 126(4): 1593–1660.
doi:10.1093/qje/qjr041.
Coleman, M., Ganong, L., and Fine, M.A. (2000). Reinvestigating remarriage: Another decade of progress. Journal of Marriage and Family 62(4): 1288–1307.
doi:10.1111/j.1741-3737.2000.01288.x.
Cooper, C.E., McLanahan, S.S., Meadows, S.O., and Brooks-Gunn, J. (2009). Family structure transitions and maternal parenting stress. Journal of Marriage and Family 71(3): 558–574.doi:10.1111/j.1741-3737.2009.00619.x.
Corina, S.V. (2008). El Child Behavior Checklist: Su estandarización en población urbana Argentina.Revista de Psicología 4(8): 113–130.
Crookston, B.T., Schott, W., Cueto, S., Dearden, K.A., Engle, P., Georgiadis, A., Lundeen, E.A., Penny, M.E., Stein, A.D., and Behrman, J.R. (2013). Postinfancy growth, schooling, and cognitive achievement: Young lives. The American Journal of Clinical Nutrition 98(6): 1555–1563.doi:10.3945/ajcn.113.067561. Curtin, S.C., Ventura, S.J., and Martinez, G.M. (2014). Recent declines in nonmarital
childbearing in the United States. Washington, D.C.: US Department of Health and Human Services, Centers for Disease Control and Prevention, National Center for Health Statistics (NCHS Data Brief No. 162).
http://s3.documentcloud.org/documents/1273985/births.pdf.
Deleire, T. and Kalil, A. (2002). Good things come in threes: Single-parent multigenerational family structure and adolescent adjustment. Demography
39(2): 393–413.doi:10.1353/dem.2002.0016.
Di Manno, L., Macdonald, J.A., and Knight, T. (2015). Family dissolution and offspring depression and depressive symptoms: A systematic review of moderation effects. Journal of Affective Disorders 188(Supplement C): 68–79.
doi:10.1016/j.jad.2015.08.017.
Duflo, E. (2003). Grandmothers and granddaughters: Old-age pensions and intrahousehold allocation in South Africa. The World Bank Economic Review
17(1): 1–25.doi:10.1093/wber/lhg013.
Dunifon, R.E., Ziol-Guest, K.M., and Kopko, K. (2014). Grandparent coresidence and family well-being implications for research and policy. The Annals of the American Academy of Political and Social Science 654(1): 110–126.
doi:10.1177/0002716214526530.
Dunifon, R. and Kowaleski-Jones, L. (2007). The influence of grandparents in single-mother families.Journal of Marriage and Family 69(2): 465–481.doi:10.1111/ j.1741-3737.2007.00377.x.
Engle, P.L., Black, M.M., Behrman, J.R., Cabral de Mello, M., Gertler, P.J., Kapiriri, L., Martorell, R., Young, M.E., and the International Child Development Steering Group (2007). Strategies to avoid the loss of developmental potential in more than 200 million children in the developing world. The Lancet 369(9557): 229–242.doi:10.1016/S0140-6736(07)60112-3.
Engle, P.L., Fernald, L.C.H., Alderman, H., Behrman, J., O’Gara, C., Yousafzai, A.K., Cabral de Mello, M., Hidrobo, M., Ulkuer, N., Ertem, I., Iltus, S., and the Global Child Development Steering Group (2011). Strategies for reducing inequalities and improving developmental outcomes for young children in low-income and middle-income countries. The Lancet 378(9799): 1339–1353. doi:10.1016/S0 140-6736(11)60889-1.
Fernald, L.C.H., Weber, A., Galasso, E., and Ratsifandrihamanana, L. (2011). Socioeconomic gradients and child development in a very low income population: Evidence from Madagascar.Developmental Science 14(4): 832–847.
doi:10.1111/j.1467-7687.2010.01032.x.
Foster, E.M. and Kalil, A. (2007). Living arrangements and children’s development in low-income white, black, and latino families. Child Development 78(6): 1657– 1674.doi:10.1111/j.1467-8624.2007.01091.x.
Gertler, P., Heckman, J., Pinto, R., Zanolini, A., Vermeersch, C., Walker, S., Chang, S.M., and Grantham-McGregor, S. (2014). Labor market returns to an early childhood stimulation intervention in Jamaica. Science 344(6187): 998–1001.
doi:10.1126/science.1251178.
Heckman, J.J., Stixrud, J., and Urzua, S. (2006). The effects of cognitive and noncognitive abilities on labor market outcomes and social behavior. Journal of Labor Economics 24(3): 411–482.doi:10.3386/w12006.
Hetherington, E.M., Bridges, M., and Insabella, G.M. (1998). What matters? What does not? Five perspectives on the association between marital transitions and children’s adjustment. Annual Progress in Child Psychiatry and Child Development 53(2): 167–184.doi:10.1037/0003-066X.53.2.167.
Hicks, R. and Tingley, D. (2011). Causal mediation analysis.Stata Journal 11(4): 605– 619.
Kurdek, L.A., Fine, M.A., and Sinclair, R.J. (1995). School adjustment in sixth graders: Parenting transitions, family climate, and peer norm effects. Child Development
66(2): 430–445.doi:10.1111/j.1467-8624.1995.tb00881.x.
McLanahan, S., Tach, L., and Schneider, D. (2013). The causal effects of father absence. Annual Review of Sociology 39: 399–427. doi:10.1146/annurev-soc-071312-145704.
Mikulincer, M., Shaver, P.R., and Pereg, D. (2003). Attachment theory and affect regulation: The dynamics, development, and cognitive consequences of attachment-related strategies. Motivation and Emotion 27(2): 77–102.
doi:10.1023/A:1024515519160.
Mollborn, S., Fomby, P., and Dennis, J.A. (2010). Who matters for children’s early development? Race/ethnicity and extended household structures in the United States.Child Indicators Research 4(3): 389–411. doi:10.1007/s12187-010-9090-2.
Monserud, M.A. and Elder, G.H. (2011). Household structure and children’s educational attainment: A perspective on coresidence with grandparents.Journal of Marriage and Family 73(5): 981–1000. doi:10.1111/j.1741-3737.2011. 00858.x.
Moreno, C.H.G. and Sandoval, A.A.M. (2015). Mujer, madre y abuela, la fusión de los roles.Rumbos TS 12: 48–68.
Mutchler, J.E. and Baker, L.A. (2009). The implications of grandparent coresidence for economic hardship among children in mother-only families. Journal of Family Issues 30(11): 1576–1597.doi:10.1177/0192513X09340527.
Osborne, C. and McLanahan, S. (2007). Partnership instability and child well-being.
Journal of Marriage and Family 69(4): 1065–1083. doi:10.1111/j.1741-3737. 2007.00431.x.
Page, M.E. and Stevens, A.H. (2004). The economic consequences of absent parents.
The Journal of Human Resources 39(1): 80–107.doi:10.2307/3559006.
Pleck, J.H. (2007). Why could father involvement benefit children? Theoretical perspectives. Applied Development Science 11(4): 196–202. doi:10.1080/1088 8690701762068.
Ponczek, V. (2011). Income and bargaining effects on education and health in Brazil.
Journal of Development Economics 94(2): 242–253. doi:10.1016/j.jdeveco. 2010.01.011.
Pong, S.-L. and Chen, V.W. (2010). Co-resident grandparents and grandchildren’s academic performance in Taiwan.Journal of Comparative Family Studies 41(1): 111–129.
Rebolledo, L. (2008). Del padre ausente al padre próximo: Emergencia de nuevas formas de paternidad en el Chile actual. In: Araujo, K. and Prieto, M. (eds.).
Estudios sobre sexualidades en América Latina. Quito: FLACSO: 123–140. Ruggles, S. and Heggeness, M. (2008). Intergenerational coresidence in developing
countries. Population and Development Review 34(2): 253–281. doi:10.1111/j. 1728-4457.2008.00219.x.
Ryan, R.M. and Claessens, A. (2013). Associations between family structure changes and children’s behavior problems: The moderating effects of timing and marital birth.Developmental Psychology 49(7): 1219–1231.doi:10.1037/a0029397. Salinas, V. (2011). Socioeconomic differences according to family arrangements in
Chile.Population Research and Policy Review 30(5): 677–699.
Schady, N., Behrman, J.R., Araujo, M.C., Azuero, R., Bernal, R., Bravo, D., López Bóo, F., Macours, K., Mashall, D., Paxson, C., and Vakis, R. (2015). Wealth gradients in early childhood cognitive development in five Latin American countries. Journal of Human Resources 50(2): 446–463. doi:10.3368/jhr.50. 2.446.
Schmeer, K.K. (2013). Family structure and child anemia in Mexico. Social Science and Medicine 95: 16–23.doi:10.1016/j.socscimed.2012.10.028.
Schott, W., Aurino, E., Penny, M.E., and Behrman, J.R. (2017). Adolescent mothers’ anthropometrics and grandmothers’ schooling predict infant anthropometrics in Ethiopia, India, Peru, and Vietnam. Annals of the New York Academy of Sciences.doi:10.1111/nyas.13455.
The World Bank (2014). Labor force participation rate, female (% of female population ages 15+) [electronic resource]. Washington, D.C.: The World Bank.
Thomson, E., Hanson, T.L., and McLanahan, S.S. (1994). Family structure and child well-being: Economic resources vs. parental behaviors. Social Forces 73(1): 221–242.doi:10.1093/sf/73.1.221.
UNdata (2015). Life expectancy at birth, females [electronic resource]. New York: United Nations Statistics Division. http://data.un.org/Data.aspx?d=PopDiv&f =variableID%3A67.
United Nations, Department of Economic and Social Affairs, Population Division (2015). World fertility data 2015 [electronic resource]. New York: United Nations. http://www.un.org/en/development/desa/population/publications/data set/fertility/wfd2015.shtml.
Valdés, X. (2009). El lugar que habita el padre en Chile contemporáneo: Estudio de las representaciones sobre la paternidad en distintos grupos sociales. Polis, Revista de La Universidad Bolivariana 8(23): 385–410. doi:10.4067/S0718-65682009 000200017.
Viola, L., Garrido, G., and Rescorla, L. (2011). Testing multicultural robustness of the Child Behavior Checklist in a national epidemiological sample in Uruguay.
Journal of Abnormal Child Psychology 39(6): 897–908. doi:10.1007/s10802-011-9500-z.
Walker, S.P., Chang, S.M., Vera-Hernández, M., and Grantham-McGregor, S. (2011). Early childhood stimulation benefits adult competence and reduces violent behavior.Pediatrics 127(5): 849–857.doi:10.1542/peds.2010-2231.
Appendix: Supplemental data on trends in household structure
Using Chile’s nationally representative cross-sectional household survey CASEN from 2003, 2006, and 2011 (Ministerio de Desarrollo Social), we examined trends in household structure for mothers of young children over a longer time period than allowed for with the ELPI (Figure A-1). The 2003 CASEN survey had slightly less detail about relationships in the household, only indicating if an individual was child of the head, but the 2006 and 2011 surveys indicate if the individual was child of head and spouse, child of head only, or child of spouse only. Comparing the fractions in the 2011 portion of the graph in Figure A1 to those fractions reflected by the 2010 families in the column “Total” from Table 1, there were more single mothers and fewer three-generational households than in the 2010 ELPI survey. This, in part, may be because we did not include paternal grandparents in the CASEN tally because these were more difficult to identify using the household roster. Trends indicated the incidence of single motherhood rose between 2003 and 2011. The legalization of divorce in 2004 could have been a contributing factor. We note that this trend suggests that in the future more children will be living without fathers and grandparents. We also note that the fraction of mothers living with their own parents has stayed relatively constant over time, revealing the permanence of the three-generational household structure in Chile.
Figure A-1: Percentage of mothers in different household arrangements
Source: CASEN.
Note: Mothers with at least one child aged 6 years or younger.
0
2
0
4
0
6
0
80
10
0
2003 2006 2011
year
Living with neither partner nor parent Living with parent
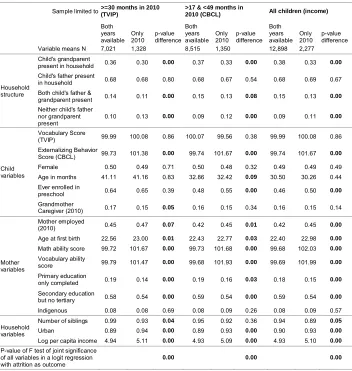
Table A-1: Attrition analysis
Sample limited to>=30 months in 2010(TVIP) >17 & <49 months in2010 (CBCL) All children (income)
Both years available
Only 2010
p-value difference
Both years available
Only 2010
p-value difference
Both years available
Only 2010
p-value difference Variable means N 7,021 1,328 8,515 1,350 12,898 2,277
Household structure
Child's grandparent
present in household 0.36 0.30 0.00 0.37 0.33 0.00 0.38 0.33 0.00 Child's father present
in household 0.68 0.68 0.80 0.68 0.67 0.54 0.68 0.69 0.67 Both child's father &
grandparent present 0.14 0.11 0.00 0.15 0.13 0.08 0.15 0.13 0.00 Neither child's father
nor grandparent
present 0.10 0.13
0.00 0.09 0.12 0.00 0.09 0.11 0.00
Child variables
Vocabulary Score
(TVIP) 99.99 100.08 0.86 100.07 99.56 0.38 99.99 100.08 0.86 Externalizing Behavior
Score (CBCL) 99.73 101.38 0.00 99.74 101.67 0.00 99.74 101.67 0.00 Female 0.50 0.49 0.71 0.50 0.48 0.32 0.49 0.49 0.49 Age in months 41.11 41.16 0.83 32.86 32.42 0.09 30.50 30.26 0.44 Ever enrolled in
preschool 0.64 0.65 0.39 0.48 0.55 0.00 0.46 0.50 0.00 Grandmother
Caregiver (2010) 0.17 0.15 0.05 0.16 0.15 0.34 0.16 0.15 0.14
Mother variables
Mother employed
(2010) 0.45 0.47 0.07 0.42 0.45 0.01 0.42 0.45 0.00 Age at first birth 22.56 23.00 0.01 22.43 22.77 0.03 22.40 22.98 0.00
Math ability score 99.72 101.67 0.00 99.73 101.68 0.00 99.68 102.03 0.00
Vocabulary ability
score 99.79 101.47 0.00 99.68 101.93 0.00 99.69 101.99 0.00 Primary education
only completed 0.19 0.14 0.00 0.19 0.16 0.03 0.18 0.15 0.00 Secondary education
but no tertiary 0.58 0.54 0.00 0.59 0.54 0.00 0.59 0.54 0.00 Indigenous 0.08 0.08 0.69 0.08 0.09 0.26 0.08 0.09 0.57
Household variables
Number of siblings 0.99 0.93 0.04 0.95 0.92 0.36 0.94 0.89 0.05
Urban 0.89 0.94 0.00 0.89 0.93 0.00 0.90 0.93 0.00
Log per capita income 4.94 5.11 0.00 4.93 5.09 0.00 4.93 5.10 0.00
P-value of F test of joint significance of all variables in a logit regression with attrition as outcome
0.00 0.00 0.00
Notes: ‘Both years available’ means child has survey responses in both rounds; outcomes & covariates could be missing. The age window for administering the Peabody Picture Test is 30 months or more.
The age window of the CBCL is 18–72 months. All children are under 72 months in round 1.
Round 2 occurred ~2 years after round 1. To not have aged out of the CBCL window in round 2, children had to be less than 48 months in round 1.
Table A-2: Logistic regression to generate inverse probability weights
Non-attriter
Household structure
Child's grandparent present in household 0.445 ** (0.106)
Child's father present in household 0.207 * (0.093)
Interaction: Child's father x grandparent present ‒0.241 + (0.130)
Child variables
Female 0.027
(0.049)
Age in months 0.006 **
(0.002)
Ever enrolled in preschool (2010) ‒0.231 ** (0.055)
Grandmother caregiver (2010) 0.148 + (0.081)
Mother variables
Mother's age at first birth ‒0.001 (0.006)
Mother employed (2010) ‒0.009 (0.057)
Primary education only completed 0.437 ** (0.090)
Secondary education but no tertiary 0.379 ** (0.072)
Indigenous ‒0.155
(0.099)
Household variables
Number of siblings 0.049 + (0.029)
Urban ‒0.349 *
(0.160)
constant 1.516 **
(0.254)
N 13,793
pseudo-R2 0.012
Table A-3: Summary statistics by household transition status between 2010 and 2012
Stable Transitioned
Variable mean mean p-value*
Child variables
Vocabulary score (TVIP 2010) 100.07 99.60 0.38 Vocabulary score (TVIP 2012) 100.27 99.30 0.02 Behavior score (CBCL 2010) 100.14 97.73 0.00 Behavior score (CBCL 2012) 100.26 98.87 0.00
Female 0.50 0.48 0.27
Age in months (2010) 30.63 29.52 0.00 Grandmother caregiver (2010) 0.45 0.47 0.15 Ever attended preschool (2010) 0.15 0.20 0.00
Mother variables
Mother's age at first birth 22.63 21.34 0.00 Mother employed (2010) 0.42 0.42 0.87 Mother's math ability score (WAIS) 99.74 99.68 0.87 Mother's vocabulary ability score (WAIS) 99.83 98.85 0.01 Primary education only completed 0.18 0.17 0.06 Secondary education but no tertiary 0.59 0.64 0.00
Indigenous 0.08 0.09 0.40
Household variables
Number of siblings 0.97 0.78 0.00
Urban 0.89 0.91 0.00
Log per capita income (2010) 4.96 4.82 0.00 Log per capita income (2012) 5.18 5.13 0.02 N (Total N = 10,813) 1,893 8,920
Notes: *from t-test of difference in means
Vocabulary is standardized (mean 0; sd 15) score on the Spanish version of the Peabody Picture Vocabulary Test Behavior is standardized (mean 0; sd 15) score on the Child Behavior Checklist
Income is log per capita income in Chilean pesos/500 ~1US$2010–2012 ELPI - sample defined by children with complete controls & test score/income data.
Table A-4: Rates of select variables at baseline and changes between 2010 and 2012 by transition type
Grandparents separate
Father joins
Father exits
No transition (Extended)
No transition (Nuclear)
Variable (percent) 2010 2012-10 2010 2012-10 2010 2012-10 2010 2012-10 2010 2012-10
Mother employed 40% 8% 43% 3% 43% 14% 41% 9% 39% 5% Grandparent primary
caregiver 24% –5% 25% –4% 14% 10% 28% 5% 11% 1%
Child attends preschool 42% 45% 42% 43% 48% 41% 41% 43% 40% 45% N = 853 N = 499 N = 588 N = 2,573 N = 5,854
Source: ELPI 2010 & 2012.