Research note
Modeling of Vibration of a Fluidized Bed Cylindrical Shell
H. Ghorbani, R. Sotudeh-Gharebagh∗, M. Abbasi, R. Zarghami, N. Mostoufi
Process Design and Simulation Research Center, Oil and Gas Processing Centre of Excellence, School of Chemical Engineering, College of Engineering, University of Tehran, Tehran, Iran
Abstract
The aim of this work is to model the vibration of the shell of a cylindrical fluidized bed under internal pressure fluctuations in order to predict its hydrodynamic behavior. Pressure fluctuations of gas-solid were calculated by a CFD-DEM model. The governing vibration equations of the shell were derived from Donnell’s nonlinear shallow-shell theory. The discretized equations were obtained by Galerkin’s method and solved with the finite element analysis. Results of the model were compared with the experimental data in both time and frequency domains.It was shown that the model is able to follow the trends of standard deviation, skewness and kurtosis of the vibration signals obtained from experiments. Minimum fluidization velocity was calculated from standard deviation, skewness and kurtosis of vibration signals. It was shown that the dominant frequency of vibration signals is around 1500-2000 Hz in bubbling fluidized bed and there is a good agreement between the power spectrum density of the simulated and experimental vibration signals. The results showed that the vibration model developed in this work can simulate the real dynamic conditions of the bubbling fluidized bed and is a reliable method to predict the hydrodynamic behavior of the bed.
Keywords: Fluidized Beds, Vibration Modeling, CFD-DEM, Circular Cylindrical Shell
∗ Corresponding author: [email protected]
1. Introduction
Fluidized beds are used extensively in different industrial processes. There are many advantages in fluidization, such as high contact surface, good mixing between phases and higher heat and mass transfer than other similar units like fixed bed. In recent years, investigation of the bed wall vibration was used to determine the hydrodynamic status of fluidized beds [1-3]. Vibrations of a fluidized bed are caused by and respond to hydrodynamic changes such as movement and interaction of bubbles, particles
interaction, agglomeration and cluster formation. Therefore, monitoring of vibration signals of a fluidized bed, as a non-intrusive technique, directly reflects the hydrodynamics of the bed [4].
fluidized bed can be related to bubble fluid mechanics, such as formation, coalescence, eruption of bubbles, particle interaction and cluster formation. [5-7]. Vibration of the bed wall can be modeled as vibration of a circular cylindrical shell which is affected by internal pressure forces. Several researches have dealt with the vibration of cylindrical shells. Karagiozisetet al. [8] investigated vibrations of circular cylindrical shells, empty and filled by fluid, under a radial force excitation with the standard form of Donnell’s nonlinear shallow-shell equations. Chiba [9] experimentally studied large-amplitude vibrations of two vertical clamped circular cylindrical shells, partially filled with water to different levels with larger nonlinearity. Fu and Chia [10] applied the Donnell’s nonlinear shallow-shell theory for the free vibration of circular cylindrical panels with imperfections and different boundary conditions. Khalili et al. [11] investigated free and forced vibration of multilayer composite circular cylindrical shells under transverse impulse load as well as combined static axial loads and internal pressure based on first order shear deformation theory. In spite of many research works conducted on vibration modeling of different structures, the vibration modeling of fluidized bed has not yet been reported in the literature.
In this work, the vibration of a fluidized bed wall was modeled by circular cylindrical shell theory and the internal pressures and impulse collision forces are inserted to the model as stated by Khalili et al. [11]. Statistical methods as well as frequency domain analysis were applied for evaluating the data. Short-time Fourier transform (STFT) was used to analyze the transient
vibration data of modeling taken in the dense bed of the fluidized bed in the bubbling regime.
2. Modeling
For modeling of vibration of the bed shell, it is necessary to determine the origins of the bed wall vibration based on the forces exerted on the bed shell. The functional forces partially exerted on the bed shell include the pressure fluctuation in the fluidized bed. Therefore, the internal particles-gas fluid was modeled through CFD-DEM and then the calculated pressure forces were exerted as inputs to the vibration model of the bed walls.
2-1. Assumptions
The following assumptions were applied in modeling:
• The fluid-wall boundary was assumed to be fixed in the present study. This assumption is reasonable since the displacement of the shell is negligible against the distance between the nodes in the CFD-DEM code and the deformations were assumed to be small.
• Radial displacements and deformation were considered while axial and tangential displacements were neglected
.
Moreover,
axial and tangential vibrations were ignored in order to measure the vibration along the radial direction only.• Momentums resulting from the impact of particles and clusters on the wall were ignored when compared to the forces from pressure fluctuations.
was considered as a mass point. To apply the momentums of these mass points, locations of the centers of mass of the connected accessories were determined.
• Effects of the acoustic waves on the vibration of the bed were ignored.
• Pressure force fluctuations were assumed to be exerted on the internal surface of the shell in the radial direction prior to assumption 2.
2-2. Particles-gas fluid model
The CFD-DEM approach, developed by Norouzi et al. [12], was used to obtain pressure fluctuations in the fluidized bed. In this approach, the gas phase was treated as a continuous phase and its motion was defined by equations of continuity and momentum balance based on the local mean variables on the fluid cell [13]. These equations are: Equation of continuity:
.( U) 0 t
ε ε
∂
+ ∇ =
∂ (1)
Equation of momentum balance:
f
f fp
f
( U )
.( UU ) P F
t
.( ) g
ρ ε ρ ε
ετ ρ ε
∂
+ ∇ = −∇ −
∂
+ ∇ +
(2)
Particles were assumed to be individual elements and Newton's second law of motion was applied to describe the movement of
each particle. The translational and the rotational motions of the particles at any time, t, can be described by [14]:
1
i
k i
i f ,i c ,ij d ,ij g ,i
j dv
m f ( f f ) f
dt =
= +
∑
+ + (3)and
1
i
k i
i i , j
j d
I T
dt
ω =
=
∑
(4)The contact forces between the particles and between the particle and the wall were calculated according to the soft sphere method [15]. This model can give the pressure fluctuations and provides a good input for the vibration model utilized in the present study. More details about the model and its parameters can be found in [12].
2-3. Vibration model
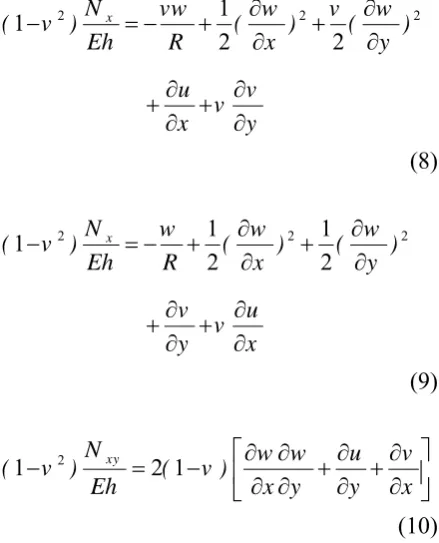
Fig. 1 is the schematic of the fluidized bed which has a shallow circular cylindrical shape. Both of the ends of the shell can be considered clamped. As shown in Fig. 2, the bed can be illustrated as a vertical shallow cylindrical shell of length l, radius R and thickness h. In this figure, x, y and z are longitudinal, circumferential and radial coordinates, respectively, and w direction is a positive radial deformation. The standard form of Donnell’s nonlinear shallow-shell theory was used for this case as [8]:
2 2 2 2 2 2 2
4
2 2 2 2 2
1
2 s
F F w F w F w
D w chw hw f p
R R x y x xdy x y x y
ρ ∂ ⎛∂ ∂ ∂ ∂ ∂ ∂ ⎞
∇ + + = − + +⎜ − + ⎟
∂ ⎝∂ ∂ ∂ ∂ ∂ ∂ ∂ ⎠
Figure 1. Schematic of the fluidized bed.
Figure 2. Shell geometry and origin of coordinate
system.
where D is the flexural stiffness of the shell, obtained by:
3 2 12 1
Eh D
[ ( v )]
=
− (6)
The biharmonic operator is defined by:
4 4
4
4 4
x y
∂ ∂
∇ = +
∂ ∂ (7)
Strain and displacement of the bed shell relat to each other by the following equations:
2 1 2 2
1
2 2
x
N vw w v w
( v ) ( ) ( )
Eh R x y
u v
v
x y
∂ ∂
− = − + +
∂ ∂
∂ ∂
+ +
∂ ∂
(8)
2 1 2 1 2
1
2 2
x
N w w w
( v ) ( ) ( )
Eh R x y
v u
v
y x
∂ ∂
− = − + +
∂ ∂
∂ ∂
+ +
∂ ∂
(9)
2
1 Nxy 2 1 w w u v
( v ) ( v )
Eh x y y x
⎡∂ ∂ ∂ ∂ ⎤
− = − ⎢ + + ⎥
∂ ∂ ∂ ∂
⎣ ⎦
(10)
2-4. Boundary conditions
Vibration modeling was carried out with two boundary conditions which made the displacement of zero, so they were assumed to be fixed supports. One of the supports is the bottom sectional area of the bed shell and the other is the tangential area at the top of the bed shell where the cyclone is connected to the upper level of the bed shell (see Fig. 1). Since the axial and tangential vibration of the bed was ignored, the fixed supports are spotted and have the following boundary conditions at any time:
w=0 at x=0 and x=l. (11)
0
w / x
∂ ∂ = at x=0 and x=l (12)
2-5. Internal loads
Pressure fluctuations at any location of the fluidized bed wall and corresponding inserted forces were extracted from CFD-DEM modeling of the fluidized bed hydrodynamics [12] and acceleration of the bed shell caused by internal transient forces was calculated at any time. The pressure forces exerted on the inner surface of the shell was given to the vibration model as a function of time and height in the radial direction. In other words, there is a cylindrical shell under radial pressure forces variable with time and height of the bed. These pressure forces established the boundary conditions for the border nodes on the solid shell.
3. Experiments
Fig. 1 shows the schematic of fluidized column and its accessory facilities used for experiments in this work. The thickness,
length and inner diameter of the bed shell were 0.01 m, 2 m and 0.15 m, respectively. The bed was made of Plexiglas (Poly Methyl Methacrylate, PMMA) with nonlinear dynamic properties (i.e., its stress varies nonlinearly vs. strain). The density, Poison ratio and Yang’s elasticity modulus of the bed material were 1683 kg/m3, 0.36 and 2.8-3.1 GPa, respectively. Sixty brace alloy screws were connected to the shell in two equal rows, 0.024 kg each. The cyclone was made of stainless steel and its weight was 5.6 kg. There was a valve for returning the entrained particles back to the bed, made of brace alloy, 0.85 kg. The polyethylene pipe connecting the valve and the upper section of the cyclone weighed 0.885 kg.
All experiments were carried out with sand particles of 700 μm average diameter and with aspect ratio of L/D= 0.5 at various superficial gas velocities. Air at room temperature and atmospheric pressure was blown into the column through a perforated plate distributor with 435 holes of 7 mm triangle pitch. Air flow rate was measured by a rotameter. There was a cyclone connected to the top of the column to return the entrained solids back to the bed.
4. Time and frequency domain analysis
There are various methods for analyzing and processing the time series of vibration signals, including time and frequency domain. Time domain approaches typically include standard deviation analysis and the analysis of other statistical moments like skewness and kurtosis. The standard deviation defines the deviation of the distribution from a normal distribution, whereas the higher order moments give information about intermittency in the time series. Standard deviation is defined as:
2 1 1 1 n i i
( j j )
n σ
=
= −
−
∑
(13)where j is the amplitude of the vibration signal and 1 1 n i i J j n =
=
∑
(14)Puncochar et al. [17] and Felipe and Rocha [18] determined minimum fluidization velocity by the standard deviation of pressure fluctuations. Abbasi et al. [1] and Azizpour et al. [19] applied standard deviation of vibration signals for calculation of minimum fluidization and transition to turbulent velocities, respectively.
The higher order statistical moments are expressed as the skewness (normalized third-order statistical moment):
3 3
1 n
i i( j j ) S
( n )σ
− =
−
∑
(15)and the kurtosis (normalized fourth-order statistical moment): 4 1 4 1 n i i ( j j ) K
( n )σ
= −
=
−
∑
(16)The skewness, the lack of symmetry in the probability distribution, is zero for a normal distribution. The kurtosis is a measure of the sharpness of the distribution. It is 3 for a normal, Gaussian distribution.
For the analysis of the signal in frequency domain, the power spectral density function (PSDF) was calculated using fast Fourier transform (FFT). The PSDF analysis was applied to analyze and characterize the hydrodynamics of fluidized beds. In order to decrease the variance, the power spectrum was estimated as an average of a number of sub-spectra. Hence, the vibration signal was divided into L segments of individual length N and the power spectrum estimate of each segment is: 2 2 2 1 1 1 N
i j nf
jj N i
n n
P ( f ) j ( n )w ( n )e
w ( n )
π − = = ⎡ ⎤ = ⎢ ⎥ ⎣
∑
⎦∑
(17)Using the Hanning window (w) and without any overlap between the windows, the averaged power spectrum becomes:
1
1 L i
jj jj
i
P ( f ) P ( f ) L =
=
∑
(18)Abbasi et al. [4] showed that for vibration signals, an expanded band spectrum indicates increase of number of rising bubbles, while a narrow band with sharp peaks either signifies a single bubble or slugging bed behavior.
5. Results and discussion
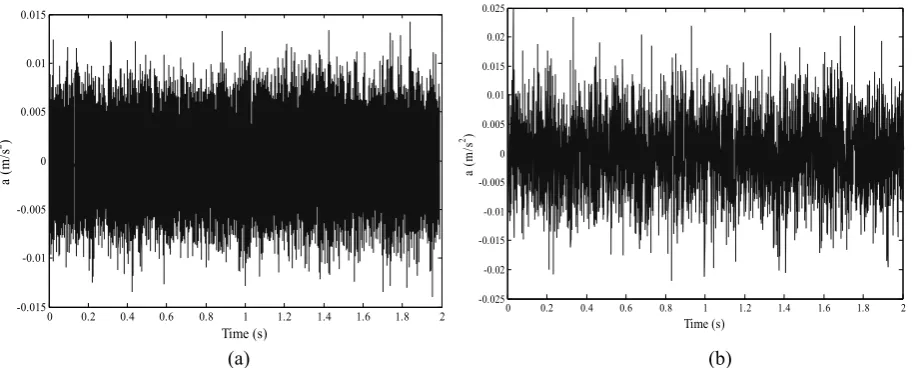
0.8 m/s superficial gas velocity are shown for experiment and model in Fig.3a and Fig. 3b, respectively. As can be seen in these figures, both model and experiment show the same order of magnitudes of the amplitude of vibrations. However, there is a difference between the vibration signals recorded by accelerometer and those calculated through simulation. This difference can be attributed to the simplifying assumptions of the model and the existence of noise in the experiments. Nevertheless, the trend of data series in both figures seems to be similar for which the data were more thoroughly analyzed as described below.
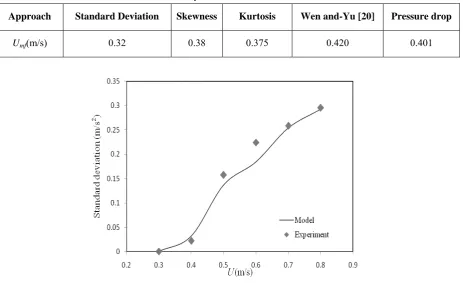
Fig. 4 indicates the variation of standard deviation of vibration signals versus superficial gas velocity in the bubbling fluidized bed in which acceleration of the bed was measured in time-domain. As can be seen in this figure, there is an ascending
trend of standard deviation against the gas velocity in both experimental and modeling results and the correlation coefficient between experimental data and modeling results was 0.98, which shows a good agreement between experiment values and the model. The increase in standard deviation of vibration signals can be explained by the formation of larger bubbles when gas velocity is increased in the bubbling regime. Abbasi et al. [1] showed that the standard deviation of vibration signals increases linearly with the superficial gas velocity and calculated the minimum fluidization velocity for different sand particles by linear regression. Table 1 shows the value of minimum fluidization velocity which was obtained by this method and is compared with those obtained by pressure drop method and correlation of Wen and Yu [20].
0 0.2 0.4 0.6 0.8 1 1.2 1.4 1.6 1.8 2
-0.015 -0.01 -0.005 0 0.005 0.01 0.015
Time (s)
a (
m
/s
2)
0 0.2 0.4 0.6 0.8 1 1.2 1.4 1.6 1.8 2
-0.025 -0.02 -0.015 -0.01 -0.005 0 0.005 0.01 0.015 0.02 0.025
Time (s)
a (
m
/s
2)
(a) (b)
Table 1. Calculated minimum fluidization velocity from different methods.
Approach Standard Deviation Skewness Kurtosis Wen and-Yu [20] Pressure drop
Umf(m/s) 0.32 0.38 0.375 0.420 0.401
Figure 4. Variation of standard deviation of vibration modeling signals versus superficial gas velocity.
Fig. 5 shows the variation of skewness of the vibration signals for both experimental and modeling results as a function of gas velocity. As is shown in this figure, there is a significant difference between the skewnesses calculated based on the vibration model and the experiment at gas velocities close to minimum fluidization (0.3-0.4 m/s). However, these values are in good agreement when the bed is completely fluidized. There is a sharp increase of skewness between 0.4 and 0.5 m/s. The skewness then decreases slowly by increasing the gas velocity. The skewness of vibration signals is almost constant before the minimum fluidization velocity. Distribution of the vibration signals changes as soon as the bubbles are formed in the bed. As the gas velocity increase above the minimum fluidization velocity, bubble formation rate increases and so does the
important at a high gas velocity. Therefore, there is a better agreement between modeling results and experimental data at higher gas velocities.
Figure 5. Skewness of vibration modeling signal at
different gas velocity.
Kurtosis of the vibration signals calculated based on experimental data and modeling results at various superficial gas velocities is shown in Fig. 6. As is seen in this figure, both profiles have the same trend and the correlation coefficient is 0.984 which shows a good agreement between kurtosis of the experimental data and the simulated signals. As can be seen in this figure, the difference between simulation and experiments becomes less as the gas velocity increases, because at higher gas velocities, pressure fluctuation becomes the dominant origin of the bed vibration. Considering the assumptions, better results can be obtained from the simulation at such a condition. However, at low velocities, the trend is similar to skewness which was described before. Abbasi et al. [1] and Azizpour et al. [19] reported that kurtosis for the vibration signals has a maximum value at minimum
fluidization velocity, then descends and becomes constant. Based on this approach, the minimum fluidization velocity was calculated at 0.375 m/s. According to Table 1, skewness and kurtosis methods can predict the minimum fluidization velocity better than the standard deviation which confirms the results obtained by Abbasi et al. [1] who found that kurtosis and skewness methods are more sensitive to the vibration of bubble formation.
Figure 6. Calculated kurtosis versus superficial
velocity.
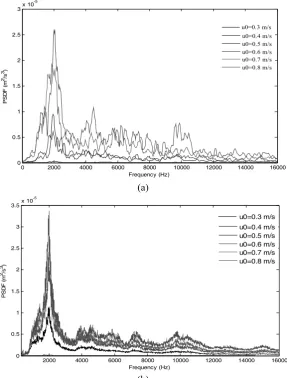
Figs. 7a and b show the power spectrum of the vibration signals at various gas velocities estimated based on the simulation results and experimental data, respectively. This figure shows that the peak of the dominant frequency of the vibration signals is about 2 kHz, in both cases. This dominant frequency can be considered as the frequency of passage of bubbles [1]. As shown in Figs. 7a and b, both distributions have the same trend at different gas velocities and the modeling of vibration of fluidized bed could predict the dominant frequency of the bed and bubble behavior as well.
0 2000 4000 6000 8000 10000 12000 14000 16000 0
0.5 1 1.5 2 2.5
3x 10
-5
Frequency (Hz)
PSD
F
(
m
2/s 3)
u0=0.4 m/s u0=0.5 m/s u0=0.6 m/s u0=0.7 m/s u0=0.8 m/s u0=0.3 m/s
(a)
2000 4000 6000 8000 10000 12000 14000 16000
0 0.5 1 1.5 2 2.5 3 3.5x 10
-5
Frequency (Hz)
PSD
F
(
m
2/s 3)
u0=0.4 m/s u0=0.5 m/s u0=0.6 m/s u0=0.7 m/s u0=0.8 m/s u0=0.3 m/s
(b)
Figure 7. PSDF of vibration signals at different velocities for (a) modeling (b) experimental data.
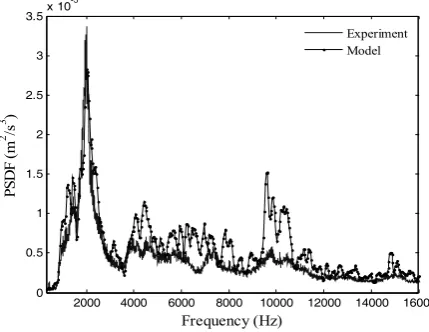
modeling vibration signals at 0.8 m/s are shown in Fig. 8. It can be seen in this figure, that the two distributions have a good agreement with each other at the frequency related to bubbles, about 2 kHz, which indicates that the model developed in this work can properly predict the behavior of the bubble. The difference between the two distributions at higher frequencies can be attributed to assumptions 3 to 6. High frequencies are related to particle collisions and other micro phenomena while low frequencies are related to macro phenomena [4, 21]. It can be seen in this figure that the vibration frequency of the bubbles in
Martin et al. [3]. Moreover, Martin et al. [3] pointed out that this low frequency envelope cannot be used for soft and small particles. However, if the vibration frequency of the bubbles were in the low frequency range, it should have been generalized to all types of the particles.
2000 4000 6000 8000 10000 12000 14000 16000 0
0.5 1 1.5 2 2.5 3 3.5x 10
-5
Frequency (Hz)
PS
D
F (
m
2 /s 3 )
Experiment Model
Figure 8. PSDF of experimental and modeling
vibration signals at gas velocity of 0.8 m/s.
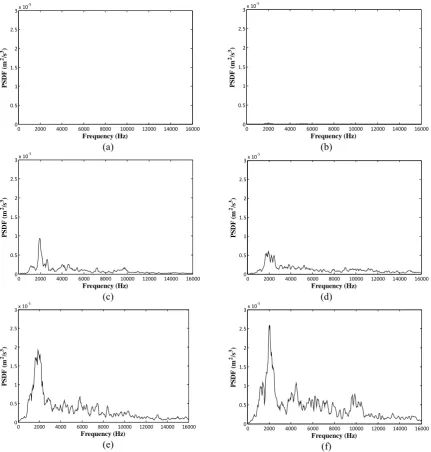
Simulated power spectrum of the vibration signals at various gas velocities are shown in Figs. 9 a-e. According to these figures, by increasing the superficial gas velocity, the peak of the dominant frequency becomes smaller which means that the growth of the bubble size and formation frequency of the bubbles increases by increasing the gas velocity. Moreover, Fig. 9 demonstrates that the amplitude of these frequencies increases with increasing the superficial gas velocity. This can be related to an increase in the bubble size due to increasing air velocity [1].
6. Conclusions
A model was developed for estimation of the vibration of the circular cylindrical walls of a
fluidized bed under internal pressure forces which were obtained from CFD-DEM model.This model was applied to investigate the dynamic response of the bed in order to determine the hydrodynamic behavior of the bubbling fluidized bed. Results of the vibration model were compared with experimental data in both time and frequency domains. The trends of the experimental and simulated standard deviation, skewness and kurtosis of the vibration signals were shown to be similar. The related diagrams indicated that the model of vibrations of the bubbling fluidized bed is closer to the experimental data at higher gas velocities than when closer to the minimum fluidization velocity. Minimum fluidization velocity was evaluated by all of the statistical parameters of the vibration signals and it was shown that the estimated velocities are close to the minimum fluidization velocity measured by the bed pressure drop method. The dominant frequency of vibration of the shell of the fluidized bed was found to be about 2 kHz, based on both modeling and experiments. The peak of the dominant frequency increases with increasing gas velocity. The results showed that the vibration model developed in this work can simulate the real dynamic conditions of the bubbling fluidized bed and is a reliable method to predict the hydrodynamic behavior of the bed.
Acknowledgement
0 2000 4000 6000 8000 10000 12000 14000 16000 0 0.5 1 1.5 2 2.5
3x 10
‐5 Frequency (Hz) PS D F ( m 2/s 3) (a)
0 2000 4000 6000 8000 10000 12000 14000 16000
0 0.5 1 1.5 2 2.5
3x 10
‐5 Frequency (Hz) PSD F (m 2/s 3) (b)
0 2000 4000 6000 8000 10000 12000 14000 16000
0 0.5 1 1.5 2 2.5
3x 10
‐5 Frequency (Hz) PS D F ( m 2/s 3) (c)
0 2000 4000 6000 8000 10000 12000 14000 16000
0 0.5 1 1.5 2 2.5
3x 10
‐5 Frequency (Hz) PS D F ( m 2/s 3) (d)
0 2000 4000 6000 8000 10000 12000 14000 16000
0 0.5 1 1.5 2 2.5
3x 10
‐5 Frequency (Hz) PS D F (m 2/s 3) (e)
0 2000 4000 6000 8000 10000 12000 14000 16000
0 0.5 1 1.5 2 2.5
3x 10
‐5 Frequency (Hz) PS D F (m 2/s 3) (f)
Figure 9. The separated power spectrum estimation of vibration modeling data at various gas velocities
(a) 0.3, (b) 0.4, (c) 0.5, (d) 0.6, (e) 0.7 and (f) 0.8 m/s.
Nomenclature
C structural damping factor D bed diameter (m)
D flexural stiffness
E elasticity modulus of Young (Pa) f the net of all the external radial
forces in a shell of Donnell’s theory (N)
f ,i
f fluid drag forces (N)
c ,ij
f contact force (N)
d ,ij
f damping force (N)
g ,i
f Gravity force (N)
F stress of the shell (Pa)
fp
F volumetric fluid-particle interaction force (N)
H thickness of the shell (m) Ii moment of inertia (kg m2)
ji amplitude of the time-series signal
j mean value
K kurtosis
L length of the shell (m)
L initial height of the shell containing sand particles (m)
mi mass of particle (kg)
N length of the time-series signal
Nx shear stress resultant at x direction
(Pa)
Ny shear stress resultant at y direction
(Pa)
Nxy shear stress resultant at xy plate (Pa)
P internal surface pressure in the bed (Pa)
P fluid pressure (Pa) i
jj
P PSDF (m2/s3)
jj
P averaged power spectrum (m2/s3) R radius of the shell (m)
S skewness
i , j
T interparticle torque (N.m)
u axial shell displacements (m) U fluid velocity (m/s)
c
U transition velocity to turbulent
regime (m/s)
mf
U minimum fluidization velocity (m/s)
v circumferential shell displacements (m)
vi velocity of particle (m/s)
w radial shell displacements (m)
x longitudinal coordinates
y circumferential coordinates
z radial coordinates
w Hanning window
Greek symbols
ε porosity
ρf fluid density (kg/m3)
σ standard deviation of signals (m/s2)
Τ fluid viscose stress tensor (Pa)
υ Poisson’s ratio
ω angular velocity of particle (s-1)
References
[1] Abbasi, M., Sotudeh-Gharebagh, R., Mostoufi, N. and Mahjoob, M. J., "Non-intrusive monitoring of bubbles in a gas–solid fluidized bed using vibration signature analysis", Powder Technology, 196, 278, (2009).
[2] Vervloet, D., Nijenhuis, J. and Van Ommen, J. R., "Monitoring a lab-scale fluidized bed dryer: A comparison between pressure transducers, passive acoustic emissions and vibration measurements", Powder Technology, 197, 36, (2009).
[3] De Martín, L., Briongos, J. V., Aragón, J.M. and Palancar, M. C., "Can low frequency accelerometry replace pressure measurements for monitoring gas-solid fluidized beds? ", Chemical Engineering Science, 65, 4055, (2010). [4] Abbasi, M., Sotudeh-Gharebagh, R.,
Mostoufi, N., Zarghami, R. and Mahjoob, M. J., "Non-intrusive characterization of fluidized bed hydrodynamics using vibration signature analysis", AIChE J., 196, 278, (2010).
[5] Van der Schaaf, J., Schouten, J. C., Johnsson, F. and Van den Bleek, C. M., "Non-intrusive determination of bubble and slug length scales in fluidized beds by decomposition of the power spectral density of pressure time series", International Journal of Multiphase Flow, 28, 865, (2002).
beds", J. Chemical Engineering Science, 60, 1193, (2005).
[7] Sasic, S., Leckner, B. and Johnsson, F., "Time-frequency investigation of different modes of bubble flow in a gas-solid fluidized bed", Chemical Engineering Journal, 121, 27, (2006). [8] Karagiozis, K. N., Amabili, M.,
Paıdoussis, M. P. and Misra, A. K., "Nonlinear vibrations of fluid-filled clamped circular cylindrical shells", Journal of Fluids and Structures, 21, 579, (2005).
[9] Chiba, M., "Experimental studies on a nonlinear hydroelastic vibration of a clamped cylindrical tank partially filled with liquid", ASME Journal of Pressure Vessel Technology, 115, 381, (1993). [10] Fu, Y. M. and Chia, C. Y., "Non-linear
vibration and postbuckling of generally laminated circular cylindrical thick shells with nonuniform boundary conditions", International Journal of Non-Linear Mechanics, 28, 313, (1993).
[11] Khalili, S. M. R., Azarafza, R. and Davar, A., "Transient dynamic response of initially stressed composite circular cylindrical shells under radial impulse load", Composite Structures, 89, 275, (2009).
[12] Norouzi, H. R., Mostoufi, N., Mansourpour, Z., Sotudeh-Gharebagh, R. and Chaouki, J., "Characterization of solids mixing patterns in bubbling fluidized beds", Chemical Engineering Research and Design, 50, 4245, (2011). [13] Anderson, T. B. and Jackson, R., "A
fluid mechanical description of fluidized beds: Equations of motion", Industrial and Engineering Chemistry Fundamentals, 6, 527, (1967).
[14] Xu, B. H. and Yu, A. B., "Numerical simulation of the gas-solid flow in a
fluidized bed by combining discrete particle method with computational fluid dynamics", Chemical Engineering Science, 52, 2785, (1997).
[15] Cundall, P. A. and Strack, O. D. L., "A Discrete numerical model for granular assemblies", Geotechnique, 29, 47, (1979).
[16] Oppenheim, A. V. and Willsky, A. S., Signal and Systems, 2nd ed. Upper Saddle River, NJ, Prentice-Hall, (1997). [17] Puncochar, M., Cermak, J. and Selucky, K., "Evaluation of minimum fluidizing velocity in gas fluidized bed from pressure fluctuations", Chemical Engineering Communications, 35, 81, (1985).
[18] Felipe, C. A. S. and Rocha, S. C. S., "Prediction of minimum fluidization velocity of gas-solid fluidized beds by pressure fluctuation measurements– Analysis of the standard deviation", Powder Technology, 174, 104, (2007). [19] Azizpour, H., Sotudeh-Gharebagh, R.,
Zarghami, R., Abbasi, M., Mostoufi, N. and Mahjoob, M. J., "Hydrodynamic characterization of fluidized bed at high velocity by vibration signature analysis", International Journal of Multiphase Flow, 73, 395, (2011).
[20] Wenand, C. Y. and Yu, Y. H., "A generalized method for predicting the minimum fluidization velocity", AIChE Journal, 12, 610, (1966).
[21] Zarghami, R., Conditional monitoring of fluidization quality in fluidized bed, PhD dissertation,University of Tehran, (2009).