S
Spprriinngg22001166,,VVooll55,,NNoo22
A Bioinformatics Approach to Prioritize Single Nucleotide
Polymorphisms in TLRs Signaling Pathway Genes
Behnam Alipoor1, Hamid Ghaedi2, Mir Davood Omrani2,Milad Bastami3, Reza Meshkani1∗ Taghi Golmohammadi1
1. Department of Biochemistry, Faculty of Medicine, Tehran University of Medical Sciences, Tehran, Iran.
2. Department of Medical Genetics, Faculty of Medicine, Shahid Beheshti University of Medical Sciences,
Tehran, Iran.
3. Department of Medical Genetics, Faculty of Medicine, Tabriz University of Medical Sciences, Tabriz, Iran.
It has been suggested that single nucleotide polymorphisms (SNPs) in genes involved in Toll-like receptors (TLRs) pathway may exhibit broad effects on function of this network and might contribute to a range of human diseases. However, the extent to which these variations affect TLR signaling is not well understood. In this study, we adopted a bioinformatics approach to predict the consequences of SNPs in TLRs network. The consequences of non-synonymous coding SNPs (nsSNPs) were predicted by SIFT, PolyPhen, PANTHER, SNPs&GO, I-Mutant, ConSurf and NetSurf tools. Structural visualization of wild type and mutant protein was performed using the project HOPE and Swiss PDB viewer. The influence of 5′-UTR and 3′- UTR SNPs were analyzed by appropriate computational approaches. Nineteen nsSNPs in TLRs pathway genes were found to have deleterious consequences as predicted by the combination of different algorithms. Moreover, our results suggested that SNPs located at UTRs of TLRs pathway genes may potentially influence binding of transcription factors or microRNAs. By applying a pathway-based bioinformatics analysis of genetic variations, we provided a prioritized list of potentially deleterious variants. These findings may facilitate the selection of proper variants for future functional and/or association studies.
Key words: Bioinformatics; in-silico analysis; single nucleotide polymorphisms; toll- like receptors
∗
Corresponding author: Department of Biochemistry, School of Medicine, Tehran University of Medical Sciences, Tehran, Iran.
E-mail: rmeshkani@tums.ac.ir
oll-like receptors (TLRs) are a major class of the pattern- recognition receptors of the innate immune system involved in the identification of pathogen-associated molecular patterns (PAMPs) from infectious pathogens (1-2). These trans-membrane proteins engage with PAMPs and trigger activation of intracellular signaling cascades,
leading to the induction of genes that regulate the expression of pro- inflammatory cytokines and chemokines (3-4). Due to the critical roles of TLRs signaling network in the initiation of innate immune responses, malfunction of genes involved in this pathway may predispose individuals to numerous human diseases ranging from infectious and chronic
T
Submmited 11 January 2016; Accepted 31 March 2016; Published 1 May 2016
interest, as they can either modulate gene expression or influence protein structure and function (9-10). Although the contribution of SNPs in TLR signaling to human pathological states was addressed by several studies, a comprehensive and prioritized list of SNPs potentially affecting the function and regulation of this pathway is still lacking. Therefore, this study aimed to systematically identify the UTR-SNPs and nsSNPs in genes involved in TLRs signaling network by employing a bioinformatics approach and predicting their deleterious functional and structural consequences.
Materials and methods
Retrieving SNPs in TLRs pathway genes
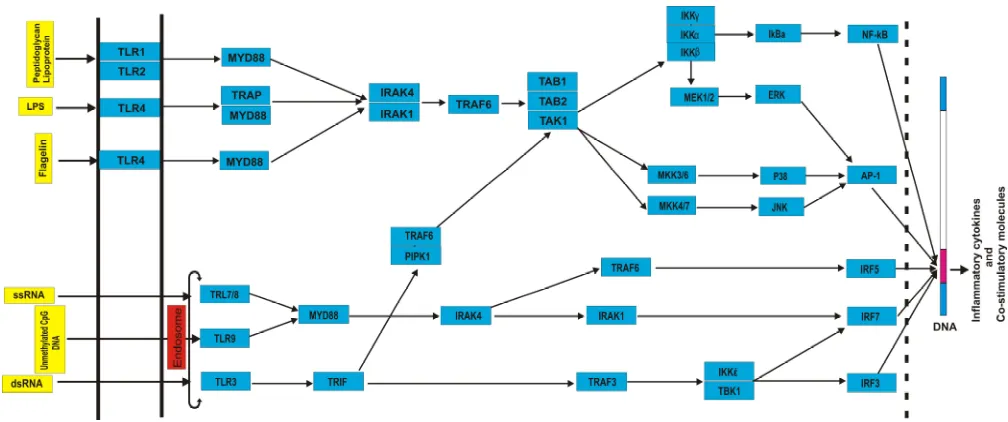
Data on the human TLRs pathway genes were collected from national center for biological information (http://www.ncbi.nlm.nih.gov/) (acce-ssed May 2015) (Table 1). Genes implicated in TLRs pathway and their functional connections were retrieved by querying Kyoto encyclopedia of genes and genomes (KEGG) (http:// www. genome.jp/ kegg/) (accessed May 2015) (Figure 1). SNPs located in TLRs network genes were retrieved from dbSNP (http:// www. ncbi. nlm. nih. gov/SNP/) (accessed June 2015). For each SNP, the following information was recorded: SNP ID, genomic coordinate, and variation type. Protein information of TLR network genes was retrieved from UniProt (http: // www. uniprot.org/) (accessed
position is quantified in terms of a "rejected substitutions" (RS) score, defined as the number of substitutions expected under neutrality minus the number of substitutions "observed" at the position. Positive scores represent a substitution deficit (i.e., fewer substitutions than the average neutral site) and thus indicate that a site may be under the evolutionary constraint. Negative scores indicate that a site is probably evolving neutrally; negative scores should not be interpreted as evidence of accelerated rates of evolution because of too many strong confounders, such as alignment uncertainty or rate variance.
The effects of UTR-SNPs on local RNA secondary structure were predicted using mode 1 of RNAsnp program (v 1.1). The software requires RNA sequence and SNP as inputs and uses a window of 400 nucleotides, ±200 nucleotide on either side of the SNP position to obtain subsequences and generate the base-pairing probability matrix for the corresponding wild type and mutant alleles. Then, RNAsnp computes the Euclidian distance (d) and Pearson correlation coefficient (r) for all sequence intervals with a minimum length of 50 that have self-contained base pairs to assess structural difference between the wild type and mutant alleles and reports the interval with the maximum base pairing distance (dmax) or minimum correlation coefficient (rmin) along with the corresponding empirical p-value (11). Here, we used both measures independently and defined
structure disruptive UTR-SNPs as those with significant dmax or rmin (significance threshold is p< 0.2 as defined by RNAsnp).
RegulomeDB Version 1.1 (12) was used to annotate UTR-SNPs with known and predicted regulatory elements of the genome including the regions of DNase hypersensitivity, binding sites and motifs of transcription factors, chromatin state and the expression of quantitative trait loci.
To have further annotations, we identified 3'-UTR SNPs residing in microRNAs target sites. A comprehensive dataset of experimentally supported miRNAs target sites, including CLIP-Seq supported interactions from starBase version 2 (http:// starbase.sysu.edu.cn/) (13) and CLASH verified interactions extracted from PolymiRTS database, were compiled (http://compbio.uthsc.edu/miRSNP/) (14).
Table 1. TLR signaling pathway genes list.
Name Gene ID Location MIM Number of SNPs
1 TLR1 7096 Chr 4 601194 321
2 TLR2 7097 Chr 4 603028 537
3 TLR3 7098 Chr 4 603029 400
4 TLR4 21898 Chr 9 603030 606
5 TLR5 7100 Chr 1 603031 790
6 TLR6 10333 Chr 4 605403 854
7 TLR7 51284 Chr X 300365 544
8 TLR8 51311 Chr X 300366 270
9 TLR9 54106 Chr 3 605474 509
10 MYD88 4615 Chr 3 602170 123
11 TIRAP 114609 Chr 11 606252 267
12 IRAK1 3654 Chr X 300283 235
13 IRAK4 51135 Chr 12 606883 601
14 TRAF6 7189 Chr 11 602355 579
15 TRAF3 7187 Chr 14 601896 2570
16 TAB1 10454 Chr 22 602615 1989
17 TAB2 23118 Chr 6 605101 3967
18 MAP3K7 6885 Chr 6 602614 1267
19 IKBKG 8517 Chr X 300248 222
20 IKBKB 3551 Chr 8 603258 1376
21 CHUK 1147 Chr 10 600664 750
22 NFKBIA 4792 Chr 14 164008 143
23 NFKB1 4790 Chr 4 164011 2060
24 MAP2K1 5604 Chr 15 176872 2124
25 MAPK1 5594 Chr 22 176948 2335
26 MAP2K3 5606 Chr 17 602315 1329
27 MAP2K7 5609 Chr 19 603014 317
28 MAPK14 1432 Chr 6 600289 1778
29 MAPK8 5599 Chr 10 601158 2450
30 FOS 2353 Chr 14 164810 101
31 TICAM1 148022 Chr 19 607601 438
32 RIPK1 8737 Chr 6 603453 1322
33 IKBKE 9641 Chr 1 605048 696
34 TBK1 29110 Chr 12 604834 895
35 IRF3 3661 Chr 19 603734 199
36 IRF5 3663 Chr 7 607218 284
37 IRF7 3665 Chr 11 605047 173
Fig. 1. Schematic presentation of gene network implicated in TLR signaling pathway. Direction of signal transduction is exhibited by arrows.
Analyzing the functional and structural
conse-quences of non- synonymous SNPs
Phenotypic effects of amino acid substitution on protein function were predicted by Sorting intolerant from tolerant (SIFT) (http://sift.jcvi.org/). In this study, a list of nsSNPs (rsIDs) from NCBI's dbSNP database was submitted as a query sequence to SIFT to predict tolerated and deleterious substitutions for every position of sequence. nsSNPs with SIFT score 0.05 were classified as deleterious and those>0.05 were classified as tolerated (15).
Polymorphism Phenotyping-2 (PolyPhen-2) (http://genetics.bwh.harvard.edu/ pph2/) predicts possible impact of an amino acid substitution on the structure and function of a human protein using straightforward physical and comparative conside-rations. Input options for this tool are comprised of protein sequence, database ID/ accession number and details of amino acids substitution. For a given substitution, prediction outcome can be one of possibly damaging, probably damaging, and benign (16).
Protein analysis through evolutionary relati-onships (PANTHER) (http:// www.pantherdb. org/) estimates the likelihood of a particular nsSNPs to cause a functional impact on the protein. This tool
calculates the substitution position-specific evolutionary conservation (subPSEC) score based on an alignment of evolutionarily related proteins. The subPSEC scores are continuous values from 0 (neutral) to about -10 (most likely to be deleterious). A cutoff of -3 corresponds to a 50% probability that a score is deleterious. From this, the probability that a given variant will cause a deleterious effect on protein function is estimated by Pdeleterious, such that a subPSEC score of -3 corresponds to a Pdeleterious of 0.5 (17).
SNPs database and gene ontology (GO) (http://snps.biofold.org/snps-and-go/snps-and-go.html) have been optimized to predict if a given single point protein variation can be classified as disease associated or neutral. A probability > 0.5 indicates that the mutation at the protein is disease-related (18).
ConSurf web-server (http://consurf.tau.ac.il/) is a bioinformatics tool for estimating the evolutionary conservation of amino acid positions in a protein molecule based on the phylogenetic relations between homologous sequences. The continuous conservation scores are divided into a discrete scale of nine grades for visualization, from the most variable positions (grade 1) colored turqu-oise, through intermediately conserved positions
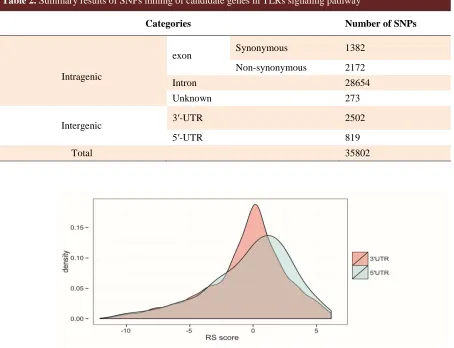
Fig. 2. Density plot of GERP++ conservation score (RS score). The figure shows that 5'UTR SNPs have higher (more positive) score than 3'UTR SNPs.
(grade 5) colored white, to the most conserved positions (grade 9) colored maroon.
I-Mutant (http:// folding. uib.es/ mutant/ i-mutant 2.0.html) is a neural network based web server for the automatic prediction of protein stability changes upon amino acid substitution. This tool provides the scores for free energy alterations, DDG<0 and DDG> 0 indicate reduction and elevation of the stability, respectively (19).
NetSurfp (http: //www. cbs.dtu. dk/services /NetSurfP/) predicts the relative and absolute surface accessibility and secondary structure of residues in amino acid sequences. The reliability of the surface accessibility prediction is stated in the form of a Z-score, which cannot predict secondary structures of proteins (20).
Project Have your Protein Explained (Project
HOPE) (http://www.cmbi.ru.nl/hope/home) has been used to study the insight structural features of native protein and the variant models (21). This web server provides three dimensional structural visualization of mutated proteins, and gives the results by using UniProt and DAS prediction servers.
Results SNP analysis
Mining the dbSNP-NCBI and UniProt databases revealed a total of 35802 SNPs in thirty-seven candidate genes in TLRs pathway (Table 2). Among these, 819 and 2502 were located in 5′-UTR and 3′-UTR respectively, and 2172 were identified as nsSNPs.
Table 2. Summary results of SNPs mining of candidate genes in TLRs signaling pathway
Categories Number of SNPs
Intragenic
exon
Synonymous 1382
Non-synonymous 2172
Intron 28654
Unknown
273
Intergenic 3′-UTR 2502
5′-UTR 819
Total 35802
Fig. 3. Structure disruptive UTR SNPs in TLR genes. SNPs positioned above dashed line are those with dmax p-value< 0.2, and hence,
designated to be structure disruptive.
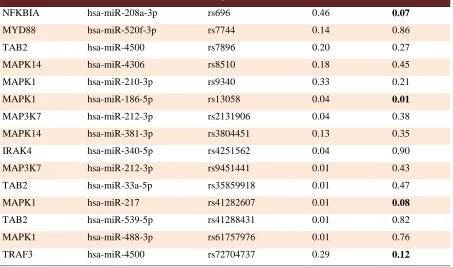
Table 3. Common 3’UTR SNPs resided in miRNA target sites
NFKBIA hsa-miR-208a-3p rs696 0.46 0.07
MYD88 hsa-miR-520f-3p rs7744 0.14 0.86
TAB2 hsa-miR-4500 rs7896 0.20 0.27
MAPK14 hsa-miR-4306 rs8510 0.18 0.45
MAPK1 hsa-miR-210-3p rs9340 0.33 0.21
MAPK1 hsa-miR-186-5p rs13058 0.04 0.01
MAP3K7 hsa-miR-212-3p rs2131906 0.04 0.38
MAPK14 hsa-miR-381-3p rs3804451 0.13 0.35
IRAK4 hsa-miR-340-5p rs4251562 0.04 0.90
MAP3K7 hsa-miR-212-3p rs9451441 0.01 0.43
TAB2 hsa-miR-33a-5p rs35859918 0.01 0.47
MAPK1 hsa-miR-217 rs41282607 0.01 0.08
TAB2 hsa-miR-539-5p rs41288431 0.01 0.82
MAPK1 hsa-miR-488-3p rs61757976 0.01 0.76
TRAF3 hsa-miR-4500 rs72704737 0.29 0.12
Target miRNA SNP MAF dmax p-value
Conservation score of UTR SNPs
We computed GERP++scores for SNPs in UTRs, which represent an evolutionary conservation extent based on alignment of 35 mammals to hg19. Generally, 5′-UTR SNPs were found to be more conserved than 3′-UTR SNPs (Figure 2). With a cut off RS score of ≥ 2, a total of 480 constrained SNPs (including 85 5′-UTR-SNPs and 395 3′-UTR-SNPs) were identified. Moreover,
1200 SNPs (including 141 5′-UTR-SNPs and 1059 3′-UTR-SNPs) were classified as neutrally evolving, which represents a RS score of ≤0. The most conserved SNPs were found in 3′-UTR of TAB2 (rs138687718, RS score= 6.17), MAPK14
(rs377447706, RS score= 6.17) and FOS (rs45480193, RS score= 6.16).
Influence of UTR-SNPs on RNA secondary
structures
Our analysis showed that 313 UTR-SNPs were structure disruptive as defined by dmax p- value P<0.2 (Figure 3). Considering both dmax and rmin, there were 232 unique structure disruptive UTR-SNPs. The top five genes enriched for structure disruptive SNPs were MAPK14 (n= 23), TLR7 (n= 12), TLR4 (n= 10), MAPK1 (n= 10), and
TRAF3 (n= 8).
Annotation of SNPs with regulatory elements
Disease associated variants are enriched in regulatory elements of the genome. Using RegulomeDB, we annotated UTR-SNPs within regulatory elements. 11 UTR-SNPs were associated with transcription factor binding sites (i.e eQTL).
These SNPs were found within 3’UTR of TAB1 (rs1010169, rs1010170, rs5757650, rs5750822), RIPK1 (rs9503383, rs9405606), IRF5 (rs752637,
rs3807306), IRAK4 (rs4251425) and TLR9 (rs187084) genes.
Identification of SNPs residing in miRNA target
sites
Intersecting 3′-UTR-SNPs with the experimentally validated miRNAs target site datasets, we found 314 SNPs resided in microRNAs target sites. Since miRNA target sites are under selective pressure, we refined SNPs in miRNA target sites by minor allele frequency (MAF) threshold of 0.01 (Table 3).
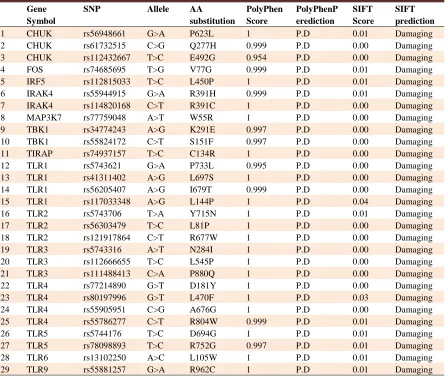
Table 4. List of nsSNPs that predicted to be deleterious by both PolyPhen-2 and SIFT tools
Gene Symbol
SNP Allele AA
substitution
PolyPhen Score
PolyPhenP erediction
SIFT Score
SIFT prediction
1 CHUK rs56948661 G>A P623L 1 P.D 0.01 Damaging
2 CHUK rs61732515 C>G Q277H 0.999 P.D 0.00 Damaging
3 CHUK rs112432667 T>C E492G 0.954 P.D 0.00 Damaging
4 FOS rs74685695 T>G V77G 0.999 P.D 0.01 Damaging
5 IRF5 rs112815033 T>C L450P 1 P.D 0.01 Damaging
6 IRAK4 rs55944915 G>A R391H 0.999 P.D 0.01 Damaging
7 IRAK4 rs114820168 C>T R391C 1 P.D 0.00 Damaging
8 MAP3K7 rs77759048 A>T W55R 1 P.D 0.00 Damaging
9 TBK1 rs34774243 A>G K291E 0.997 P.D 0.00 Damaging
10 TBK1 rs55824172 C>T S151F 0.997 P.D 0.00 Damaging
11 TIRAP rs74937157 T>C C134R 1 P.D 0.00 Damaging
12 TLR1 rs5743621 G>A P733L 0.995 P.D 0.00 Damaging
13 TLR1 rs41311402 A>G L697S 1 P.D 0.00 Damaging
14 TLR1 rs56205407 A>G I679T 0.999 P.D 0.00 Damaging
15 TLR1 rs117033348 A>G L144P 1 P.D 0.04 Damaging
16 TLR2 rs5743706 T>A Y715N 1 P.D 0.01 Damaging
17 TLR2 rs56303479 T>C L81P 1 P.D 0.00 Damaging
18 TLR2 rs121917864 C>T R677W 1 P.D 0.00 Damaging
19 TLR3 rs5743316 A>T N284I 1 P.D 0.00 Damaging
20 TLR3 rs112666655 T>C L545P 1 P.D 0.00 Damaging
21 TLR3 rs111488413 C>A P880Q 1 P.D 0.00 Damaging
22 TLR4 rs77214890 G>T D181Y 1 P.D 0.00 Damaging
23 TLR4 rs80197996 G>T L470F 1 P.D 0.03 Damaging
24 TLR4 rs55905951 C>G A676G 1 P.D 0.00 Damaging
25 TLR4 rs55786277 C>T R804W 0.999 P.D 0.01 Damaging
26 TLR5 rs5744176 T>C D694G 1 P.D 0.01 Damaging
27 TLR5 rs78098893 T>C R752G 0.997 P.D 0.01 Damaging
28 TLR6 rs13102250 A>C L105W 1 P.D 0.01 Damaging
29 TLR9 rs55881257 G>A R962C 1 P.D 0.01 Damaging
Abbreviations: P.D; probablydamaging
Fig. 4. Distribution of SIFT and PolyPhen score of SNPs in coding region. Horizontal and vertical dashed red line correspond to the
thresholds for predicting deleterious variants by PolyPhen and SIFT, respectively.
Prediction of tolerated and deleterious
non-synonymous SNPs by SIFT
SIFT analysis predicted that a total of 785 nsSNPs were damaging (score 0.05) and 1322 nsSNPs had tolerated effects on the candidate genes involved in TLR pathway network (score> 0.05) (Figure 4).
Prediction of damaging non-synonymous SNPs
by PolyPhen-2
According to our Polyphen-2 results, 610 nsSNPs were predicted “probably damaging”, 353 nsSNPs were predicted “possibly damaging” and 1068 were classified as benign (Figure 4). To increase the accuracy of predictions, results of SIFT and PolyPhen-2 were joined and SNPs with PolyPhen score> 0.95 and SIFT< 0.05 were selected. Accordingly, 29 nsSNPs passed both criteria and were classified as deleterious/damaging (Table 4).
Prediction of functional impact of
non-synonymous SNPs on protein by PANTHER and
SNPs & GO.
According to the PANTHER results, all 29 SNPs possessed the subPSEC score more than −3 and were therefore classified as deleterious (Table 5). As shown in table 5, these SNPs were found to
be as disease-associated with the probability >0.5 after analyzing by SNPs & GO.
Prediction of protein stability analysis by
I-Mutant
According to I- Mutant results, all mutations expect N284I (rs5743316 in TLR3), S151F (rs55824172 in TBK1) and L105W (rs13102250 in TLR6) were predicted to decrease protein stability,
with a free energy change value <0.0 (Table 6). Prediction of evolutionary conservation of amino
acid position by ConSurf
Our ConSurf analysis revealed that all 29 expected SNPs including the Q277H (CHUK), E492G (CHUK), L450P (IRF5), W55R (MAP3K7), K291E (TBK1), C134R (TIRAP), I679T (TLR1), L545P (TLR3), R804W (TLR4) and R752G (TLR5) were located in highly conserved regions and predicted to have functional and structural impacts on TLRs pathway proteins (Table 6).
In silico solvent accessibility and
three-dimensional analyzes of native and mutant
protein structures
By combining the results of SIFT, Poly-phen-2, PANTHER, SNPs & GO, I-Mutant 2.0, and ConSurf servers, 19 mutations were found to be more deleterious in candidate genes. Subsequently,
these mutations were analyzed for solvent accessibility and stability, and the results were represented in the following paragraphs (see also Table 7). Visualization of structural features of wild
type and mutant protein containing the mentioned deleterious variants was performed using the project HOPE and Swiss PDB viewer.
Table 5. PANTHER and SNPs&GO results for prediction of SNPs as disease associated.
PANTHER SNPs&GO
SNPs Substituti
on
subPSEC Pdeleterious Prediction RI Probability
1 rs56948661 P623L -4.92855 0.87309 Disease 5 0.742
2 rs61732515 Q277H -4.61589 0.83423 Disease 3 0.527
3 rs112432667 E492G -3.99182 0.72945 Disease 4 0.711
4 rs74685695 V77G -4.06862 0.74433 Disease 1 0.545
5 rs112815033 L450P -4.36601 0.79674 Disease 0 0.523
6 rs55944915 R391H -3.64924 0.65684 Disease 0 0.525
7 rs114820168 R391C -4.67097 0.84171 Disease 3 0.643
8 rs77759048 W55R -3.3007 0.57461 Disease 4 0.717
9 rs34774243 K291E -3.56533 0.63768 Disease 5 0.772
10 rs55824172 S151F -4.7119 0.84708 Disease 6 0.804
11 rs74937157 C134R -3.47178 0.6158 Disease 2 0.619
12 rs5743621 P733L -4.51666 0.82005 Disease 2 0.623
13 rs41311402 L697S -4.23845 0.77529 Disease 4 0.712
14 rs56205407 I679T -5.35855 0.91361 Disease 7 0.870
15 rs117033348 L144P -8.17834 0.99439 Disease 5 0.750
16 rs5743706 Y715N -4.34331 0.79303 Disease 4 0.707
17 rs56303479 L81P -6.4936 0.97051 Disease 7 0.855
18 rs121917864 R677W -6.4688 0.96979 Disease 6 0.819
19 rs5743316 N284I -3.91448 0.71392 Disease 5 0.748
20 rs112666655 L545P -4.25641 0.77841 Disease 6 0.823
21 rs111488413 P880Q -8.50881 0.99597 Disease 6 0.811
22 rs77214890 D181Y -4.48068 0.81467 Disease 0 0.511
23 rs80197996 L470F -3.94106 0.71931 Disease 4 0.639
24 rs55905951 A676G -3.16208 0.54043 Disease 0 0.503
25 rs55786277 R804W -5.10263 0.89116 Disease 5 0.748
26 rs5744176 D694G -3.42967 0.6058 Disease 4 0.716
27 rs78098893 R752G -3.16919 0.5422 Disease 2 0.614
28 rs13102250 L105W -5.09383 0.8903 Disease 2 0.583
29 rs55881257 R962C -4.48094 0.81471 Disease 1 0.547
The rs56948661 in CHUK gene leads to P623L. The residue is located on the surface of the protein and mutation of this residue can disturb the interactions with other molecules or other parts of the protein. Moreover, the mutation can disturb the special backbone conformation induced by proline. Conversion of V77G (rs74685695 in FOS) causes
some structural changes in protein. Glycine residue is smaller than valine and this may lead to loss of the interactions. Furthermore, the mutant residue is more hydrophobic and flexible and can disturb the required rigidity of the protein on this position. For rs114820168 in IRAK4, the wild-type (arginine) and mutant (cysteine) amino acids differ in size,
7 IRAK4 rs114820168 R391C -0.86 Decrease 8 F
8 MAP3K7 rs77759048 W55R -1.71 Decrease 8 -
9 TBK1 rs34774243 K291E -0.82 Decrease 6 -
10 TBK1 rs55824172 S151F 0.01 Increase 9 F
11 TIRAP rs74937157 C134R -1.55 Decrease 8 -
12 TLR1 rs5743621 P733L -1.33 Decrease 8 F
13 TLR1 rs41311402 L697S -1.51 Decrease 9 S
14 TLR1 rs56205407 I679T -1.91 Decrease 8 -
15 TLR1 rs117033348 L144P -0.79 Decrease 9 S
16 TLR2 rs5743706 Y715N -1.65 Decrease 9 S
17 TLR2 rs56303479 L81P -1.24 Decrease 9 S
18 TLR2 rs121917864 R677W -0.83 Decrease 9 F
19 TLR3 rs5743316 N284I 1.23 Increase 9 F
20 TLR3 rs112666655 L545P -1.10 Decrease 7 -
21 TLR3 rs111488413 P880Q -1.26 Decrease 9 F
22 TLR4 rs77214890 D181Y -0.98 Decrease 8 F
23 TLR4 rs80197996 L470F -0.86 Decrease 9 S
24 TLR4 rs55905951 A676G -1.19 Decrease 9 S
25 TLR4 rs55786277 R804W -0.54 Decrease 6 -
26 TLR5 rs5744176 D694G -1.31 Decrease 9 F
27 TLR5 rs78098893 R752G -1.49 Decrease 7 -
28 TLR6 rs13102250 L105W 0.91 Increase 9 S
29 TLR9 rs55881257 R962C -2.62 Decrease 8 F
Abbreviations: DDG; free energy change value (DDG<0: Decrease Stability, DDG>0: Increase Stability). The pH and the temperature were set to7 and 25˚C for all submissions, respectively. F: functional residue; S: structural residue.
Fig 5. Deep view of superimposed structure of wild and mutant TLR2. A: L81P; B: R677W and C: Y715N. The protein and the side
chains of the wild-type and the mutant residue are shown and colored grey, green and red, respectively.
Fig 6. Hydrogen bonding interactions and clashes of wild type and mutant TLR4 at position 181. A: the wild-type residue (D) forms
hydrogen bonds (green discontinuous line) with L155, V157, A158, L182 and S183; B: substitution of this amino acid with tyrosine will
cause loss of hydrogen bonds with A158, L182 and S183. Moreover, the mutation showed a network of clashes (pink discontinuous line) with A158 and S183 residues.
hydrophobicity and charge. The difference in charge will disturb the ionic interactions of the wild type residue with D388, E389 and D398. R391H is annotated with rs55944915 in dbSNP database. According to the PISA-database, the mutated residue is involved in a multimer contact. The new residue might be too small to make multimer contacts. In S151F variant, rs55824172 of TBK1 gene, the mutant residue (phenylalanine) is bigger and more hydrophobic than the wild-type (serine). This conversion will cause the loss of hydrogen bonds in the core of the protein resulting in the disruption of correct folding.
We found that three SNPs in TLR1, including P733L (rs5743621), L697S (rs41311402) and L144P (rs117033348), were located in highly conserved regions and predicted to have functional and structural impacts on proteins. For P733L, the mutant residue (leucine) is bigger than the wild-type (proline) and is located on surface of the protein, potentially disturbing its interactions. For L697S and L144P, the mutant residues are smaller than the wild-type residues and will cause an empty space in the core of the protein. In addition, all three mutations are predicted to have functional and structural influences on TLR2 protein (Figure 5).
For L81P (rs56303479),because this residue is part of some interpro domains like leucine-rich repeat, typical subtype, the interaction between
these domains could be disturbed by the mutation. The R677W (rs121917864) mutation leads to substitution of arginine by a bigger and more
hydrophobic residue named tryptophan. The difference in charge will disturb the ionic interaction made by the arginine with E649 and
656. The third mutation of TLR2 occurs at position 715 (rs5743706). The hydrophobicity of the wild-type (tyrosine) and mutant residue (asparagine)
differs and the mutation will cause the loss of hydrophobic interactions in the core of the protein. Finally, the size difference between residues makes
that the new residue is not in the correct position to make the same hydrogen bond with S646, as the wild-type residue does. For N284I (rs5743316, in
Buried F 151 0.116 23.30 -0.048
6 TLR1 rs5743621 P733L Exposed
Exposed P L 733 733 0.575 0.569 81.57 104.23 0.687 0.717
7 TLR1 rs41311402 L697S Buried
Buried L S 697 697 0.028 0.030 5.05 3.49 0.951 0.649 8 TLR1 rs117033348 L144P Buried
Buried L P 144 144 0.038 0.035 6.92 5.023 0.503 0.657
9 TLR2 rs5743706 Y715N Buried
Buried Y N 715 715 0.152 0.153 32.46 22.39 0.193 0.253
10 TLR2 rs56303479 L81P Buried
Buried L P 81 81 0.038 0.029 6.93 4.10 0.362 0.758 11 TLR2 rs121917864 R677W Buried
Buried R W 677 677 0.243 0.255 55.60 61.32 -0.079 -0.088
12 TLR3 rs5743316 N284I Buried
Buried N I 284 284 0.083 0.088 12.16 16.33 -1.686 -1.081 13 TLR3 rs111488413 P880Q Exposed
Exposed P Q 880 880 0.401 0.446 56.88 79.65 0.150 0.108 14 TLR4 rs77214890 D181Y Buried
Buried D Y 181 181 0.240 0.258 34.52 55.24 0.528 0.277 15 TLR4 rs80197996 L470F Buried
Buried L F 470 470 0.090 0.089 16.40 17.88 0.080 0.247 16 TLR4 rs55905951 A676G Buried
Buried A G 676 676 0.033 0.034 3.62 2.71 -0.046 -0.158
17 TLR5 rs5744176 D694G Buried
Buried D G 694 694 0.164 0.173 23.57 13.64 -0.270 -0.384 18 TLR6 rs13102250 L105W Buried
Buried L W 105 105 0.030 0.031 5.51 7.40 0.843 0.799 19 TLR9 rs55881257 R962C ExposedExposed R
C 962 962 0.419 0.464 95.95 65.20 0.066 0.045 Abbreviations: RSA: Relative Surface Accessibility; ASA: Absolute Surface Accessibility. Values for wild type and mutant variants are presented by red and green color respectively
TLR3), due to the difference in hydrophobicity
index of residues, the mutation will cause the loss of hydrogen bonds in the core of the protein and may lead to incorrect folding of protein. The second mutation of TLR3 (rs111488413) causes P880Q. This mutant residue is bigger than the wild-type residue and can disturb the protein interactions. Additionally, the hydrophobicity of the residue differs; hence, the mutation may cause the loss of hydrophobic interactions.
Concerning D181Y mutation in TLR4 (rs77214890), the difference in charge will disturb the ionic interaction made by the original residue with R234. Moreover, the hydrophobicity of the native and mutant residue differs. Therefore, this mutation causes the loss of hydrogen bonds in the core of the protein leading to disruption of the correct folding (Figure 6). For rs80197996 (L470F) in TLR4, the mutant residue (phenylalanine) is bigger and probably will not fit to bury in the core of the protein. In A676G (rs55905951), the mutant residue is smaller than the wild-type residue. This will cause a possible loss of external interactions. Furthermore, the mutation may cause the loss of hydrophobic interactions with other molecules on the surface of the protein.
Concerning rs5744176 (D694G) of TLR5, the wild-type residue forms a salt bridge with K692, R752 and K753. The difference in charge will disturb these ionic interactions. Moreover, the aspartic acid forms a hydrogen bond with N726, but due to difference in hydrophobicity, the mutation causes the loss of hydrogen bond. For the L105W (rs13102250) in TLR6, the wild-type (leucine) and mutant (tryptophan) amino acids differ in size. The wild-type residue was buried in the core of the protein, but the mutant residue is bigger and probably will not fit. For rs55881257 (R962C in TLR9) the charge of the wild-type residue will be
lost; this can cause the loss of interactions with other molecules or residues. Furthermore, this
mutation introduces a more hydrophobic residue at this position, probably resulting to loss of hydrogen bonds.
Discussion
TLRs signaling pathway plays a key role in the host innate immune response. Increasing evidence has suggested that functional SNPs of genes related to TLRs pathway may contribute to diseases ranging from chronic inflammatory to cancers. Since SNPs are the most common genetic variations in human genome, it is expected that genes involved in TLRs pathway contains numerous SNPs. Nevertheless, discriminating deleterious SNPs with potential effects on disease susceptibility from tolerated variants is a major challenge. Therefore, a comprehensive study that systematically analyzes the effects of such SNPs can cost-effectively prioritized SNPs for further analyzes.
In-silico analysis of the deleterious effects of
SNPs may help to improve our understanding on the biological pathways (22). In this study, we systematically analyzed the SNPs in different parts of genes (5′-UTR, 3′-UTR and coding) in TLRs pathway. A report has suggested that mutation effect prediction algorithms have their own strengths and weaknesses, and therefore, implementing a combination of these tools may help to enhance the accuracy of effect predictions (23). In the present study, we combined the results of the SIFT, PolyPhen, PANTHER, SNPs & GO, I-Mutant and ConSurf algorithms to prioritize the damaging nsSNPs and increase the analysis accuracy. Accordingly, we were able to identify several potentially deleterious nsSNPs in TLRs pathway genes. These SNPs, to the best of our knowledge, have not yet been investigated and therefore may be considered as candidates for association with diseases. These results may pave the ground for future functional and/or association
associated variants that potentially confer the disease risk through affecting transcription factors or miRNAs binding. TLR9 rs187084, a UTR-SNP which probably interferes with transcription factors binding, has been shown to modify susceptibility to diseases specially renal transplant recipients and cancers (26-27). Several genes of TLRs pathway are regulated post-transcriptionally by miRNAs (28). Our analysis revealed that several SNPs of TLRs network resided in microRNA target sites (Table 3) that may potentially modify miRNA-mediated regulation of these genes. For instance, rs7744 in 3′-UTR of MYD88 and rs696 in 3′-UTR of NFKBIA genes could disrupt the binding of miR-520f-3p and miR-208a-3p, respectively. Matsunaga et al. showed that homozygous minor allele of rs7744 is associated with the severity of ulcerative colitis (29). Moreover, it has been shown that rs696 G>A is associated with the susceptibility to different diseases including coronary artery disease and Behçet's disease (30-31).
In conclusion, the current study reports the first pathway-based bioinformatics analysis of SNPs in TLRs pathway genes and provides a prioritized list of functional SNPs potentially affecting regulation and function of the pathway. However, we noticed that the complexities of biological pathways merit the need for more experimentation to validate the true effect of these SNPs on TLRs network. Although the functional significance of the candidate SNPs was not
References
1. Kawai T, Akira S. The role of pattern-recognition receptors in
innate immunity: update on Toll-like receptors. Nature
immunology 2010;11:373-84.
2. Kawasaki T, Kawai T. Toll-like receptor signaling pathways.
Frontiers in immunology 2014;5:461.
3. Kawai T, Akira S. Toll-like receptors and their crosstalk with
other innate receptors in infection and immunity. Immunity
2011;34:637-50.
4. Drexler SK, Foxwell BM. The role of toll-like receptors in
chronic inflammation. The international journal of biochemistry
& cell biology 2010;42:506-18.
5. Chen JQ, Szodoray P, Zeher M. Toll-Like Receptor Pathways
in Autoimmune Diseases. Clinical reviews in allergy &
immunology 2016;50:1-17.
6. Bhatelia K, Singh K, Singh R. TLRs: linking inflammation
and breast cancer. Cellular signalling 2014;26:2350-7.
7. Lin YT, Verma A, Hodgkinson CP. Toll-like receptors and
human disease: lessons from single nucleotide polymorphisms.
Current genomics 2012;13:633-45.
8. Netea MG, Wijmenga C, O'Neill LA. Genetic variation in
Toll-like receptors and disease susceptibility. Nature
immunology 2012;13:535-42.
9. Cargill M, Altshuler D, Ireland J, et al. Characterization of
single-nucleotide polymorphisms in coding regions of human
genes. Nature genetics 1999;22:231-8.
10. Wang Z, Moult J. SNPs, protein structure, and disease.
Human mutation 2001;17:263-70.
11. Sabarinathan R, Tafer H, Seemann SE, et al. RNAsnp:
efficient detection of local RNA secondary structure changes
induced by SNPs. Human mutation 2013;34:546-56.
12. Boyle AP, Hong EL, Hariharan M, et al. Annotation of
functional variation in personal genomes using RegulomeDB.
Genome research 2012;22:1790-7.
13. Li JH, Liu S, Zhou H, et al. starBase v2.0: decoding
miRNA-ceRNA, miRNA-ncRNA and protein-RNA interaction networks
from large-scale CLIP-Seq data. Nucleic acids research
2014;42:D92-7.
14. Bhattacharya A, Ziebarth JD, Cui Y. PolymiRTS Database
3.0: linking polymorphisms in microRNAs and their target sites
with human diseases and biological pathways. Nucleic acids
research 2014;42:D86-91.
15. Kumar P, Henikoff S, Ng PC. Predicting the effects of
coding non-synonymous variants on protein function using the
SIFT algorithm. Nature protocols 2009;4:1073-81.
16. Adzhubei IA, Schmidt S, Peshkin L, et al. A method and
server for predicting damaging missense mutations. Nature
methods 2010;7:248-9.
17. Mi H, Guo N, Kejariwal A, et al. PANTHER version 6:
protein sequence and function evolution data with expanded
representation of biological pathways. Nucleic acids research
2007;35:D247-52.
18. Calabrese R, Capriotti E, Fariselli P, et al. Functional
annotations improve the predictive score of human
disease-related mutations in proteins. Human mutation 2009;30:1237-44.
19. Capriotti E, Fariselli P, Casadio R. I-Mutant2.0: predicting
stability changes upon mutation from the protein sequence or
structure. Nucleic acids research 2005;33:W306-10.
20. Petersen B, Petersen TN, Andersen P, et al. A generic
method for assignment of reliability scores applied to solvent
accessibility predictions. BMC structural biology 2009;9:51.
21. Venselaar H, Te Beek TA, Kuipers RK, et al. Protein
structure analysis of mutations causing inheritable diseases. An
e-Science approach with life scientist friendly interfaces. BMC
bioinformatics 2010;11:548.
22. Suresh PS, Venkatesh T, Rajan T. Single nucleotide
polymorphisms in genes that are common targets of luteotropin
and luteolysin in primate corpus luteum: computational
exploration. Gene 2012;511:353-7.
23. Wu J, Jiang R. Prediction of deleterious nonsynonymous
single-nucleotide polymorphism for human diseases.
TheScientificWorldJournal 2013;2013:675851.
24. Matoulkova E, Michalova E, Vojtesek B, et al. The role of
the 3' untranslated region in post-transcriptional regulation of
protein expression in mammalian cells. RNA biology
2012;9:563-76.
25. Dassi E, Zuccotti P, Leo S, et al. Hyper conserved elements
in vertebrate mRNA 3'-UTRs reveal a translational network of
RNA-binding proteins controlled by HuR. Nucleic acids
research 2013;41:3201-16.
26. Kim TH, Jeong KH, Kim SK, et al. TLR9 gene
polymorphism (rs187084, rs352140): association with acute
rejection and estimated glomerular filtration rate in renal
transplant recipients. International journal of immunogenetics
2013;40:502-8.
27. Zhang L, Qin H, Guan X, et al. The TLR9 gene
polymorphisms and the risk of cancer: evidence from a
meta-analysis. PloS one 2013;8:e71785.
28. He X, Jing Z, Cheng G. MicroRNAs: new regulators of
Toll-like receptor signalling pathways. BioMed research international
2014;2014:945169.
29. Matsunaga K, Tahara T, Shiroeda H, et al. The *1244 A>G
polymorphism of MyD88 (rs7744) is closely associated with
susceptibility to ulcerative colitis. Molecular medicine reports
2014;9:28-32.
30. Lai HM, Li XM, Yang YN, et al. Genetic Variation in
NFKB1 and NFKBIA and Susceptibility to Coronary Artery
Disease in a Chinese Uygur Population. PloS one
2015;10:e0129144.
31. Yenmis G, Oner T, Cam C, et al. Association of NFKB1 and
NFKBIA polymorphisms in relation to susceptibility of Behcet's
disease. Scandinavian journal of immunology 2015;81:81-6.