Two contemporaneous mitogenomes from terminal
Pleistocene burials in eastern Beringia
Justin C. Tackneya,1, Ben A. Potterb, Jennifer Raffc, Michael Powersd, W. Scott Watkinse, Derek Warnerd, Joshua D. Reutherb,f, Joel D. Irishg, and Dennis H. O’Rourkea
aDepartment of Anthropology, University of Utah, Salt Lake City, UT 84112;bDepartment of Anthropology, University of Alaska, Fairbanks, AK 99775; cDepartment of Anthropology, University of Kansas, Lawrence, KS 66045;dDNA Sequencing Core, University of Utah, Salt Lake City, UT 84112;eDepartment
of Human Genetics, University of Utah, Salt Lake City, UT 84112;fArchaeology Department, University of Alaska Museum of the North, Fairbanks, AK 99775;
andgResearch Centre in Evolutionary Anthropology and Paleoecology, Liverpool John Moores University, Liverpool L33AF, United Kingdom
Edited by Richard G. Klein, Stanford University, Stanford, CA, and approved September 18, 2015 (received for review June 17, 2015)
Pleistocene residential sites with multiple contemporaneous human burials are extremely rare in the Americas. We report mitochondrial genomic variation in the first multiple mitochondrial genomes from a single prehistoric population: two infant burials (USR1 and USR2) from a common interment at the Upward Sun River Site in central
Alaska dating to∼11,500 cal B.P. Using a targeted capture method
and next-generation sequencing, we determined that the USR1 infant possessed variants that define mitochondrial lineage C1b, whereas the USR2 genome falls at the root of lineage B2, allowing us to refine younger coalescence age estimates for these two clades. C1b and B2 are rare to absent in modern populations of northern North America. Documentation of these lineages at this location in the Late Pleisto-cene provides evidence for the extent of mitochondrial diversity in early Beringian populations, which supports the expectations of the Beringian Standstill Model.
Pleistocene burials
|
ancient mitochondrial DNA|
paleogenomics|
peopling|
AmericasT
he colonization of the Western Hemisphere has been of in-terest to scholars since 1590, when Jose de Acosta postulated a northeast Asian origin of the indigenous populations of the Americas (1). Both the archaeological (2, 3) and genetic (4–10) records consistently indicate a primary entry point from Asia to the Americas via the Bering Land Bridge, sometime during the Late Pleistocene. However, there are unfortunate lacunae in both records. The archaeological record indicates a relatively late (<14–16 kya), rapid colonization event following the Last Glacial Maximum. This temporal scale supports the clear northeastward geographical expansion of late Upper Paleolithic (Diuktai) populations from southern and central Siberia to Beringia after 16 kya (5). However, archaeological evidence is accumulating that shows people had penetrated parts of North and South America before 13,250 cal B.P., the earliest date as-sociated with Clovis, the first widespread cultural tradition in North America (2–5, 11).The genetic record is equally problematic. Continental scale analyses of genetic variation rely heavily on Central and South American population data, as well as data from Arctic populations (6–9, 12, 13). Few data exist for North American populations south of the Arctic. Recent surveys of contemporary genetic var-iation in the Americas are consistent with a period of population isolation during which the distinctive composition of Native American genomes differentiated from ancestral Asian genomes, followed by a rapid colonization; this scenario has been deemed
the“Beringian Standstill Model”(6, 7, 10). How early the Native
American gene pool diverged remains uncertain, but estimates of up to 30 kya have been postulated (5, 6, 10, 12, 14, 15). Most geneticists argue for at least a several thousand-year period of isolation and genetic differentiation in Beringia before a south-ward dispersal, despite the absence of supporting archaeological evidence (2, 4, 5, 10). Recently, Raghavan et al. (15), using ge-nome-wide low-coverage data, suggested the dates of this isolation began no earlier than 23 kya and lasted no longer than 8,000 y (15).
Ancient DNA (aDNA) samples from early inhabitants of the Americas would be important for linking the modern genetic and archaeological records (16), but few exist. The Mal’ta child from South Central Siberia indicates an early origin (>24 kya) of some signal of Native American ancestry (9), but although a few Pleistocene-aged remains have been recovered in central North America (below the Laurentide Ice Sheet) or along the Northwest Coast, no similarly aged Beringian human remains have previously been available for genetic comparison. Very few Late Pleistocene (>10,000 cal B.P.) individuals have yielded mitochondrial genetic (mtDNA) data, although we highlight the seven sites with ancient human remains dating to>8,000-y-old that have been characterized for mtDNA lineages: Hoyo Negro, Mexico (17); Anzick, MT (18); Kennewick, WA (19); On-Your-Knees Cave, AK; Wizard’s Beach, NV; Hourglass Cave, CO; and, indirectly through coprolite analysis, Paisley Cave, OR (the last four are reviewed in ref. 20) (Fig. 1).
In 2011 Potter et al. (21) reported on the discovery of a cremated 3-y-old child from a residential feature at Upward Sun River (USR) in eastern Beringia dating to 11,500 cal B.P. Additional excavation at this deeply stratified and well-dated site (22) recently yielded two additional infant burials (Fig. 1) (USR1 and USR2) (23). A series of radiocarbon ages securely date the three individuals between 11,600 and 11,270 cal B.P. (23). Based on dental and osteological aging methods, USR1 represents a late preterm fetus, and USR2 likely died within the first 6 wk of life (23). The proximity of these three burials, their context within the same feature, and radiocarbon analyses presented in Potter et al. (23) strongly suggest that all three
Significance
Beringia gave rise to the first Western Hemisphere colonists, although the genetic characterization of that source population has remained obscure. We report two mitogenomes from hu-man remains within Beringia, with an age (∼11,500 cal B.P.) that postdates the end of the initial colonization by only a few mil-lennia. The mitochondrial lineages identified (B2, C1b) are rare to absent in modern northern populations, indicating greater genetic diversity in early Beringia than in modern populations of the region. The antiquity and geographic location of these two burials, and the combined genomic and archaeological analyses, provide new perspectives on the link between Asia and the Americas, and the genetic makeup of the first Americans.
Author contributions: J.C.T., B.A.P., and D.H.O. designed research; J.C.T., B.A.P., J.R., M.P., J.D.R., and J.D.I. performed research; W.S.W. and D.W. contributed new reagents/analytic tools; J.C.T., W.S.W., and D.H.O. analyzed data; J.C.T., B.A.P., J.R., W.S.W., and D.H.O. wrote the paper.
The authors declare no conflict of interest.
This article is a PNAS Direct Submission.
Data deposition: The sequences reported in this paper have been deposited in the Gen-Bank database (accession nos.KT891989andKT891990).
1To whom correspondence should be addressed. Email: [email protected].
This article contains supporting information online atwww.pnas.org/lookup/suppl/doi:10. 1073/pnas.1511903112/-/DCSupplemental.
www.pnas.org/cgi/doi/10.1073/pnas.1511903112 PNAS Early Edition | 1 of 6
ANTHR
burials represent nearly contemporaneous events, and that the three individuals were members of a single population.
We attempted to extract and sequence the mitochondrial genomes from these three Late Pleistocene burials. From burnt bone fragments of the cremated infant and well-preserved samples of the petrous portion of the parietal bone, DNA was extracted using a silica-based method and attempts were made to Sanger sequence three overlapping fragments of the mitochondrial hypervariable region 1 (HVR1). From USR1 and USR2, all three HVR1 fragments were successfully amplified, and from the cre-mated infant only one fragment amplified, albeit inconsistently. DNA samples and applicable blank controls from USR1 and USR2 were converted to Ion Torrent Ion Plus Fragment libraries with laboratory-unique barcodes. We targeted the mitochondrial genomes by hybridization capture (24) and sequenced the libraries on two P1 chips with an Ion Proton System (Life Technologies). This is one of the first examples of the Ion Torrent technology applied to aDNA.
Results
From 58.7 and 55.8 million sequencing reads, 20,004 and 32,979
unique mtDNA reads (MAPQ ≥ 30) from USR1 and USR2,
respectively, were mapped to the human mtDNA reference
(Table S1). We used the Torrent Suite analytical pipeline to take
advantage of flow space information, base recalibration, read realignment, and an Ion-optimized mapping (tmap) and duplicate filtering approach. This pipeline also allowed variant calling with the Torrent Variant Caller (TVC), providing a range of variant quality metrics identical to current best-practices approaches for next-generation sequencing of modern samples. This pipeline is optimized for Ion Torrent reads, unlike most methodologies cur-rently used in the aDNA literature.
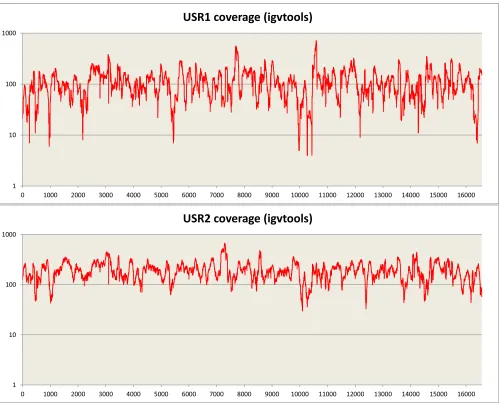
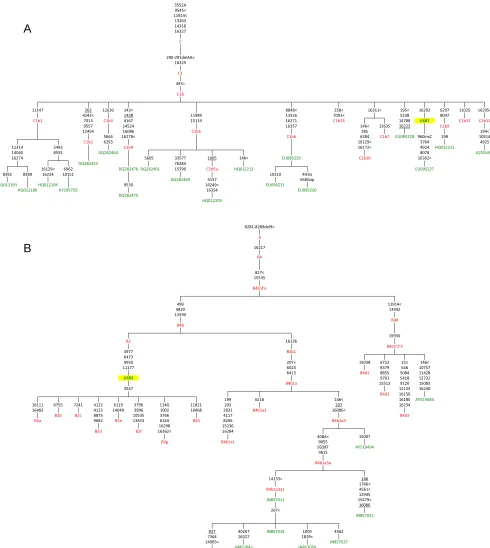
Sequencing of the enriched mtDNA from samples USR1 and USR2 resulted in 100% coverage of the mtDNA genomes with average read depths of 117×(geometric mean of 97×) for USR1 and 195×(geometric mean of 180×) for USR2 (Fig. S1). Mean read lengths for the two samples were 98 and 99 bp. Contamination es-timates were made by dividing the reference allele counts at called variants by the total coverage from the TVC output; contamination rates were estimated at 3.5% and 4.9% for the two samples, re-spectively. Maximum parsimony (MP) analysis of SNPs and in-sertion/deletions (indels) in the full genomes indicated membership in mtDNA lineages C1b (USR1) (Fig. 2A) and B2 (USR2) (Fig. 2B). The mtDNA genome of USR1 had a private variant in the form of SNP C16292T. The B2 lineage carried by USR2 revealed a single back mutation at nucleotide position 3547 to an ancestral adenine. A subset of called variants, in addition to the previously typed HVR1, were validated by Sanger sequencing.
Fig. 1. Geographic map of reported Native American populations with>40% C1 or B2 haplogroup fre-quencies, as well as locations of archaeological sites discussed. The locations of the Upward Sun River site, as well as the seven previously reported archaeological sites dated at>8,000 y B.P. with successfully genotyped human mitochondrial DNA lineages, are listed on the map (with reported haplotypes). Reported populations of≥20 individuals with≥40% C1 (yellow) or B2 (blue) are shown. Populations and frequencies specific to this figure (referenced by numbers 1–50) are available in theSI Materials and Methods.
From the initial Torrent Suite bioinformatics pipeline we observed an irregular pattern of DNA damage expected from aDNA samples
(Fig. S2). The 5′ends of these reads had unexpected low quality base
calls, likely from our custom adapters lacking a spacer sequence after the barcodes, and we were not able to investigate 3′damage patterns. We initiated an alternative pipeline for reads from both Ion P1 chips: we performed additional read trimming for adapter sequence, length
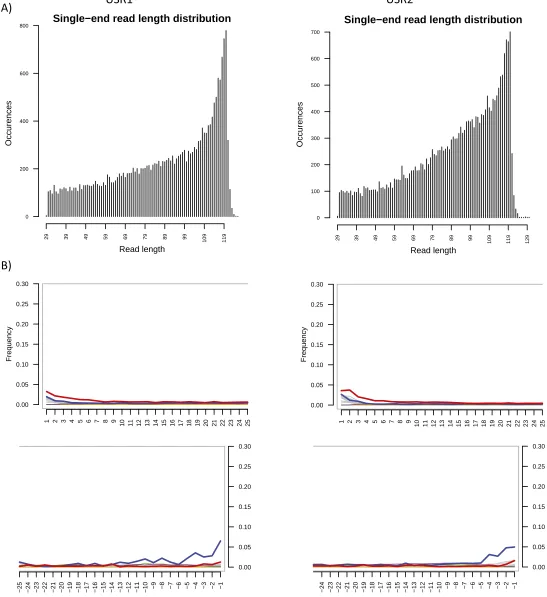
(30–120 bp), and quality, and we remapped (tmap) without 3′ clip-ping. Following this alternative pipeline, 21,140 and 22,951 mtDNA reads at MAPQ≥70 mapped to the mtDNA genome from USR1 and USR2, respectively (Table S2). One-hundred percent of the genome was covered, at average read depth of 113×(geometric mean of 103×) for USR1 and 125×(geometric mean of 119×) for USR2 (Fig. S3). Nucleotide mismatches now displayed the
C 290-291delAA< 16325 C1 493< C1b 3552A 9545< 11914< 13263 14318 16327
16311< 195< 16292 6297 11025 16295< 11147 263 12630 143< 8848< 258<
8047
C1b1 7013 C1b3 4167 15119 16271 C1b13 14788 USR1
4242< 1438 11989 13326 7091< 5238
C1b12 C1b11
9557 14524 16357 146< 13635 16223 C1b9
10514
C1b2 6293 16129< 3764 4925
12454 16086 C1b5 385 194<
5664 16278< C1b6 6284 C1b7
11314 5493 C1b4 16172< 4924 HQ012212 EU095228960insC 198
14040 8555 DQ282464 8078 JQ705451
16274 5605 3357T 1005 146<
DQ282461 15790 C1b5a
EU095229 C1b10 16362<
DQ282453 7628A
DQ282475
HQ012205
DQ282469 5157 568Gap
HQ012193 HQ012186 HQ012194 AY195759 < 9 4 2 6 1 0 3 5 9 HQ012213 EU095227
8392 8389 16224 10151 10310 441G 16129< 6962 DQ282476
8281-8289del9< B 16217 B4 827< 15535 EU095231 16354 EU095230 B4d B4b 15930 B2 16136 B4d1'2'3 B4b'd'e 499 11914< 4820 13942 13590
6722 151 146< 11177 6023 8379 546 10757
4977 B4b1
6473
9950 207< 15038
15083
3547 12135 16240
6413 B4d1 8855 5084 11428
USR2 9701 5418 12732
B4d2 16150 5 8 1 6 1 < 6 4 1 6 1 2 6 9 9 1
B4b1a 15512 9120
B4d3 B2b B2c 8875 10535 3766 4117
AY519484
16111 6755 7241 4122 6119 3796 114G 11821 202 16234
6164 B2h 8206 B4b1a3
1 3 8 2 8 6 4 6 1 2 0 0 1 6 9 9 3 9 4 0 4 1 3 2 1 4 3 8 4 6 1 B4b1a2 15007 1 a 1 b 4 B g 2 B 9055 9338T AY519494 6 3 2 5 1 8 9 2 6 1 4 8 2 6 1 < 2 6 3 6 1 12945 JN857011 15479< 16086 207< JN857022 9615 B4b1a3a 14133< 146 1766< B4b1a3a1 4561< 14905< JN857037 9 5 0 7 5 8 N J 3 4 0 7 5 8 N J JN857045
827 4026T JN857014 1005 4562 7364 16327 1819<
408A<
B2d B2f
16086< 207
B2a 9682 B2e 13833
A
B
Fig. 2. MP hand-curated phylogenetic trees of (A) C1b and (B) B4 mtDNA haplotypes. Only a subset of the sequences analyzed in this study are shown, along with the placement of USR1 and USR2. Sequences used in this analysis are listed in green and node assignments are listed in red.
Tackney et al. PNAS Early Edition | 3 of 6
ANTHR
expected damage patterns for degraded samples, although the 5′read ends still showed some residual unexpected alternative signal (Fig. S4). Although this pipeline lost the necessary flow-space information to make variant calls from Ion Torrent data, visual inspection of the aligned reads confirmed all variants called earlier by TVC. This suggests that the previous quality issue, although masking expected DNA damage patterns at the ends of reads, did not bias the accurate calling of these two samples.
Maximum-likelihood (ML) trees were created from curated alignments of 189 haplogroup C (Fig. 3A) and 147 haplogroup B sequences (Fig. 3B). USR1 was placed within a large clade shared with C1b, whereas USR2 was placed at the root of known Native American B2 diversity. Both samples exhibit branch length shortening relative to modern Native American sequences, because of their lower number of derived mutations, as expected for aDNA. The best tree by final likelihood score was compared with the results of 1,000 bootstrap runs. Nonparametric bootstrap support on the trees was poor within the Native American specific
haplotypes, given the relatively small number of characters providing signal in otherwise highly similar, and polytomous, mtDNA clades (25). Because USR1 and USR2 are contemporaneous, and modern Native American B2 and C1 sequences are observed to have similar coalescence times (6, 12, 26), we investigated the effect of these new sequences on the molecular dates of these clades.
We calculated the coalescence times using an ML-based ap-proach and either a molecular clock corrected for purifying selec-tion (27) or a faster, Bayesian-determined molecular clock based on ancient mitochondrial genomes (28). The C1b clade divergence time was estimated at 16,600 or 13,900 y ago, respectively with the two rates. USR1 was most closely related to an individual of the Arara people of Brazil (EU095227), with an estimated divergence date of 8,200 or 7,000 y ago (a clearly too-recent date given the age of USR1). The Native American-specific B2 clade coalescence time was estimated at 19,100 or 15,900 y ago, respectively (27, 28). All of these dates fall within previously published estimates.
9.0E-4 AY519496 (C1a)
Iceland_3 (C1e)
C1b
C1b
EF153779 (C1a)
HQ012210 (C1b)
FJ951613 (C4a1a1a)
C1b
EU095227 (C1b)
HM804483 (C1f) Iceland_2 (C1e)
C1b
UZOO 74 (C1f) EU007858 (C1a)
C1b
C1d Iceland_1 (C1e)
C1b
USR_1
C1c C1b
AP008311 (C1a) HQ012202 (C1b)
HQ012236 (C1b)
100 99
99
92
ML: 16.6 kya / 13.9 kya
BEAST: 12.9 kya (11.9 - 14.1 kya)
0.002
AY519494(B4b1a3)
JN857043(B4b1a3a1)
JN857037(B4b1a3a1)
USR_2
JN857045(B4b1a3a1)
AY519484(B4d1'2'3)
JN857059(B4b1a3a1) HQ012138(B2p)
B2
HQ012167(B2p)
JN857011(B4b1a3a1)
JN857022(B4b1a3a) JN857014(B4b1a3a1)
94
95
98
97 86
2.0E-3
ML: 19.1 kya / 15.9 kya
BEAST: 12.0 kya
(11.5 - 13.1 kya)
A
B
Fig. 3. ML phylogenies of (A) haplogroup C1 and (B) haplogroup B2. Native American tips and clades are highlighted in blue. USR1 and USR2 are highlighted in red. Some clades have been collapsed for space. Nonparametric bootstrap support for branches are noted for uncollapsed clades with support≥80%. The ML clade coalescence times using two alternative molecular clocks (27, 28) (see text) or using BEAST 2.2 (29) [mean (95% HPD interval)] are noted for clades C1b and B2. Lower scale bars represent branch length in average nucleotide substitutions per site.
Because the ML-based estimates do not take into account the radiocarbon ages of USR1 and USR2, we used the Bayesian Markov chain-Monte Carlo framework of BEAST 2.2 (29). This Bayesian phylogenetic method uses temporal information from dated sequences to calibrate a molecular clock without relying on geological or paleontological information. Using this approach, we calculated the C1b clade coalescence time at 12,854 y ago (11,853– 14,079) [mean; 95% highest posterior density (HPD) interval], with tip dates of 11,500 y ago for USR1 and 8,300 y ago for UZOO-74 (see below). The C1b clade coalescence date is near the younger bounds of the timescales calculated in the literature, although the 95% HPD overlaps with the date previously determined using the faster aDNA-calibrated substitution rate. The B2 clade coalescence time was estimated at 12,024 y ago (11,500–13,085), using a tip date of 11,500 y ago for USR2. This B2 date is also on the later end of previously reported timescales (28). As these estimates are derived from only one (B2) or two (C1) point estimated sequence ages, the analysis can be improved with increased whole-genome sequencing of ancient samples specifically within these clades. The general agreement, however, with the faster Bayesian molecular clock supports relatively young clade coalescence dates.
Discussion
The presence of mtDNA haplotype B2 is somewhat unexpected in this geographic location. This lineage is absent in northern and eastern Siberia (although it is found in the southern periphery) (30), and the pan-American B2 haplotype has not been reported in high-latitude populations of modern indigenous North Americans (Fig. 1). This unusual geographic distribution, coupled with lower restriction fragment length polymorphism haplotype genetic di-versity estimates, led to the hypothesis that the B2 lineage was introduced by a later, separate colonization event that did not pass through Beringia. However, following increased sampling and whole mitochondrial genome sequencing, haplogroup B2 phylog-enies were shown to have similar star-like phylogphylog-enies and co-alescence times to the other pan-American founding lineages (12). Moreover, Raff et al. (31) reported two individuals with hap-logroup B2 in prehistoric (800 and 490 cal B.P.) populations on the upper Alaska peninsula.
Haplogroup B2 in subarctic interior Alaska at the Upward Sun River site at such an early date suggests it was likely present and polymorphic in the Beringian population that gave rise to the initial dispersal south into the interior of the American continents. Importantly, the finding of haplogroup B2 in far northern interior populations shortly after initial colonization negates the need to postulate models of independent introduction of this mitochondrial lineage through alternative colonization routes. Its absence from modern high-latitude populations now appears consistent with the action of migration and genetic drift in small, dispersed early populations (4) rather than selection or independent introduction. It is noteworthy that haplogroup B was identified at two of the oldest sites in the Americas mentioned earlier: that is, at the
∼8,800 cal B.P. burial at Hourglass Cave in Colorado and in three coprolites dated between 14,270 and 14,000 cal B.P. at Paisley 5 Mile Point Caves in south-central Oregon. Neither site has yielded full mitochondrial genome data.
Haplogroup C is one of the two most common mitochondrial DNA clades throughout northern, eastern, and central Asia (the other being haplogroup D). The wide distribution of haplogroup C suggests it was a component of most migrations in northern Eurasia, with an origin between 30 and 50 kya (32). One daughter clade of the haplogroup is C1, which is composed of an Asian-specific C1a branch previously molecularly dated to 8,500 y ago (32), three Native American-specific (C1b, C1c, C1d) branches previously molecularly dated to 19,000 y ago (12, 26), an Icelandic-specific C1e branch (33), and a novel C1f haplotype sequenced from an individual dated to∼8,300 cal B.P. (UZOO-74) at the Mesolithic site of Yuzhnyy Oleni Ostrov, North West Russia (25) (although, see Fig. 3Afor a possibly related sequence, HM804483). Unlike the case for UZOO-74, the USR1 C1b sequence has a clear origin and evolutionary history in the Americas. This result
highlights the need for further genomic sequencing of comparably aged C1 lineages: for example, the 10,400 cal B.P. individual from Wizard’s Beach, NV and for further sequencing of any C1 lineages in Eurasia.
It is of interest that all five founding macrohaplogroups in Native American populations (A, B, C, D, and X) are represented in the small sample of individuals that lived more than 8,000 y ago in a geographic area stretching from subarctic Alaska to southern Mexico. Four of these macrohaplogroups are found at the three northern North American sites—Paisley Caves, Upward Sun River, and Anzick—dating to over 11,000 y ago. Mitochondrial lineage desig-nation for the majority of the pre-8,000 y ago individuals were de-termined by low resolution methods of restriction fragment length polymorphism analysis and direct sequencing of PCR products. Only three of the included studies (17–19) used genomic approaches, in addition to the Upward Sun River individuals reported here. Col-lectively, these results indicate a broad base of mitochondrial diversity in the earliest populations in North America and suggest the im-portance of postcolonization population dynamics in structuring modern genetic patterns. Cui et al. (13) recently bolstered this ference by reporting four mtDNA genomes from mid-Holocene in-dividuals from coastal British Columbia. The persistence of two unique A2a lineages but the extinction of the D4h3a lineage observed in the transition from ancient to modern Native American pop-ulations emphasizes that extant genetic patterns alone can be in-adequate indicators of prehistoric population diversity.
Although the Upward Sun River population postdates the end of the original dispersal of populations into North and South America by a few thousand years, it is temporally and geographically the closest known to the larger interior Beringian population that was the source of that earlier migration. Furthermore, if the Beringian population was subdivided in refugia, as recently suggested (4), the geographic structure seen in modern indigenous North Americans may reflect early population differentiation and multiple dispersals of small, isolated groups in interior Beringia to interior North America. Available archaeological and genetic data from Late Pleistocene contexts in North America are consistent with the origin of Native American mitochondrial genomes in populations resident in interior Beringia with subsequent dispersal southward sometime before 14–16 kya. The distribution of founding mitochondrial lineages in ancient samples of the Americas suggests an early movement of interior Beringian peoples southward at colonization, followed shortly by similar dispersal along the Pacific coast. The ancient mitochondrial genomes of the two contemporaneous Upward Sun River infant burials provide an important anchor between modern patterns of genetic variation and the inferences that may be drawn from retro-spective population genetic analyses.
Conclusion
The genomic results on the Upward Sun River infants are significant for several reasons. First, they not only double the number of late Pleistocene burials that have been characterized genetically, but they are also the only example to date of multiple burials from a single North American Pleistocene-aged archaeological site. Second, the genomic results from the USR infants support the Beringian route into the Americas and imply substantial interior Beringian genetic variation in the Late Pleistocene, consistent with expectations of the Beringian Standstill Model. Phylogenetic coalescent dates informed by the sample radiocarbon ages suggest more recent expansions for the Native American C1 and B2 clades than has previously been suggested. Third, these results clarify the infants’biological relation-ship to one another, something that morphological data could not do (23). Fourth, the fact that the infants are contemporaneous in time and buried together in a single act speaks to population diversity in ways that single sample reports cannot. And fifth, the dual burial of maternally unrelated infants (although perhaps paternally related), suggests additional hypotheses regarding mortuary practices and so-cial and ceremonial behaviors present at this early time; this line of investigation may be addressed in the future by both nuclear genomic analyses of the infants, as well as continued elaboration of the ar-chaeological context of the site.
Tackney et al. PNAS Early Edition | 5 of 6
ANTHR
Materials and Methods
USR1 and USR2 were complete and located 8–10 cm apart at the bottom of the pit feature at the Upward Sun River site, located in the middle Tanana River valley. Two petrous specimens were selected for DNA analyses given their overall mass and high density. Details on site formation, chronology, site disturbance, and excavation protocols are reported elsewhere (21–23, 34). Destructive analysis and genetic sequencing of the material was formally allowed by a Memorandum of Agreement with all interested parties. DNA was extracted using a silica-based method and initially amplified using established protocols. Extracts were prepared into Ion Plus Fragment libraries (Life Tech-nologies) with no DNA fragmentation or size selection. Fragments were blunt-end ligated with adapters containing laboratory-specific custom barcodes. Mitochondrial DNA was captured by hybridization (24) and each sample library was sequenced on its own Ion PIv2 chip (Life Technologies). Read processing was completed either within Torrent Suite, with variants called using TVC, or reads were processed using offline tools to determine DNA damage patterns. Haplotypes of consensus mitochondrial genomes from these variants were identified by MP and phylogenetic trees of all known related sequences were created by ML. Coalescence dates for the clades within these trees were
calculated using ML-based or Bayesian-based phylogenetic methods. Work was performed in a dedicated aDNA facility using established clean room protocols. Blanks were included at all steps in the process before sequencing and no lab-oratory personnel carry the haplotypes reported here. An expanded discussion of detailed materials and methods can be found inSI Materials and Methods,
Figs. S1–S6,Tables S1–S3, andDatasets S1andS2.
ACKNOWLEDGMENTS.We thank Lin Chen and Zhao Xu in the Life Technologies Next-Generation Sequencing Bioinformatics support team for long techni-cal conversations; Dr. Chad Huff for his expertise with PAML; Dr. Brendan O’Fallon and Dr. Remco Bouckaert for their support with BEAST; two anon-ymous reviewers for their helpful critiques; Dr. Ryan Bohlender for being an excellent and patient de facto server administrator; the laboratory of Dr. Lynn B. Jorde for providing space for the preparation of the modern mtDNA bait; and the Healy Lake Tribal Council and Tanana Chiefs Confer-ence representatives for their support. Sequencing was performed at the DNA Sequencing Core Facility, University of Utah. This project was funded in part by National Science Foundation Grants OPP-0732846, OPP-1137078, OPP-1138811, and OPP-1223119; and the College of Social and Behavioral Science and the Department of Anthropology at the University of Utah.
1. de Acosta J (2002)Natural and Moral History of the Indies(Duke Univ Press, Durham, NC). 2. Dixon EJ (1999)Bones, Boats and Bison: Archaeology and the First Colonization of
Western North America(Univ of New Mexico Press, Albuquerque, NM).
3. Meltzer DJ (2010)First Peoples in a New World: Colonizing Ice Age America(Univ of California Press, Berkeley, CA).
4. Hoffecker JF, Elias SA, O’Rourke DH (2014) Anthropology. Out of Beringia?Science
343(6174):979–980.
5. Goebel T, Waters MR, O’Rourke DH (2008) The late Pleistocene dispersal of modern humans in the Americas.Science319(5869):1497–1502.
6. Tamm E, et al. (2007) Beringian standstill and spread of Native American founders.
PLoS One2(9):e829.
7. Reich D, et al. (2012) Reconstructing Native American population history.Nature
488(7411):370–374.
8. Raghavan M, et al. (2014) The genetic prehistory of the New World Arctic.Science
345(6200):1255832.
9. Raghavan M, et al. (2014) Upper Palaeolithic Siberian genome reveals dual ancestry of Native Americans.Nature505(7481):87–91.
10. Mulligan CJ, Kitchen A, Miyamoto MM (2008) Updated three-stage model for the peopling of the Americas.PLoS One3(9):e3199.
11. Dillehay TD, ed (1997)The Archaeological Context and Interpretation(Smithsonian Institution Press, Washington, DC), Vol 2.
12. Achilli A, et al. (2008) The phylogeny of the four pan-American MtDNA haplogroups: Implications for evolutionary and disease studies.PLoS One3(3):e1764.
13. Cui Y, et al. (2013) Ancient DNA analysis of mid-holocene individuals from the Northwest Coast of North America reveals different evolutionary paths for mitoge-nomes.PLoS One8(7):e66948.
14. Fagundes NJ, et al. (2008) Mitochondrial population genomics supports a single pre-Clovis origin with a coastal route for the peopling of the Americas.Am J Hum Genet82(3):583–592. 15. Raghavan M, et al. (2015) POPULATION GENETICS. Genomic evidence for the Pleistocene
and recent population history of Native Americans.Science349(6250):aab3884. 16. Pickrell J, Reich D (2014) Toward a new history and geography of human genes
in-formed by ancient DNA.Trends Genet30(9):377–389.
17. Chatters JC, et al. (2014) Late Pleistocene human skeleton and mtDNA link Paleo-americans and modern Native Americans.Science344(6185):750–754.
18. Rasmussen M, et al. (2014) The genome of a Late Pleistocene human from a Clovis burial site in western Montana.Nature506(7487):225–229.
19. Rasmussen M, et al. (2015) The ancestry and affiliations of Kennewick Man.Nature
523(7561):455–458.
20. Raff JA, Bolnick DA, Tackney J, O’Rourke DH (2011) Ancient DNA perspectives on American colonization and population history.Am J Phys Anthropol146(4):503–514. 21. Potter BA, Irish JD, Reuther JD, Gelvin-Reymiller C, Holliday VT (2011) A terminal Pleistocene child cremation and residential structure from eastern Beringia.Science
331(6020):1058–1062.
22. Potter BA, Reuther JD, Bowers PM, Gelvin-Reymiller C (2008) Little Delta Dune site: A Late Pleistocene multi-component site in Central Alaska.Curr Res Pleistocene25:132–135. 23. Potter BA, Irish JD, Reuther JD, McKinney HJ (2014) New insights into Eastern
Be-ringian mortuary behavior: A terminal Pleistocene double infant burial at Upward Sun River.Proc Natl Acad Sci USA111(48):17060–17065.
24. Maricic T, Whitten M, Pääbo S (2010) Multiplexed DNA sequence capture of mito-chondrial genomes using PCR products.PLoS One5(11):e14004.
25. Der Sarkissian C, et al.; Genographic Consortium (2014) Mitochondrial genome se-quencing in Mesolithic North East Europe Unearths a new sub-clade within the broadly distributed human haplogroup C1.PLoS One9(2):e87612.
26. Perego UA, et al. (2010) The initial peopling of the Americas: A growing number of founding mitochondrial genomes from Beringia.Genome Res20(9):1174–1179. 27. Soares P, et al. (2009) Correcting for purifying selection: An improved human
mito-chondrial molecular clock.Am J Hum Genet84(6):740–759.
28. Fu Q, et al. (2013) A revised timescale for human evolution based on ancient mito-chondrial genomes.Curr Biol23(7):553–559.
29. Bouckaert R, et al. (2014) BEAST 2: A software platform for Bayesian evolutionary analysis.PLOS Comput Biol10(4):e1003537.
30. Starikovskaya EB, et al. (2005) Mitochondrial DNA diversity in indigenous populations of the southern extent of Siberia, and the origins of Native American haplogroups.
Ann Hum Genet69(Pt 1):67–89.
31. Raff J, Tackney J, O’Rourke DH (2010) South from Alaska: A pilot aDNA study of genetic history on the Alaska Peninsula and the eastern Aleutians.Hum Biol82(5-6):677–693. 32. Derenko M, et al. (2010) Origin and post-glacial dispersal of mitochondrial DNA
haplogroups C and D in northern Asia.PLoS One5(12):e15214.
33. Ebenesersdóttir SS, et al. (2011) A new subclade of mtDNA haplogroup C1 found in Icelanders: Evidence of pre-Columbian contact?Am J Phys Anthropol144(1):92–99. 34. Reuther JD (2013)Late Glacial and Early Holocene Geoarchaeology and Terrestrial
Paleoecology in the Lowlands of the Middle Tanana Valley, Subarctic Alaska(Univ of Arizona, Tucson, AZ).
35. Liversidge HM, Molleson T (2004) Variation in crown and root formation and eruption of human deciduous teeth.Am J Phys Anthropol123(2):172–180.
36. AlQahtani SJ (2008)Atlas of Tooth Development and Eruption(Queen Mary Uni-versity of London, Barts and the London School of Medicine and Dentistry, London). 37. Schutkowski H (1993) Sex determination of infant and juvenile skeletons: I.
Mor-phognostic features.Am J Phys Anthropol90(2):199–205.
38. Turner CG, Nichol CR, Scott GR (1991) inAdvances in Dental Anthropology, eds Kelly M, Larsen C (Wiley-Liss, New York), pp 13–32.
39. Sciulli PW (1998) Evolution of the dentition in prehistoric Ohio Valley Native Ameri-cans: II. Morphology of the deciduous dentition.Am J Phys Anthropol106(2):189–205. 40. Rohland N, Hofreiter M (2007) Ancient DNA extraction from bones and teeth.Nat
Protoc2(7):1756–1762.
41. Rohland N, Hofreiter M (2007) Comparison and optimization of ancient DNA ex-traction.Biotechniques42(3):343–352.
42. Krishnan A, Sweeney M, Vasic J, Galbraith D, Vasic B (2011) Barcodes for DNA se-quencing with guaranteed error correction capability.Electron Lett47(4):236–237. 43. Gansauge M-T, Meyer M (2013) Single-stranded DNA library preparation for the
se-quencing of ancient or damaged DNA.Nat Protoc8(4):737–748.
44. Dabney J, et al. (2013) Complete mitochondrial genome sequence of a Middle Pleistocene cave bear reconstructed from ultrashort DNA fragments.Proc Natl Acad Sci USA110(39):15758–15763.
45. Li H, et al.; 1000 Genome Project Data Processing Subgroup (2009) The sequence alignment/map format and SAMtools.Bioinformatics25(16):2078–2079.
46. DePristo MA, et al. (2011) A framework for variation discovery and genotyping using next-generation DNA sequencing data.Nat Genet43(5):491–498.
47. Thorvaldsdóttir H, Robinson JT, Mesirov JP (2013) Integrative Genomics Viewer (IGV): High-performance genomics data visualization and exploration.Brief Bioinform14(2):178–192. 48. Jónsson H, Ginolhac A, Schubert M, Johnson PL, Orlando L (2013) mapDamage2.0: Fast approximate Bayesian estimates of ancient DNA damage parameters.Bioinformatics
29(13):1682–1684.
49. Martin M (2011) Cutadapt removes adapter sequences from high-throughput se-quencing reads.EMBnet.journal17(1):10–12.
50. Briggs AW, et al. (2007) Patterns of damage in genomic DNA sequences from a Ne-andertal.Proc Natl Acad Sci USA104(37):14616–14621.
51. Katoh K, Standley DM (2013) MAFFT multiple sequence alignment software version 7: Improvements in performance and usability.Mol Biol Evol30(4):772–780. 52. van Oven M, Kayser M (2009) Updated comprehensive phylogenetic tree of global
human mitochondrial DNA variation.Hum Mutat30(2):E386–E394.
53. Lanfear R, Calcott B, Ho SYW, Guindon S (2012) Partitionfinder: Combined selection of partitioning schemes and substitution models for phylogenetic analyses.Mol Biol Evol29(6):1695–1701.
54. Stamatakis A (2014) RAxML version 8: A tool for phylogenetic analysis and post-analysis of large phylogenies.Bioinformatics30(9):1312–1313.
55. Yang Z (2007) PAML 4: Phylogenetic analysis by maximum likelihood.Mol Biol Evol
24(8):1586–1591.
Supporting Information
Tackney et al. 10.1073/pnas.1511903112
SI Materials and Methods
Description of Samples and Archaeological Context.Both infants were recovered from a burial pit at the Upward Sun River site (USR), located in the middle Tanana River valley (49XBD-298) (Fig. S5). Details on site formation, chronology, and evaluation of site disturbance have been previously reported (21–23, 34). Four components dating between∼13,200 and∼10,000 cal B.P. are securely dated through a suite of 27 feature and stratigraphic dates (21, 23). The infants were recovered within a massive aeolian silt (Unit IV) at∼160–170 cm below the surface, within the burial pit; the upper cremated child was recovered at∼80 cm below the surface. Several continuous and discontinuous Ab horizons (Ab4) reflecting Typic Cryorthent shrub tundra-derived soils are expressed between 50 and 260 cm below the surface. Postdepositional natural disturbance is interpreted to be minimal given the Ab horizons are level across the site with smooth and very abrupt horizon bound-aries and limited evidence of faunal burbation and microfaulting that did not intersect cultural features. Component integrity is considered high given a thin vertical distribution of cultural mate-rials and sharp hearth feature boundaries.
Organic preservation is excellent within the lower deposits of the Upward Sun River site. The rapid burial of remains by wind-blown silt (loess) and very fine sand during the terminal Pleistocene and early Holocene (13,200–9,000 cal B.P.) created a buffer of over 1 m of sediment between the interred individuals and the cremation and the more acidic coniferous dominated forest soils of the middle and late Holocene (8,000 cal B.P. to present) (34). The pH values for the terminal Pleistocene and early Holocene deposits at the Upward Sun River site show relatively high alkaline characteristics range between 9.5 and 6.90, with an average of 8.78. The pH values for the sediments surrounding the burial and cremation pit range between 9.26 and 7.34, and average 7.95 in pH. The alkaline nature of the sediments surrounding the burials and cremation is also evident in the presence of calcium carbonate root casts. The sedi-ments and soils at the Upward Sun River site begin to trend toward more acidic values (6.90–5.60 in pH) around 1 m above the burials. All three sets of human remains are associated with Feature F2010-5/2011–13 from Component 3 at USR, dating to the terminal Pleistocene–Holocene boundary (23). The cremated child (Individual 3, not analyzed here) was found within F2010-5, a pit hearth asso-ciated with dense charcoal concentrations, burned bone, and oxidized sediment extending to 80 cm BD (∼43 cm below the occupation surface). The occupation surface is composed of numerous lithics and charcoal fragments in a thin, unimodal vertical distribution. Two charcoal samples from the base of this hearth (Beta-280585, 280586, both Populus balsamifera), and one sample from the top of the backfilled pit hearth (Beta-280584,Populus/Salix) were statistically of the same age. Pit fill (designated F2011-13) was encountered below the oxidized sediment. The two infants and grave goods [three bifaces and four antler rods comprising a hunting toolkit of two hafted dart/ spear projectile points and foreshafts (23)] were found at the base of the pit at 124–128 cm BD, or 44–48 cm below the upper hearth. A piece of charcoal adhering to one of the antler rods yielded a sta-tistically similar date (Beta-371567, Betula sp.) to the three other dates (χ2=7.81, df=3,P<0.05), with a mean pooled radiocarbon age of 9970 ± 30 B.P. (11,600–11,270 cal B.P.). These ages are consistent with the dating on other hearths and are intermediate between Component 2 and Component 4 radiocarbon dates (21, 22). Individuals 1 and 2 were complete and located 8–10 cm apart at the bottom of the pit feature. Deciduous crown development (35, 36) indicates that Individual 1 died at 6–12 wk postnatal and Individual 2 died at>30 prenatal weeks. Morphological analyses
may suggest that both individuals are female (37). No skeletal pa-thologies were evident. Results from dental nonmetric trait analysis in Individual 1 are consistent with a Native American population affinity (38, 39).
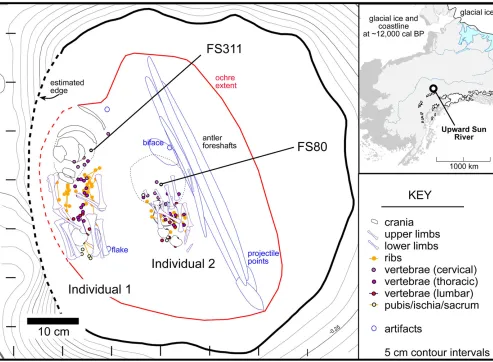
Two petrous specimens were selected for aDNA analyses given their overall mass and high density (Fig. S6). Specimen #58-311 from Individual 1 had an initial weight of 3.4 g and specimen #58-80 from Individual 2 had an initial weight of 1.2 g. Ochre covered the remains, and was variable for Individual 1 specimens, including 58-311, ranging from 10R 3/2 (dusky red) to 5YR 4 (reddish brown), whereas Individual 2 was more homogeneous in staining, generally 2.5YR 4/4 (yellowish red).
Excavation protocols are described in ref. 23. Field protocols for collection of human remains included powder-free nitrile gloves and facemasks and minimal contact with remains between excavation and bagging. Each specimen was identified and cataloged by J.D.I. at the University of Alaska Fairbanks Archaeology Laboratory.
Legal and Ethical Issues Pertaining to the USR Specimens.The Upward Sun River site burials were found on land owned by the State of Alaska. Before excavations were initiated in 2010, a Memorandum of Agreement was signed by the State of Alaska and the lead federal agency (National Science Foundation) with Healy Lake Tribal Council, the local BIA-recognized tribal authority, and the Tanana Chiefs Conference, the regional nonprofit Native organization, as invited signatories. This Memorandum of Agreement stipulated the process to be followed if human remains were conducted, following the Native American Graves Protection and Repatriation Act. After the remains were discovered, an amendment was signed by all parties that allowed for destructive analysis on very small portions of the skeletal remains to determine age, dietary evidence through stable isotope analyses and genetic relationships through aDNA analyses.
DNA Extraction and Mitochondrial HVR1 Sanger Sequencing.DNA was extracted using a silica-based method, as is typically applied in the field (40, 41). The original specimens were either already highly fragmented or brittle/burnt, so no drilling was performed. Of the sample, 80–120 mg was digested in a 1-mL buffer consisting of 0.5 M EDTA, 250μg/mL proteinase K, and 40 mM DTT at 37 °C overnight with rotation. The extraction buffer was spun down, and the released DNA molecules in the supernatant were mixed with 4 mL of Guanidine Thiocyanate-based Dehybernation Solution A and 200 μL of Ancient DNA GLASSMILK (silica suspension) components of the GENECLEAN For Ancient DNA Kit (MP Biomedicals), along with a final concentration of 0.05% Tween-20. This solution was incubated at 37 °C with rotation for 3 h. The silica particles were collected and purified as per the manufacturer’s protocol for the rest of the GENECLEAN kit. Final elution using two rounds of 30 μL of TE−4(10 mM Tris, 0.1 mM EDTA)+0.02% Tween-20 was performed. DNA extracts were stored in LoBind tubes at−20 °C. One water extraction blank was processed at the same time as the samples.
A portion of the mtDNA HVR1 was amplified and sequenced as described in ref. 31. The extraction blank and numerous water PCR blanks were processed at the same time. Variants present in nucleotide positions 16043–16161, 16183–16277, and 16288–16402 were typed. Because these variants suggested Native American haplotypes, and no product was evident at any point in the blanks, these extracts were chosen for next-generation sequencing.
Ion Torrent Library Preparation.Libraries were prepared as per the Ion Plus Fragment Library Kit (Life Technologies) with the following modifications: no DNA fragmentation or size selection at any point was performed. All solid-phase reversible immobilization bead purification steps were replaced with silica-column clean-ups (Clean & Concentrator-5; Zymo Research). Ion A Adapters were created with the suggested TT tails and with laboratory-specific 8-base barcodes, based on an unique set of guaranteed error correcting codes that are redundant up to 2-bit errors (at most one nucleotide error in base space or two errors in flow space) (42) (Table S3). During adapter ligation and nick repair, final adapter concentrations in the reaction were reduced to 0.04μM. Unamplified libraries were eluted into 22μL TE−4and initially quantified by qPCR (GeneRead Library Quantification Kit; NGTF-ITZ-F Qiagen) to both deter-mine molecule concentrations and optimal cycles for amplification (43). Ten microliters of the unamplified libraries were used in a 100-μL primary library amplification reaction with AmpliTaq Gold 360 Master Mix (Life Technologies). This primary amplification was limited to ≤15 cycles. Final primary amplification products were eluted into 40μL of TE−4with UltraClean PCR Clean-Up Kits (MO BIO Laboratories). All previous and subsequent amplifications were done with Ion_Aamp and Ion_P1amp amplification primers at 0.4-μM final concentrations (Table S3).
Hybridization Capture and Sequencing of mtDNA. Hybridization capture of mtDNA was performed as in ref. 24, using the lower hybridization and wash temperatures of ref. 44, for∼48 h. In a modern genetics laboratory in a separate building, two long-range PCR amplicons were created (with Phusion Hotstart Flex; New England Biolabs) from an African mtDNA with haplotype L2a4a, with private mutations (514T, 516T, 573.XC!, 6254G, 16188.C, 16319A, 16519C). The amplicons were mixed in equi-molar amounts and fragmented with a Covaris S2 down to 100-bp target peaks. Biotinylated bait molecules were immobilized on Dynabeads MyOne Streptavidin C1 beads (Life Technologies). Each library was captured separately with∼270 ng of bait, 320–613 ng of library (from multiple secondary amplifications with Q5 Hot Start mastermix; New England Biolabs), and blocking oligos ap-propriate to our Ion Torrent adapters (Table S3) at 1.9-μM working concentrations. Libraries were released from the beads with a final 5-min incubation at 95 °C. Eluted captured molecules were quan-tified via qPCR, amplified with Q5 Hot Start mastermix into the exponential phase (43), and purified with silica columns.
Before sequencing, the libraries were assessed for concentration and fragment size distribution using a fragment analyzer (FA; Analytical Technologies). The FA results did not yield measureable amounts of DNA. A quantitative real-time PCR analysis generated using the GeneRead Kit, however, did detect properly ligated li-braries. The libraries were diluted to 100 pM based upon the quantitative real-time PCR results. The individual libraries were further diluted to 10 pM before amplification in the templating reaction using the Ion Torrent One Touch 2 (Life Technologies) and the Ion PI Templating OT2 200 v3 kit (Life Technologies). After the amplification step by emulsion PCR, an enrichment step was performed on the Ion Torrent ES to enrich for positive ion sphere particles (ISPs). While the enrichment step was being performed, a 2-μL aliquot of the postemulsion PCR, taken before the enrichment step, was evaluated separately with the Ion Sphere Quality Control kit to determine the percentage pre-enrichment of the templating reaction. The manufacture suggests a pre-enrichment percentage between 10% and 30%; these libraries were 10.48% and 10.57% for USR1 and USR2, respectively. After capturing enriched ISPs, sequencing was performed on the Ion Torrent Proton using the Ion PI Sequencing 200 v3 Kit and Ion PIv2 chip (Life Technologies).
Torrent Suite Data Processing and Mapping.Torrent Suite 4.0.2 was used for the initial read processing off of the Proton sequencer. In our experience,next-generation sequencing tools available online
are customized for Illumina sequencing chemistry and error profiles. These tools perform suboptimally on exported FASTQ files from Ion Torrent reads. Additionally, FASTQ files do not contain flow space information (flow order and flow signal), used by sequencing-by-synthesis methods, which is necessary to fully leverage Proton read processing, as well as the TVC software package. We initially chose this analytical pipeline to take ad-vantage of these strengths of the Ion Proton technology, while retaining some of the customizability that is offered by typical freeware programs and scripts.
For Torrent Suite 4.0.2, default parameters were used with the following changes: We omitted all sequences below 30 bp in length (postquality trimming) with additional Basecaller arguments (–trim-min-read-len 30–min-read-length 30; note default barcode settings allow for two errors in flow space). We mapped against rCRS (NC_012920) using TMAP (stage1 map2 map3 map4, and allowing the default 3′ soft clipping function). We incorporated
“Base Recalibration,” “Mark as Duplicates,”and“Enable
Realign-ment,”and we finished by running the FilterDuplicates plugin. The Torrent Suite uses an Ion-optimized duplicate filtering approach that takes into account not only the 5′alignment start site but the 3′ adapter flow position (if the read extends into it) as well. We have found that this approach retains more unique sequences than the Samtools (45) rmdup function, which is optimized for paired-end Illumina sequencing reads.
Mapped BAMs (after duplicate filtration) were processed to remove reads with MAPQ < 30 using Samtools 0.1.19 (45). A stand-alone version of TVC 4.2.3 (optimized for Ion Torrent reads with flow space information) was used to call variants, with a custom parameter file at a high-stringency setting to minimize false-positive calls and optimize for a haploid genome. A consensus file was created from the vcf and the rCRS (NC_012920) using the reference utility FastaAlternateReferenceMaker of the GATK (46) version found within TVC 4.2.3. In two situations (the SNPs at 16182/16183 and A9545G) the consensus file was manually edited based on the produced VCF to properly note complex variants (namely SNPs in close proximity to other SNPs or indels) that were not called by TVC or properly translated by GATK.
Genomic coverage depth was calculated at a 1 base window size with igvtools (47), replacing TVC FDP depth counts at called deletions. General sequencing QC metrics were analyzed with FastQC v. 0.11.2 (www.bioinformatics.babraham.ac.uk/projects/fastqc/). Read-length histograms and nucleotide misincorporation pat-terns were assessed using MapDamage v2.0.2–12 (48) (–length 120–seq-length 20–forward). Haplotypes were initially assigned using mtPhyl 4.015 (https://sites.google.com/site/mtphyl/home) and then manually confirmed or clarified following the latest nomenclature onPhyloTree.org[Build 16 (19 Feb. 2014)].
After Torrent Suite analysis, it became apparent that faulty adapter design issues caused low-quality base calls at the 5′end of all reads and prevented us from investigating typical aDNA damage patterns (seeAuthentication of aDNA Work, below). This is likely the result of our custom adapters lacking a “GAT” barcode adapter sequence between the barcode and the start of the ligated fragment. A joining sequence is suggested to avoid a two-mer (or more) incorporation at the end of the barcode during Ion semiconductor sequencing, which would result in the software not correctly identifying and clipping the barcode, and potentially cause low quality base calling in the Torrent Suite software package. We therefore reanalyzed the reads outside of the Torrent Suite, which we outline in the subsequent section. This also provided us an opportunity to validate the Torrent Suite analytical pipeline.
Alternative Bioinformatics Data Processing and Mapping. Reads were reprocessed from both Ion PIv2 chips within Torrent Suite 4.0.2 without a reference genome (no mapping or related set-tings), without reads below 30 bp in length (–trim-min-read-len
30–min-read-length 30), and with default Ion quality trimming for v4.0.2. Both of the output BAM files were converted to FASTQ files—the barcoded (detected and subsequently trimmed) reads and the no-barcode reads—with Picard Tools v1.91 (sourceforge.net/
projects/picard/). Of note, SamToFastq removes Ion flow space
data, as Ion uses a nonstandard SAM tag to store this information. Cutadapt v1.8 (49) was next used to trim the FASTQ files in the following order: barcodes (for just the no-barcode reads and re-quiring a perfect match; -n 5–overlap 8), 3′ adapter sequences (10% error tolerance; -n 2–overlap 6), and read end base quality of
≥20 (–minimum-length 30 -q 20,20). The processed FASTQ files for each sample were merged and were mapped against rCRS (NC_012920) using TMAP (stage1 map2 map3 map4, and without 3′clipping). We used a custom perl script to remove all mapped reads below length of 30 bp and above length of 120 bp. We then used Samtools 0.1.19 (45) to remove reads with MAPQ<70. Finally, we processed the mapped BAMs with Picard Tools MarkDuplicates to mark and remove duplicates. Read metrics were processed as in the original Torrent Suite pipeline.
We are unable to do proper variant calling on BAMs that lack flow space information (Ion does not currently offer the tools to do read manipulations while editing and retaining flow space information; this field cannot be trimmed like quality scores). However, we did view these final BAM files in IGV (47). We note that alignment viewers like IGV are limited when viewing Ion data; the reads reflect the sequences as originally called, not as finally evaluated after flow space re-evaluation. In particular, many variants in and around polynucleotide tracts visible in IGV are actually false calls and disappear after flow space data are taken into account. We were, however, able to visually check each nucleotide position along the rCRS reference genome.
For both USR1 and USR2, all variants called by the earlier pipeline with TVC were unambiguously confirmed in these new mapped BAM files, except for an indel at position 14342 in USR1, which was completely absent in the alternatively processed BAM. All other sites had>90% variant support (going by the simple ratio of derived over reference alleles from the IGV summary). This finding indicates that the consensus sequences created by the initial Torrent Suite pipeline are likely correct, even after correcting for low quality 5′read ends. For USR1, if we limit variant discovery to derived allele frequencies of ≥30% and without taking into account base quality, 25 C>T, 4 G>A, and 4 other nucleotide substitutions are observed. As C-to-T and G-to-A substitutions are expected in ancient DNG-to-A sequences (50), ob-servation of these additional SNPs is expected. Eight of these C>T potential variants were within regions that were Sanger-sequenced (seeSanger Validation and Contamination Estimates, below) and all eight were sequenced as the reference base. All of the remaining observed substitutions were found and discarded in the earlier de-scribed high-stringency TVC calling pipeline (albeit with a different processed BAM). The majority of these are near or within poly-nucleotide tracts. This indicates to us that these sites are all false calls (fixed later by flow space) and sites of low level damage. For USR2, many fewer additional substitutions were observed: 1 C>T, 1 G>A, two other nucleotide substitutions, and three other po-tential indels. Again, these were all near or within polynucleotide tracts, although none were Sanger-sequenced to verify. No addi-tional substitutions in either sample had the visual level of support within IGV as the originally called variants.
Enriched Read Summary.Following enrichment, amplification, and templating of the two libraries, Ion Proton sequencing read counts passing default filters (and≥30 bases) were on the low end of the expected 60–80 million reads specified for the chip. Additionally, of these reads, a higher than expected percentage failed barcode identification (19% and 9.4%; see above for barcode issues and alternative processing) (Table S1). After the Torrent Suite pipeline, a large percentage of sequences mapped
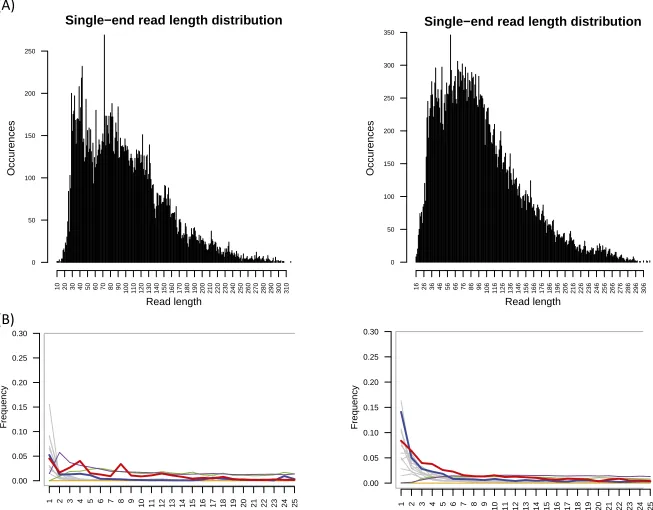
to human mtDNA: 39% for USR1 and 24% for USR2. Fol-lowing duplicate removal these recoveries dropped to 0.40% and 0.65%, respectively. This achieved 20,044 high quality reads for the USR1 library and 32,979 high quality reads for the USR2 library (Table S1). The large amount of duplicate amplicons in the libraries suggests that both libraries have been sequenced to exhaustion. Read-length histograms of the unique, MAPQ≥30 enriched libraries show mean read lengths of 98 and 99 bp, and median read lengths of 90 and 89 bp, for USR1 and USR2 re-spectively (Fig. S2A).
In the alternative bioinformatics pipeline, unaligned reads (lacking“Base Recalibration”given the absence of a reference genome) with the additional read trimming resulted in 40.3 million and 45.3 million reads for USR1 and USR2, respectively. After mapping, 33% for USR1 and 17% for USR2 mapped to the mtDNA genome. Following duplicate removal, length re-strictions (30–120 bp), and a MAPQ threshold of 70, 21,140, and 22,951 reads mapped to USR1 and USR2, respectively. These represent recoveries of 0.04% each (Table S2).
Sanger Validation and Contamination Estimates.In addition to the portion of HVS1 previously sequenced (see above), we selected a subset of variants called by the TVC to validate using Sanger sequencing. For USR1, the following variants were validated: T489C, A493G, 523delAC, T3552A, T9540C, A9545G, T14318C, C16223T, C16292T, T16298C, T16325C, and C16327T. For USR2 the following variants were validated: G499A, 3547A (ancestral A), 8281–8289d, A16183C, T16189C, T16217C. Additionally, each validated variant was sequenced in the other ancient sample and, as expected based on the assigned haplogroup, found to be the rCRS reference base. The single insertion of a T at nucleotide position 14342 in USR1 was called by TVC but was not Sanger validated. Apart from indel calling being suboptimal to SNP calling in most variant callers, and the lack of this variant in any known mtDNA sequence on PhyloTree.org or in the alterna-tively processed BAM, this insertion had the lowest phred-quality score of all called variants. Because this was the only case of a false-positive in the variants we validated, we believe our high-stringency TVC parameters are working as designed.
Mitochondrial contamination estimates were made by taking advantage of the TVC-produced VCF files, specifically the ref-erence allele and read depth observation counts at each called locus in the BAM file as determined by freebayes after flow space evaluation (TVC info tags FRO and FDP). This gives us a rough approximation of possible contaminant reads. For all variants (excluding 14342) in each VCF we calculated the mean, median, and range of the percentage of FRO:FDP. For USR1, these values were 3.5%, 1.64%, and (0–23.8%), with an average FDP of 94 and for USR2 these values were 4.9%, 3.4%, and (0–35.9%), with an average FDP of 166. The 23.8% reference allele ratio for USR1 was from the SNP at np 493, with a FDP of 21. This SNP was the second-lowest scoring variant in the USR1 VCF. The 35.85% reference allele ratio for USR2 was from the SNP at np 16182, with a FDP of 53. This SNP was the lowest scoring variant in the USR2 VCF, and it is further complicated by the adjacent SNP at 16183; the statistics from the TVC are therefore un-reliable at this locus. Of the 64 called variants in the two samples, only 8 showed reference allele percentages above 5%. Using this metric, the apparent genome-wide contamination rate for both samples is<5%, with expected variation.
Phylogenetic Trees and Coalescence Time Estimates.Two curated lists of previously published whole mtDNA genomes were made, in addition to USR1 and USR2, following manual removal of duplicates and incomplete sequence. For haplogroup C1, 187 C1 sequences included the Asian C1a branch, three Icelandic C1e sequences (33), and one C1f sequence from the Mesolithic UZOO-74 individual (25). A haplotype C4a1a1a from the Teleut
of South Siberia (32) was used as the outgroup, for a total of 189 sequences (Dataset S1). For haplogroup B2, 137 Native Amer-ican B2 sequences, and 8 closely related northern Asian B4b1a3 sequences were included. One haplotype B4d1’2’3 from the Buryats of southern Siberia was used as the outgroup, for a grand total of 147 sequences (Dataset S1).
Initially, a subset of these sequences were selected for an MP tree created using mtPhyl 4.015 (https://sites.google.com/site/
mtphyl/home) and then manually edited for clarity (Fig. 2). Next,
MAFFT (51) was used to align all of the sequences from each list with the highly accurate L-INS-i methodology. Once aligned, nucleotide positions representing C inserts between 303 and 315 (leaving any SNPs at 310), AC indels at 515–523, SNPs at 16182C and 16183C, C inserts between 16184 and 16193 (leaving any SNPs), and SNPs at 16519 were removed from the align-ment. These sites are known mutational hotspots or positions with recurrent sequencing errors (52). An appropriate partitioning scheme was chosen using PartitionFinder (53) with the -raxml option and the three partitions of 1–576, 577–16023, and 16024–16569. The general time-reversible substitution model with invariant sites and a
γ-distribution correction for rate heterogeneity was selected (GTR+ I+Γ), partitioning the two control regions separate from the coding region. ML phylogenetic trees were constructed using RAxML v.8.1.15 (raxmlHPC-PTHREADS-SSE3 -T 16 -f d -m GTRGAMMAI) for 200 iterations (-p‘random’-N 200) and 1,000 nonparametric bootstrap replicates (-p‘random’-b‘random’ -N 1000) (54). Bootstrap support values were written onto the best ML tree (-f b -z RAxML_bootstrap.xxx -t RAxML_bestTree.xxx) and the tree was visualized and formatted with FigTree v1.4.2 (tree.bio.
ed.ac.uk/software/figtree/) (Fig. 3).
ML estimates of coalescence times for the major clades within each of the RAxML trees were calculated with PAML 4.7 (55) using settings that included a global clock, a GTR+Γmutation model (discrete distribution with 32 categories), and option G (the three partitions as above; Malpha=1). Mutational distances were con-verted into years using a corrected molecular clock proposed by ref. 27 or a whole-genome substitution rate of 2.67×10⁻⁸sub per site per year, determined by a Bayesian approach using 10 securely dated ancient mitochondrial genomes (28).
Bayesian estimated coalescence times for the C1 and B2 clades were calculated using BEAST v2.2.1 (29). Tip dates were set at 11,500 y ago for USR1 and USR2, and 8,300 y ago for UZOO-74. For the B2 dataset, two Markov chain-Monte Carlo runs of 40,000,000 generations each, with samples taken every 5,000 generations, were performed. The runs were combined using LogCombiner v2.2.1, with 10% discarded as burn-in, for a final 72,000,000 total generations. We selected the GTR+I+Γ site model, a Coalescent Bayesian Skyline tree prior (three pop-ulations), and a lognormal clockRate prior (M =2.67E-8,S = 1.4). The two control partitions were combined (1–576; 16024– 16569) and the resulting control and coding partitions were linked with a strict clock model and tree model. We used TreeAnnotator v2.2.1 to produce the maximum-clade credibility tree with a posterior probability limit of 60%, and calculated target clade divergence times (node height) 95% HPD intervals from this tree. For the C1 dataset, the same workflow was fol-lowed, except the tree was fixed at the RAxML best tree and the Coalescent Bayesian Skyline tree prior was estimated with five populations.
Authentication of aDNA Work.Pre-PCR work was carried out in a dedicated aDNA facility, physically isolated from any room with post-PCR amplicons, and found in a building where no modern human DNA work has ever been processed. The laboratory is a state-of-the-art cleanroom that consists of one ISO class 7 (Fed class 10,000) gowning area, two ISO class 6 (Fed class 1,000) laboratory spaces, and numerous dedicated laminar flow hoods (ISO class 5/Fed class 100). The entire space is under positive pressure from ceiling mounted HEPA filters, with airflow di-rected from the“cleanest”pre-PCR room to the main extraction room to the gowning room to the outside environment. Room-wide UV lighting provides daily surface/air sterilizations. Upon entering, all personnel must garb in full“tyvek”cleanroom suits, which are subsequently bleached. The active workspaces in the laboratory are bleached and washed as used, with full laboratory cleaning scheduled as necessary.
Sample libraries chosen for the Ion Torrent templating re-action (clonal amplification) were required to have at least an order of magnitude more molecules than either of the library blanks; USR1 and USR2 libraries exceeded that standard (Table S1). Each of the library blanks were created with adapters con-taining all sample barcodes. These custom barcodes had never previously been used in any run on the Ion Proton machine at the core sequencing facility.
All mtDNA haplotypes are known for all laboratory personnel and none match those determined for USR1 or USR2. Addi-tionally, samples containing haplogroups C and B have been analyzed exceedingly rarely in our aDNA facilities and we see no clear contamination source from previously processed samples. The variants posited for URS1 and USR2 do not match our African bait DNA beyond those expected from the human mtDNA tree.
Following the Torrent Suite pipeline, we evaluated the mis-incorporation patterns of the reads mapping from USR1 and USR2. We were unable to observe any putative damage-induced misincorporations on the 3′end of reads as our TMAP alignment allowed 3′ soft-clipping of bases. On the 5′ end of reads, we expected an increase of C-to-T substitutions because of the deamination of cytosine to uracil in single-stranded DNA overhangs (50). Instead, we observed an irregular pattern of misincorporations in both samples (Fig. S2B). Unfortunately, the barcode for USR1 ended in a cytosine and the barcode for USR2 ended in a thymine, exactly the bases involved in typical aDNA damage. The base quality scores on the 5′ends of these reads also showed a drop in quality relative to the remainder of the read, unusual for next generation sequencing. It appeared that this issue was masking any true damage patterns in this region.
Following the alternative bioinformatics pipeline, we were able to minimize the bias from these 5′low quality bases, and reveal true DNA damage patterns at both ends of our sequenced reads (Fig. S4B). Although the 5′ ends still show some non–C-to-T substitutions, and a lower than expected relative frequency of C-to-T substitutions, the expected damage still makes up the majority of substitutions observed. At the 3′ends, we observe the expected rise in G-to-A substitutions, although not as smoothly distributed as some previously reported aDNA samples (48) (Fig. S4B).
1 10 100 1000
0 1000 2000 3000 4000 5000 6000 7000 8000 9000 10000 11000 12000 13000 14000 15000 16000
USR1 coverage (igvtools)
1 10 100 1000
0 1000 2000 3000 4000 5000 6000 7000 8000 9000 10000 11000 12000 13000 14000 15000 16000
USR2 coverage (igvtools)
Fig. S1. Sequence coverage after the Torrent Suite pipeline across the mitochondrial genome for USR1 and USR2 on a 1-base sliding window. TVC FDP depth counts at called deletions.
Single−end read length distribution
Occurences
Read length
10 20 30 40 50 60 70 80 90 100 110 120 130 140 150 160 170 180 190 200 210 220 230 240 250 260 270 280 290 300 310 0
50 100 150 200 250
USR1
(A)
1 2 3 4 5 6 7 8 9 10 11 12 13 14 15 16 17 18 19 20 21 22 23 24 25 0.00
0.05 0.10 0.15 0.20 0.25 0.30
Frequency
(B)
USR2
Single−end read length distribution
Occurences
Read length
16 26 36 46 56 66 76 86 96 106 116 126 136 146 156 166 176 186 196 206 216 226 236 246 256 266 276 286 296 306 0
50 100 150 200 250 300 350
1 2 3 4 5 6 7 8 9 10 11 12 13 14 15 16 17 18 19 20 21 22 23 24 25 0.00
0.05 0.10 0.15 0.20 0.25 0.30
Frequency
Fig. S2. (A) Read-length histograms. (B) Position-specific substitutions from the 5′end of reads post-Torrent Suite pipeline. All graphs produced by MapDamage v2.0.2-12; C-to-T substitutions are shown in red; G-to-A substitutions are shown in blue; insertions are shown in purple; deletions are shown in green; all other substitutions are shown in gray.
1 10 100 1000
0 1000 2000 3000 4000 5000 6000 7000 8000 9000 10000 11000 12000 13000 14000 15000 16000
USR1 coverage (igvtools)
1 10 100 1000
0 1000 2000 3000 4000 5000 6000 7000 8000 9000 10000 11000 12000 13000 14000 15000 16000
USR2 coverage (igvtools)
Fig. S3. Sequence coverage after the alternative pipeline across the mitochondrial genome for USR1 and USR2 on a 1-base sliding window. Coverage across indels are not corrected.
USR1
(A)
(B)
USR2
Single−end read length distribution
Occurences
Read length
29 39 49 59 69 79 89 99 109 119 0
200 400 600
800
Single−end read length distribution
Occurences
Read length
29 39 49 59 69 79 89 99 109 119 129 0
100 200 300 400 500 600 700
1 2 3 4 5 6 7 8 9 10 11 12 13 14 15 16 17 18 19 20 21 22 23 24 25 0.00
0.05 0.10 0.15 0.20 0.25 0.30
Frequency
−25 −24 −23 −22 −21 −20 −19 −18 −17 −16 −15 −14 −13 −12 −11 −10 −9 −8 −7 −6 −5 −4 −3 −2 −1 0.00 0.05 0.10 0.15 0.20 0.25 0.30
1 2 3 4 5 6 7 8 9 10 11 12 13 14 15 16 17 18 19 20 21 22 23 24 25 0.00
0.05 0.10 0.15 0.20 0.25 0.30
Frequency
−24 −23 −22 −21 −20 −19 −18 −17 −16 −15 −14 −13 −12 −11 −10 −9 −8 −7 −6 −5 −4 −3 −2 −1 0.00 0.05 0.10 0.15 0.20 0.25 0.30
Fig. S4. (A) Read-length histograms. (B) Position-specific substitutions from the 5′end of reads (Upper) and 3′end of reads (Lower) following the alternative bio-informatics pipeline. All graphs produced by MapDamage v2.0.2-12; C-to-T substitutions are shown in red; G-to-A substitutions are shown in blue; insertions are shown in purple; deletions are shown in green; all other substitutions are shown in gray.
Fig. S5. Plan view of burial and locations of aDNA samples, FS311 (Individual 1) and FS80 (Individual 2). (Inset) Location of Upward Sun River.
Fig. S6. aDNA samples, FS311 (Individual 1,Left) and FS80 (Individual 2,Right). (Scale bar, 2 cm.)

![Fig. 3.ML phylogenies of (ML clade coalescence times using two alternativemolecular clocks (27, 28) (see text) or using BEAST 2.2(29) [mean (95% HPD interval)] are noted for cladesC1b and B2](https://thumb-us.123doks.com/thumbv2/123dok_us/588478.2058071/4.585.46.364.252.731/phylogenies-clade-coalescence-alternativemolecular-clocks-beast-interval-cladesc.webp)