PhD Dissertation
International Doctorate School in Information and Communication Technologies
DISI-University of Trento
A
DVANCED
M
ETHODS
FOR THE
R
ETRIEVAL OF
G
EO
-/B
IO
-P
HYSICAL
V
ARIABLES
FROM
R
EMOTE
S
ENSING
I
MAGERY
Luca Pasolli
Advisor:
Prof. Lorenzo Bruzzone University of Trento
Abstract
The retrieval of geo-/bio-physical variables from remote sensing imagery is a challenging and important research field. On the one hand, advances in electronics, engineering and space sciences are offering to the users community new sensors capable to acquire information on the Earth surface with higher accuracy and improved features with respect to the past. On the other hand, the need of large-scale, accurate and up-to-date mapping and monitoring of natural targets and physical processes is becoming fundamental for many application domains. This calls for the development of accurate, robust and effective retrieval methodologies.
The main goal of this thesis is to investigate and develop advanced methods and systems for the retrieval of geo-/bio-physical variables from satellite remote sensing imagery being able to exploit the potential of new and upcoming satellite systems and support real application domains. Special attention has been devoted to the definition of methods and to the analysis of data acquired in the challenging mountain environment.
The activity carried out and presented in this dissertation is oriented to investigate the main limitations of the existing methodologies for addressing the estimation problem and to develop novel and improved systems that can overcome the drawbacks identified. In particular, the following main novel contributions are proposed in this thesis:
a) A theoretical and empirical comparative analysis of non-linear machine learning regression methods, namely the Multi-Layer Perceptron Neural Network and the Support Vector Regression, for soil moisture retrieval in different operational scenarios.
e) An empirical study on the effectiveness of fully-polarimetric SAR signals for soil moisture estimation in mountain areas.
f) An improved algorithm for mapping and monitoring Green Area Index (GAI) in Alpine pastures and meadows from satellite MODIS imagery.
Qualitative and quantitative experimental results obtained on real remotely sensed data confirm the effectiveness of the proposed solutions.
Keywords
Acknowledgments
This thesis is the result of more than three years of work. During this chapter of my life I had the opportunity to learn and improve myself from the professional, scientific and personal viewpoints. I had also the chance to meet and know new people, to travel, to present my work in international conferences and workshops and to face new challenges. All these experiences will profoundly an positively affect the rest of my life and for this reason I think it is worh spending few words to say thank you.
Thank you to Claudia and Lorenzo. They believed in me and supported my work since the beginning. Their suggestions, scientific guidance and experience have been foundamental in the past years for developing the research presented in this document. I really appreciated the helpfulness and kindness they always demonstrated to me and I really hope to have the pleasure of continuing this collaboration in the next years.
I would like to thank the European Accademy (EURAC), and in particular the Institute for Applied Remote Sensing under the guidance of Marc, which supported my PhD and provided me this geat opportunity.
A particular and sincere thank to my parents Annamaria and Paolo and to my sister Veronica. They always encouraged and helped me during these (many) years of study. Their unconditioned and total support has been a reference point whatever difficulty and uncertainty I had to face.
Contents
Introduction and Thesis Overview 1
Brief Introduction to Remote Sensing 1
Information Extraction from Remote Sensing Imagery: the Geo-/Bio-Physical
variable retrieval problem 3
The Retrieval Process: a Pattern Recognition Perspective 5
Retrieval Methods 6
Motivations, Objectives and Novel Contributions of the Thesis 9
Structure of the Thesis 13
Comparative Analysis of Non-Linear Machine Learning Regression Methods
for the Retrieval of Soil Moisture in Different Operational Scenarios 15
2.1 Introduction and Motivation 15
2.2 The ε-insensitive Support Vector Regression Technique 18
2.3 Data Set Description and Design of the Experiments 20
2.3.1 Field Measurements 20
2.3.2 Simulated Samples 21
2.3.3 Design of Experiments 22
2.4 Experimental Results 24
2.4.1 Results Scenario 1 25
2.4.2 Results Scenario 2 28
2.5 Discussion and Conclusion 31
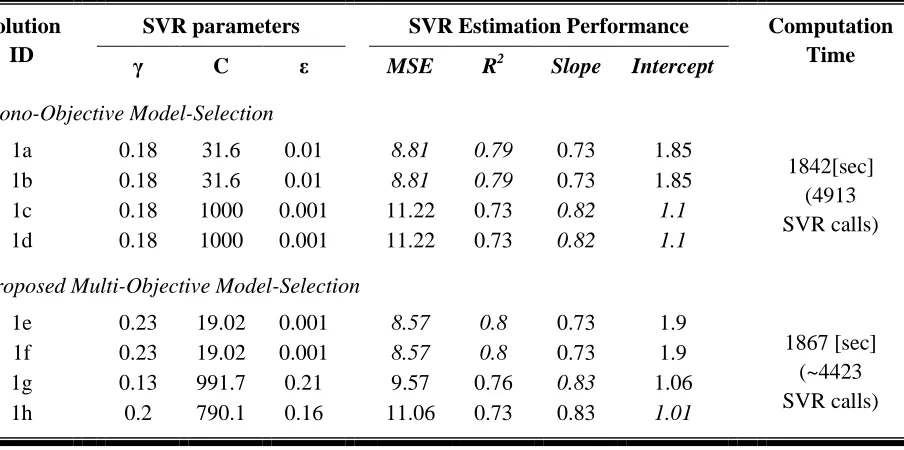
A Novel Multi-Objective Strategy for Tuning the Free Parameters of
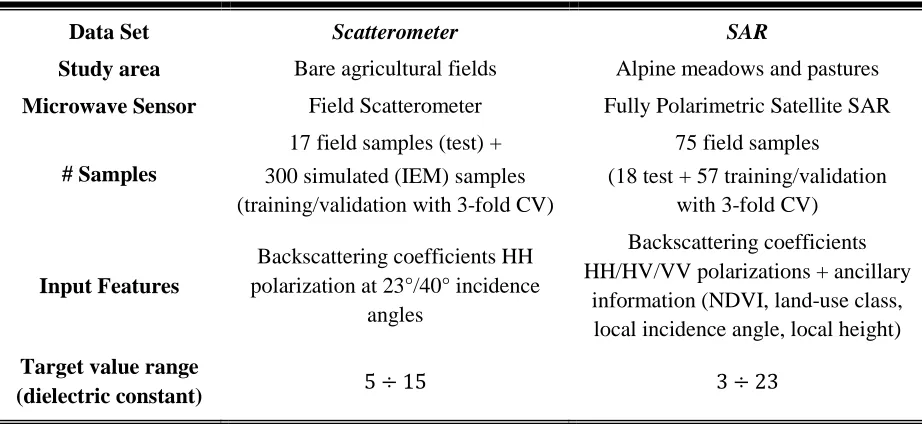
3.3.1 Data Set Description 42
3.3.2 Design of Experiments 44
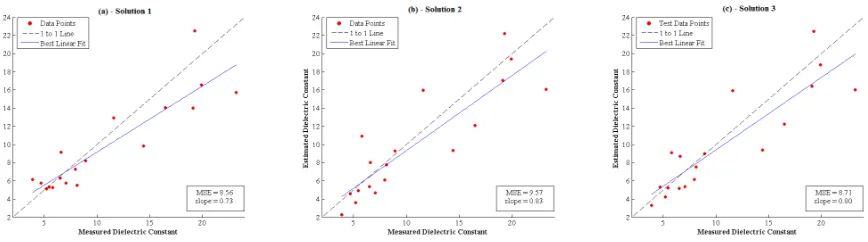
3.3.3 Experiment 1: Model-Selection Using All the Criterion Functions 45 3.3.4 Experiment 2: Model-Selection Using Two Criterion Functions 48
3.4 Discussion and Conclusion 50
ANovel Hybrid Approach to the Retrieval of Geo-/Bio-Physical Variables from
Remote Sensing Data 53
4.1 Introduction and Motivation 53
4.2 Proposed Hybrid Retrieval Approach 56
4.2.1 Global Deviation Bias (GDB) Strategy 57
4.2.2 Local Deviation Bias (LDB) Strategy 57
4.3 Experimental Analysis 60
4.3.1 Data Set Description 60
4.3.2 Design of Experiments 61
4.3.3 Experiment 1: Correction with the Global Deviation Bias (GDB)
Strategy 62
4.3.4 Experiment 2: Correction with the Local Deviation Bias (LDB)
Strategy 64
4.4 Conclusion 67
Retrieval of Soil Moisture Content from New Generation RADARSAT2 SAR
Imagery in an Alpine Catchment 69
5.1 Introduction and Motivation 69
5.2 Study Area and Data Set Description 71
5.2.1 Study Area 71
5.2.2 Satellite Images 72
5.2.3 Field Measurements 74
5.2.4 Ancillary Data 76
5.3 Sensitivity Analysis 76
5.3.1 Effect of Topography 78
5.3.2 Effect of Vegetation/Land-Cover Heterogeneity 79
5.4 Proposed Retrieval System 81
5.5 Retrieval Accuracy Assessment 83
5.5.1 Quantitative Assessment with Point Measurements 83
5.5.2 Qualitative Assessment with Distributed Maps 84
Contents
Effectiveness of Fully-Polarimetric SAR Data for Soil Moisture Retrieval in
Mountain Areas 87
6.1 Introduction and Motivation 87
6.2 Study Area and Data Set 89
6.3 Design of the Experiments 90
6.3.1 Feature Extraction Strategies 90
6.3.2 Experimental Setup 91
6.4 Experimental Results 92
6.4.1 Experiments 1: Intensity & Phase Processing 95 6.4.2 Experiments 2: α/A/H Polarimetric Decomposition 95
6.4.3 Experiments 3: Independent Component Analysis 96
6.4.4 Qualitative Assessment with Soil Moisture Content Maps 96
6.5 Conclusion 98
An Improved Algorithm for the Retrieval of Green Area Index from MODIS
Imagery in Mountain Grasslands in the Alps 101
7.1 Introduction and Motivation 101
7.2 Study Site and Data 105
7.2.1 Satellite Data 106
7.2.2 Ground Measurements 107
7.2.3 Ancillary Data 107
7.3 Methods 108
7.3.1 Reference Spectral Library Generation 109
7.3.2 Inversion Algorithm 114
7.3.3 Data Processing and GAI Map Generation 115
7.3.4 Validation 117
7.4 Results 118
7.4.1 Visual Analysis of Estimated GAI Maps 118
7.4.2 Analysis of Estimated GAI Dynamics 122
7.4.2.1 Temporal Dynamics 122
7.4.2.2 Range Dynamics 122
7.4.3 GAI Accuracy Assessment 125
List of Publications 139
Chapter 1
Introduction and Thesis Overview
In this chapter an overview of the contents of this PhD thesis is given. After a brief introduction on remote sensing systems, the main research topic addressed in this dissertation, i.e. the retrieval of geo-/bio-physical variables, is introduced and the related works in this research field are presented. Then the objectives and motivations of the thesis work as well as the main novel contributions proposed are highlighted. Finally, the structure of the document is illustrated.
Brief Introduction to Remote Sensing
an external illumination source, such as the sun or the target itself. The electromagnetic energy measured by the sensor is divided into a certain number of spectral bands, so that the sensor is called multi-spectral (or hyper-spectral if the number of spectral bands is higher than some tens). The width of each spectral band defines the spectral resolution of the system. Examples are the optical/thermal scanners and the microwave radiometers. Active systems, instead, exploit an artificial source of energy, which is controlled by the sensor. The sensor intrinsically measures: i) the time delay between the emission and return of the energy pulse, to locate the target in space and height; and ii) the power of the received electromagnetic signal, which provides information on the characteristics of the investigated object. Examples of are Radio Detection and Ranging (RADAR) and Light Detection and Ranging (LIDAR) systems, which operate in the microwave and optical domain, respectively. Despite the definition of spectral bands is improper for active sensors, new generation active systems allow the acquisition of multiple information of the scene of interest, e.g., by controlling the polarization or the frequency of the emitted and received electromagnetic signals. With regard to the spatial resolution, defined as the smallest distance between two objects that can be distinguished by the sensor, remote sensing systems can be divided into: very high resolution systems, with resolution in the order or less than one meter; high resolution systems, with resolution of some up to teens of meters; medium resolutions systems, with resolution in the order of hundreds of meters; and low resolutions systems, from several hundreds to some kilometers. Finally, remote sensing systems can be classified according to the revisit frequency, i.e., the minimum time interval that occurs between two consequent acquisitions over the same target area, into: very high revisit frequency systems, with daily acquisition capability; high revisit frequency systems, with acquisition every few days; medium revisit frequency systems, with temporal intervals between consecutive acquisitions of tens of days.
Introduction and Thesis Overview
providing a valuable and unique database of high-resolution and high revisit frequency (1 to 3 days) EO imagery.
Information Extraction from Remote Sensing Imagery:
the Geo-/Bio-Physical Variables Retrieval Problem
The analysis of remote sensing imagery is usually dichotomized into image-centered and
data-centered approaches (Showengerdt, 2007). The former approach refers to the
interpretation of the scene on the basis of the spatial relationships among features on the ground. The information can be extracted from the scene either by an experienced user through photointerpretation or by a computer aided system in a quantitative and objective manner (Richards and Xia, 2006). Typical examples are the identification of land-cover/land-use classes on the ground and the recognition of changes among them. Data-centered approaches perform the analysis of the acquired scene driven by the data, i.e., the physical measurements of emitted and/or scattered/reflected electromagnetic energy. To this type of analysis usually belong intrinsically quantitative tasks, such as the measure of spectral absorption of a target, the estimation of fractional abundances of surface materials and the retrieval of geo-/bio-physical variables. In this dissertation we focus the attention on the last issue.
Geo-/bio-physical variables are continuous attributes that quantify physical and/or structural properties of natural targets. Typical examples are the temperature and the moisture percentage of soil superficial layers, the depth and density of snow packs (which product gives rise to the so called snow water equivalent (SWE)), the concentration of biological particles and chemical pollution in costal sea waters, the amount of leaf covered area per ground unit (the so called leaf area index (LAI)), biomass and leaf bio-chemical constituents of a vegetated target, and many others. Geo-/bio-physical variables are of fundamental importance in several application and research domains. Information on soil moisture content and snow pack parameters (especially wetness and density) revealed to be a crucial support to the forecast of natural risks, such as drought, flooding, landslides and avalanches (Sandholt et
al., 2002; Mätzler, 1987; Perry, 2000; Engman and Gurney, 1991; Hino et al., 1988). Snow
water equivalent provides useful indications for the estimation of water availability for irrigation and hydropower purposes in mountain areas (Baghdadi et al., 1997; Goodison and
such as natural resources management (Bastiaanssen et al., 2005; Hall and Martinec, 1985) and climate changes monitoring (Sellers, 1996; Derksen et al., 1998; Rodriguez-Iturbe et al., 1999). With this regard, several geo-/bio-physical variables have been identified by the Global Climate Observing System (GCOS) as Essential Climate Variables (WWW3) All the aforementioned applications and research domains require spatially and often also temporally distributed measurements of the variables of interest (Schulz et al., 2006). Satellite remote sensing, thanks to its synoptic and regular imaging of the Earth surface, implicitly fulfills these requirements.
From a physical viewpoint, changes in the chemical, physical and structural characteristics of a target (either natural or man-made) determine variations of its electromagnetic response in terms of absorption, emission, transmission and reflection (Schanda, 1986; Slater, 1980;
Ulaby et al., 1986a). The possibility to quantitatively infer the geo-/bio-physical variable of
interest from the measurements performed by a remote sensing sensor is based on this behavior. However, this task is not straightforward for many reasons:
• The complexity and non-linearity that characterize usually the relationship between remote sensing measurements and target variables (Twomey, 1977). On the one hand,
geo-/bio-physical variables may affect to different extents the electromagnetic properties of a target along their range of variability (e.g., saturation and other non-linear effects may occur, (Haboudane et al., 2004). On the other hand, electromagnetic radiation shows a different sensitivity to the different physical phenomena depending on the wavelength of the signal (Ulaby et al., 1986b; Jaquemoud and Baret, 1990;
Verhoef, 1984).
• The ill-posed nature of the retrieval problem. The total electromagnetic response of a
target is typically the result of multiple contributions, each one determined by a different structural, chemical or physical characteristic (Jackson and Schmugge, 1991). This aspect determines to the so-called variable equifinality issue, i.e., the phenomenon whereby similar electromagnetic responses can be associated with different geo-/bio-physical variable configurations (Beven & Freer, 2001; Beven, 2006).
• The image formation process at sensor level. Remote sensing sensors provide a
Introduction and Thesis Overview
• The influence of external disturbing factors. The remote sensing acquisition systems is
not ideal, but affected by disturbing factors such as the noise and non-linearity at sensor level and the presence of the atmosphere. Even if these issues can be determined and corrected to some extent with the help of calibration and atmospheric correction procedures, they may still corrupt the signal measured at sensor level and thus introduce further ambiguity and complexity in the retrieval process (Chen, 1997; Hadjimitsis et
al. 2004).
This list, which is not meant to be exhaustive since many other issues can be encountered when dealing with the geo-/bio-physical variable retrieval in specific application contexts (e.g., the influence of topography in mountain areas), points out the general complexity of the retrieval process. These considerations call for the definition and use of proper methods for processing satellite remote sensing data and retrieve the desired geo-/bio-physical variable.
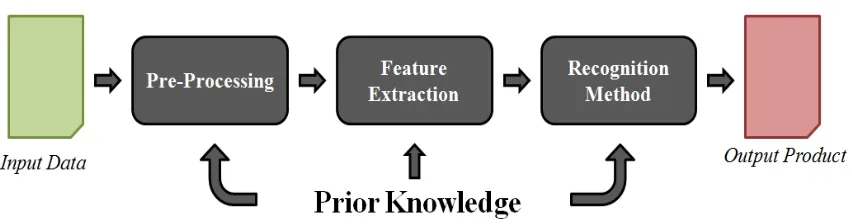
The Retrieval Process: a Pattern Recognition Perspective
Figure 1.1. Block scheme of a general pattern recognition system.
A brief overview of the state-of-the-art methods for data analysis with specific regard to the geo-/bio-physical variables retrieval problem (i.e., the retrieval methods) is provided in the following. With regard to data pre-processing, a comprehensive overview of such techniques is outside the main objective of this dissertation. Indeed, they are typically tailored more to the characteristics of the acquisition sensor considered rather than to the specific pattern recognition task addressed (i.e., the retrieval problem). We refer the reader to (Oliver
and Quegan, 2004; Girard and Girard, 2003) and the introduction of the next chapters of this
thesis for more details on this issue. Retrieval Methods
The retrieval method is the core of a retrieval system. It assumes that the addressed retrieval problem can be expressed in terms of a mapping between a set = , , … , of features extracted from the signals acquired using remote sensors and the desired continuous variable . From an analytical viewpoint, this concept can be expressed as:
= + (1.1)
where denotes the desired and unknown mapping and is a Gaussian random variable with zero mean and unit variance taking into account all the noise contributions affecting the retrieval problem. From the methodological perspective, the retrieval of corresponds to the problem of determining a mapping ′ as close as possible to the true mapping .
In the geo-/bio-physical variable retrieval literature, this task has been addressed mainly following two approaches: i) the derivation of empirical data-driven relationships; and ii) the inversion of physical based analytical models.
The first approach relies on the availability of a set of reference samples, i.e., couples of
in-situ measurements of the desired target variable associated with the corresponding
Introduction and Thesis Overview
the whole satellite image. Examples can be found in studies for the retrieval of vegetation characteristics from optical remote sensing data (Colombo et al. 2003; Heiskanen, 2006) and suspended chemical and biological particles in coastal waters (Teodoro et al., 2007). Analytically more sophisticated parametric functions have been defined when the complexity of the retrieval problem increases. This is the case of the operational SeaWiFS chlorophyll concentration algorithm (O’Relley et al., 1998), were ratios between spectral bands and log-transformations were used to take into consideration the non-linear behavior of the investigated mapping. Empirical relationships are appealing since they are typically fast to derive and quite accurate. Moreover, they abstract complex physical phenomena to a higher level, which can be easily addressed by non-experts without a specific background in the field. The main drawback is the need of a set of possibly well representative reference samples. The collection of ground measurements requires the human intervention and is usually a time-consuming and expensive task. Moreover, errors may occur for various reasons during the measurement process. This aspect affects the quality and quantity of reference samples available. Another important issue is the fact that empirical relationships are typically site and sensor dependent, since derived from samples collected under specific operational conditions. This limits the possibility to extend their use to different areas and different remote sensing systems, since they remain valid only under the conditions in which reference samples have been collected (Colombo et al., 2003; Meroni et al., 2004).
collection of in-situ measurements. For this reason, they are particularly appealing to address the estimation of geo-/bio-physical variables from remote sensing data. A major concern is related to the fact that they rely on hypothesis and assumptions that simplify their representation of real phenomena. This issue is intrinsic in the modelization process and can be reduced (but not completely eliminated) by increasing the complexity of the model, at the price of a reduced generalization ability (Darvishzadeh et al., 2008). Another drawback of electromagnetic models is their high complexity and dependence on a huge number of input parameters. This makes the inversion process often analytically not tractable. To face this problem, many different inversion strategies have been proposed in the literature. The most common ones are: i) iterative search algorithms such as the Nelder-Mead and the Netwon-Rapson methods (Meroni et al., 2004; Paloscia et al., 2008), which iteratively try different model parameter configurations to minimize a dissimilarity measure between simulated and measured electromagnetic response of a target object; ii) look-up table matching, which searches among a set of pre-computed simulated spectra the most similar to the remote measurement (Darvishzadeh et al., 2008); and iii) regression methods, which exploit a set of simulated samples (i.e., couples of target geo-/bio-physical variables and simulated electromagnetic responses) to infer the inverse theoretical mapping (Song et al., 2009).
Introduction and Thesis Overview
investigated. Other interesting examples can be found in the field of vegetation parameters retrieval (Del Frate et al., 2003). Also SVR is becoming popular in the field of geo-/bio-physical variables retrieval, especially in the last few years, despite its use up to now is still limited. Few papers investigated the effectiveness of this method for the retrieval of vegetation characteristics, open water chemical and biological particles concentration and land and sea surface tempearture (Durba et al., 2007, Bruzzone and Melgani, 2005; Moser
and Serpico, 2009). Achieved results point out in general the promising features of this
method, such as the good intrinsic generalization ability and the robustness to noise and limited availability in the reference samples. However, the full potential of the method has not been fully exploited yet.
Objectives, Motivations and Novel Contributions of the Thesis
Despite the strong research effort already demonstrated by the scientific community, the retrieval of geo-/bio-physical variables from remote sensing imagery is a challenging and important research field. On the one hand, advances in electronics, engineering and space sciences are offering to the users community new sensors able to acquire information from the Earth surface with higher accuracy and improved features with respect to the past. On the other hand, the need of large-scale, accurate and up-to-date mapping and monitoring of natural targets and physical processes is growing significantly. This calls for a continuous research and investigations for the development of even more accurate and robust methodologies.
The objective of the thesis is to investigate and develop advanced methods and systems for improving the accuracy and robustness of the retrieval process from satellite remote sensing imagery. The study will be carried out with particular regard to the retrieval of geo-bio-physical variables in the challenging mountain environment. The motivations for the interest in this specific context are mainly the following:
• At the best or our knowledge, the retrieval of geo-/bio-physical variables from satellite remote sensing imagery in mountain areas has been only marginally investigated up to now. Very few studies can be found in the remote sensing literature on this topic (Paloscia et al., 2010; Vescovo and Gianelle, 2008; Heiskanen, 2006). Nonetheless, accurate mapping of geo-/bio-physical properties of the natural targets present in this environment is of utmost importance for many application domains (e.g., risk forecasting, natural resources monitoring) but almost impossible to realize without the synoptic view of remote sensing.
The activity carried out and presented in this dissertation is mainly oriented to investigate some of the limitations of the existing methods for the addressed estimation problem and to develop novel and improved systems that can overcome the identified drawbacks. In particular, the following main novel contributions are proposed in this thesis:
A. A comparative analysis of non-linear machine learning regression methods, namely the Multi-Layer Perceptron Neural Network (MLP-NN) and the Support Vector Regression (SVR), for soil moisture retrieval in different operational scenarios.
Introduction and Thesis Overview
B. A novel multi-objective strategy for tuning the free parameters of non-linear regression methods.
Non-linear machine learning techniques depend on a set of free-parameters which control the learning process of the method and thus have a direct impact on the accuracy and generalization ability of the final estimation system. The tuning of these parameters is thus a major step in the definition of accurate and robust estimation systems. In this thesis, we propose to address this task in the framework of the multi-objective optimization. Two or more metrics that quantify from different and competing perspectives the goodness of a given parameter configuration are taken into account and jointly optimized according to the concept of Pareto optimality (Feldman, 1980). This allows preserving the meaning of each metric involved in the process and deriving multiple optimal solutions to the tuning problem, each one leading to a different optimal trade-off among the metrics. The proposed strategy leads to two main advantages with respect to mono-objective strategies: i) the intrinsic improved robustness and efficiency, since multiple metrics are jointly exploited; and ii) the possibility to select the parameter configuration that shows the desired trade-off among different criteria and thus best meets both the application constraints and the requirements of the specific estimation problem. These features are fundamental for the efficient and effective definition of robust estimation systems.
C.A novel hybrid approach to the retrieval of geo-/bio-physical variables from remote sensing data integrating both theoretical electromagnetic models and field reference measurements.
formulations of the model. This approach is particularly useful for those application domains, such as the soil moisture retrieval, where the limited availability of field reference samples and the spatial and temporal variability of the target geo-/bio-physical variable represent a limitation for the development and applicability of robust and general empirical models.
D.A sensitivity analysis and a retrieval system for soil moisture content estimation from new generation SAR imagery in an Alpine catchment.
Satellite SAR imagery has been widely investigated and exploited for the retrieval of soil biophysical characteristics, in particular soil moisture content, with promising results. However, very limited attention has been devoted to the analysis of mountain areas. The analysis of the SAR signal in this challenging environment is complicated by the effects of vegetation, topography and land-cover heterogeneity. In this thesis, the potential, but also the limitations, of the new generation satellite SAR sensors for the retrieval of soil moisture content in the Alpine area is investigated. The study consists first in a sensitivity analysis aimed at understanding both the sensitivity of the SAR backscattering signal to soil moisture content and the influence on it of the local characteristics of the investigated area in terms of topography, land-cover and status of the vegetation coverage. Then an advanced retrieval system to address the soil moisture retrieval problem tailored to this environment is presented. The proposed system takes advantage from the available ancillary data to disentangle the effects of topography and land-cover heterogeneity on the SAR signal and exploits the methodologies anticipated in the previous points to cope with the complexity of the retrieval process.
E. An empirical study on the effectiveness of fully-polarimetric SAR signals for soil moisture estimation in mountain areas.
Introduction and Thesis Overview
extraction techniques as well as advanced polarimetric decompositions and data driven transformation algorithms. Different combinations of the extracted features are then investigated by providing them as input to the retrieval system and evaluating the resulting soil moisture estimates in terms of quantitative accuracy metrics and spatial patterns consistency. The proposed analysis provides valuable insights about the exploitation of polarimetric SAR signals in mountain areas useful for future studies and for the definition of operational products in similar environmental conditions, as well as for the development of future satellite SAR missions.
F. An improved algorithm for mapping and monitoring Green Area Index (GAI) in Alpine pastures and meadows from satellite MODIS imagery.
Leaf Area Index is one of the most important structural variables of vegetation canopies. The corresponding parameter for fully photo-synthetically active vegetation canopies, such as grasslands, is often referred as Green Area Index (GAI). The synoptic monitoring of this parameter at regional scale is crucial for the understanding of hydrological processes, energy fluxes between the ground surface and the atmosphere, climatic trends and the impact of human activities on them. The retrieval of these variables has been largely addressed with the use of medium resolution satellite data, which have the advantage of being acquired globally, with high repetition rate and on a regular basis. While focusing on the global consistency of the estimates, current products present typically limited accuracy and reliability for specific biomes, such as the Alpine grasslands. To address this issue, this thesis presents an improved algorithm for the retrieval of GAI from moderate resolution satellite MODIS imagery specifically customized for Alpine meadows and pastures. In particular, the main novel aspects of the proposed algorithm, which is based on the inversion of a radiative transfer model, are: i) the improved spatial resolution with respect to the existing operational products; ii) the tuning of the transfer model on the characteristics of Alpine pastures and meadows; and iii) the accounting for the local topographic characteristics. These features open the path for the exploitation of moderate resolution satellite imagery for novel and more accurate monitoring analyses in the challenging mountain environment at regional scale.
Chapters 2 and 3 focus on the use of non-linear machine learning methods for the retrieval of geo-/bio-physical variables from remote sensing data. In particular, Chapter 2 introduces the Support Vector Regression technique in the context of the retrieval of an important environmental variable, i.e., the soil moisture content, from microwave remote sensing data. The chapter discusses its effectiveness in two different operational scenarios in terms of accuracy, generalization ability and ease of use in comparison with the Multi-Layer Perceptron Neural Network, which is considered as a benchmark in this specific field. Chapter 3 deals with the problem of tuning the free parameters of non-linear machine learning methods, which is a crucial task for the achievement of good accuracy and generalization ability from the considered method. The problem is addressed in the framework of the multi-objective optimization according to the concept of Pareto optimality, which allows one deriving multiple optimal trade-off solutions among which selecting the one that best meets the application constraints and requirements.
Chapter 4 deals with the problem of overcoming the dichotomy between physical based and empirical based approaches to the retrieval of geo-/bio-physical variables. To this aim a novel hybrid approach is proposed, which tries to integrate the robustness and generalization ability of the physical based model inversion approach with the information extracted from a set of (few) field reference samples.
The remaining chapters focus the attention on operational estimation scenarios. Chapters 5 and 6 deal indeed with the topic of retrieving soil moisture content from new generation satellite SAR imagery in the complex Alpine environment. Chapter 5 presents a sensitivity analysis of the SAR signal to both soil moisture content and the local characteristics (e.g., topography) of the investigated area. Then it introduces an advanced retrieval system, which benefits from the methodological innovations introduced in the previous chapters and from the availability of ancillary data to deal with the complexity of the retrieval problem. Chapter 6 goes a step further in the analysis by investigating the fully polarimetric capability of the SAR imagery considered. This is done in order to understand the potentialities and the limitations of this advanced acquisition modality of new generation SAR systems with regard to the analysis and mapping of soil variables in the complex mountain environment.
Chapter 7 focuses on the mapping and monitoring of another crucial geo-/bio-physical environmental variable, i.e., the green area index (GAI) of Alpine grasslands. In this context an improved retrieval algorithm is presented, which tries to overcome the main limitations of existing products by increasing the spatial resolution, tuning the retrieval on the spectral characteristics of the target area and accounting in the retrieval process for the local topography of the scene.
Chapter 2
Comparative Analysis of Non-Linear Machine
Learning Regression Methods for the Retrieval of
Soil Moisture Content in Different Operational
Scenarios
This chapter introduces an advanced state-of-the-art non-linear regression method, the Support Vector Regression technique, in the context of the retrieval of an important environmental variable, namely the soil moisture content, from microwave remote sensing data. Its effectiveness is investigated in two different operational scenarios: i) the inversion of an electromagnetic physical model, which guarantees the availability of numerous and well representative reference samples for the training of the method; and ii) the inference of empirical relationships from a limited number of field reference samples. The performance in terms of accuracy, generalization ability and ease of use are discussed in comparison with the Multi-Layer Perceptron Neural Network, which is considered as a benchmark in this specific field. Useful guidelines for building soil moisture estimation processors for upcoming satellite missions or operational near-real-time applications as well are drawn at the end of this analysis.
2.1 Introduction and Motivation
like climate change analysis and meteorology (Bastianseens and Bos, 1999; Sandholt et al.,
2002; Heathmann et al., 2003).
Several techniques have been proposed for in-situ measurements of soil moisture content (Walker et al., 2004). However, field measurements are typically expensive and time demanding. Moreover, they provide point-like information which is difficult to spatialize due to the spatial variability of the soil characteristics. For this reason, the retrieval of soil moisture from remote sensing signals represents an efficient and effective solution to support field measurements. Microwave signals are widely used for this purpose, thanks to their well-established sensitivity to the amount of water in the soil surface (Wang, 1980; Ulaby et al.,
1986b; Ulaby, 1974; Jackson, 1997). However, the complexity and non-linearity of the
retrieval problem as well as the ambiguities that may affect the microwave signal, such as surface roughness and vegetation, make the soil moisture estimation problem particularly challenging (Ulaby et al., 1978; Ulaby et al., 1979; Dobson and Ulaby, 1981; Lakhankar et
al., 2009; Mattia et al., 1997).
For the analysis and characterization of the soil surface, empirical relationships derived from experimental field reference samples were first exploited as proposes by Lin et al. (1994). However, simple parametric function resulted to be inadequate for modelling the complexity of the soil moisture content retrieval. Analytically more sophisticated functions can be instead used, as proposed by Dubois et al. (1995), with encouraging accuracies for the investigated area. Apart from some attempts, however, very limited effort has been put in this kind of approach for addressing the retrieval problem.
Analytical electromagnetic models, on the contrary, have been in use for a long time in this challenging field. In particular the Integral Equation Model (IEM) by Fung et al. (1992) and the emissivity model by Wang and Choudhury (1995) are widely used in the remote sensing community, thanks to their wide range of applicability (in terms of both target properties and system characteristics) and validated behaviour (Fung, 1994). These properties and the solid theoretical foundation make the use of such models particularly appealing in soil moisture estimation from remote sensing data, especially when no (or very limited) field reference samples are available. This condition is quite common in near real time operational conditions. However, electromagnetic may provide a simplified representation of the reality. One of the most critical issues in this regard is the description of the surface morphology. Commonly used parameterizations assume wide-sense stationary statistics across the horizontal plane, which limit in some cases the possibility to completely describe the variability of natural surfaces (Mattia and Le Toan, 1999). Another major issue when using theoretical models, as pointed out in Chapter 1, is their inversion, thus implying the use of advanced (and often computationally demanding) inversion strategies (Bindlish and Barros,
2000; Tabatabaeenejad and Moghaddam, 2009; Oh, 2006).
Comparative Analysis of Non-Linear Regression Methods
retrieval. In particular, such techniques were exploited as an effective solution to address the inversion of electromagnetic models (Del Frate et al., 2003; Notarnicola et al., 2008;
Paloscia et al., 2008). A set of simulated reference samples (i.e., simulated backscattering
coefficients associated with the corresponding soil characteristic variables) is generated exploiting the theoretical model in the forward operational way. These samples are then used to train the ANN method by providing as input the simulated backscattering coefficients and as output the corresponding target variable (e.g., the soil moisture content). A second subset of simulated reference samples is usually exploited for model-selection purposes, i.e., to tune the free-parameters and define the architecture of the network. Once trained, the technique should reproduce the desired mapping, thus can be exploited for estimating the desired target parameter from remote sensing imagery. In the prediction phase, ANNs are typically fast. This feature is particularly appealing in near real time operational conditions or when large amounts of data, such as large satellite scenes, have to be processed. However, the training/tuning process is usually a complex task. Indeed no clear rules are available for the definition of the network architecture (number of hidden layers and nodes). This process has to be carefully controlled, since the method may incur in the so-called over-fitting, the phenomenon whereby the network learns too precisely the training samples losing the ability to correctly predict independent unknown samples. This issue becomes as stronger as smaller is the set of reference samples used in the training phase.
Another promising ML technique is the ε-insensitive Support Vector Regression (SVR) (Vapnik, 1995). Among others, key features of this method are: i) the exploitation of the margin principle; ii) the possibility of solving the learning problem using a convex cost function; and iii) the sparseness of the solution. These characteristics result in a good intrinsic generalization capability and a limited complexity in handling the training phase. Some previous studies have investigated the effectiveness of SVR for the estimation of geo-/bio-physical variables from remotely sensed data, indicating good, competitive results on various application domains with respect to other state-of-the-art methods (Bruzzone and Melgani,
2005; Camp-Valls et al., 2006). However, almost no effort has been devoted to the
investigation and the use of this promising method for the retrieval of soil moisture content, with the exception of the study presented by Ahmad et al. (2010), which however investigates the use of SVR method for soil moisture content retrieval for a coarse scale mapping from low resolution satellite data, thus implicitly neglecting the influence of local scale surface roughness.
1. The assessment of the SVR method in two distinct operational scenarios, namely: i) the inversion of a physical based electromagnetic model, the common operational scenario in this application field, which guarantees the availability of numerous and well representative labelled reference samples; and ii) the inference of an empirical based model from a limited number of labeled reference samples measured in the field. This second scenario is interesting for assessing the generalization capability and robustness of the method in case of limited availability of reference samples
2. The test of different combination of input features, namely microwave signal measurements for different sensor frequency, polarization and acquisition angles. For comparison purposes, a Multi-Layer Perceptron Neural Network, referred as a benchmark in this field, is considered. For both methods, the achieved performance in terms of estimation accuracy, generalization ability, computational complexity and ease of use is thus discussed. The aim is to derive indications about the effectiveness of the investigated methods useful for developing robust and accurate retrieval systems and building soil moisture content processors for the upcoming satellite missions or near real time applications as well.
The rest of the chapter is organized as follows. The next section will introduce the basic principles and the analytical formulation of the ε-insensitive SVR technique, which will be exploited in this and other analysis performed later on in this dissertation. Section 2.3 will describe the data set exploited for the analysis and provide the details of the experimental analysis. Section 2.4 is devoted to the presentation and discussion of the achieved experimental results. Finally, the conclusion of the study will be drawn in Section 2.5.
2.2 The ε-insensitive Support Vector Regression Technique
Given a general retrieval problem (see equation 1.1 in Chapter 1), the goal of the ε-insensitive SVR technique is to find a function f’as smooth as possible that approximates f while keep at most a deviation ε from the target y (Vapnik, 1995). For this purpose, the original m-dimensional input domain is mapped into a space with higher m-dimensionality, where the function underlying the data is supposed to have an increased flatness. Thus f’ is approximated in a linear way:
′ = ∙Φ + (2.1)
where w represents the vector of weights of the linear function, Φ∙ is the mapping that
projects the samples from the original into the higher dimensional feature space and b is the bias.
Comparative Analysis of Non-Linear Regression Methods
quantifies the tolerance to errors, i.e., it allows defining an insensitive tube surrounding the function f’ (thus increasing the robustness of the technique to small errors and to the noise in the training set). Equivalently, the penalty can be expressed by means of non-negative slack variables , ∗ which measure the distance (in the target space) of the training samples lying
outside the ε-insensitive tube from the tube itself. The second term of the cost function is expressed through the Euclidean norm of the weight vector w, which can be inversely related to the geometrical margin of the corresponding solution and thus (under a geometrical interpretation) to the complexity of the model. The cost function to minimize becomes:
, = + ∗ +12
(2.2)
and is subject to the following constraints:
!− # ∙
Φ + $ ≤ & + # ∙Φ + $ − ≤ & + ∗
, ∗ ≥ 0
) * = 1,2,…,+,- (2.3)
C is a regularization parameter that allows one to tune the trade-off between the complexity
(or flatness) of the function f’ and the tolerance to empirical errors.
The constrained optimization problem in (2.2) can be reformulated through a Lagrange functional, which leads in the dual formulation to a convex (easy to handle) quadratic problem (QP) and thus to a unique solution (the global minimum of the cost function). The final prediction function, in terms of the samples in the original input domain, becomes:
′ = . − .∗/, +
∊ (2.4)
Figure 2.1. Example of &-insensitive tube defined by a linear loss
Some attractive features of the SVR result from the analytical formulation presented above: 1. Good intrinsic generalization abi
(which introduces sparseness into the model) and the optimization of both empirical error and model complexity to drive the learning process.
2. Good capability to handle high
from the way in which generalization is controlled during the learning (minimization of both empirical risk and confidence term).
3. Limited complexity and high stability of the learning process
the optimization problem and the use of the kernel trick.
4. Ease of use, since relatively few free parameters (i.e., the regularization coefficient
the width of the insensitive tube
2.3 Data Set Description and Design
2.3.1 Field Measurements
The field measurements considered in this work belong to two
different acquisition campaigns on bare soils. The first one (from this point referred as
ActPass data set) consists of 27 samples acquired by the University of Bern’s researchers in
three bare and essentially smooth fields terms of standard deviation of height remote acquisitions were perf
radiometer/scatterometer operating at different frequencies and incidence angles. insensitive tube defined by a linear loss-function for a one
learning problem.
Some attractive features of the SVR result from the analytical formulation presented above:
Good intrinsic generalization ability, thanks to the use of the ε-insensitive cost function (which introduces sparseness into the model) and the optimization of both empirical error and model complexity to drive the learning process.
Good capability to handle high-dimensional input spaces. This property stems again
from the way in which generalization is controlled during the learning (minimization of both empirical risk and confidence term).
Limited complexity and high stability of the learning process, due to the convexity of
roblem and the use of the kernel trick.
, since relatively few free parameters (i.e., the regularization coefficient the width of the insensitive tube ε and the kernel type and parameters) have to be tuned.
Description and Design of the Experiments
The field measurements considered in this work belong to two data sets associated with two different acquisition campaigns on bare soils. The first one (from this point referred as 27 samples acquired by the University of Bern’s researchers in three bare and essentially smooth fields (Wegmueller et al., 1994). Roughness properties in terms of standard deviation of height s and correlation length l are reported in Table
e acquisitions were performed with a truck-mounted fully scatterometer operating at different frequencies and incidence angles.
function for a one-dimensional
Some attractive features of the SVR result from the analytical formulation presented above: insensitive cost function (which introduces sparseness into the model) and the optimization of both empirical
property stems again from the way in which generalization is controlled during the learning (minimization of
, due to the convexity of
, since relatively few free parameters (i.e., the regularization coefficient C, and the kernel type and parameters) have to be tuned.
Comparative Analysis of Non-Linear Regression Methods
Table 2.1. Main characteristics of the field soil measurements considered in the analysis.
Data Set # of
samples Field Type
Roughness characteristics
(s and l)
Soil moisture characteristics
(SMC)
ActPass 27 Bare or lightly vegetated
0.4cm ≤ s ≤ 1.7cm
2.0cm ≤ l ≤ 5.0cm 6% ≤ SMC ≤ 38%
Scatterometer 17 Bare 1.3cm ≤ s ≤ 2.1cm
5.0cm ≤ l ≤ 13.0cm 8% ≤ SMC ≤ 32%
The use of the same antenna for both active and passive measurements ensured that the two instruments observed the target under almost identical spatial conditions. The ground truth measurements of the volumetric soil moisture content (SMC) (i.e., the average water content of the top 4 cm of the soil) were performed taking 5 soil samples of a known volume and drying them at 105°C according to the guidelines given by Cihlar et al. (1987). The percentage error of the measurements is about 10%. For reasons of homogeneity with the simulated data (described in the next subsection), SMC values were converted into relative dielectric constant (from this point indicated as diel) through a well-known relationship (Hallikainen et al., 1985).
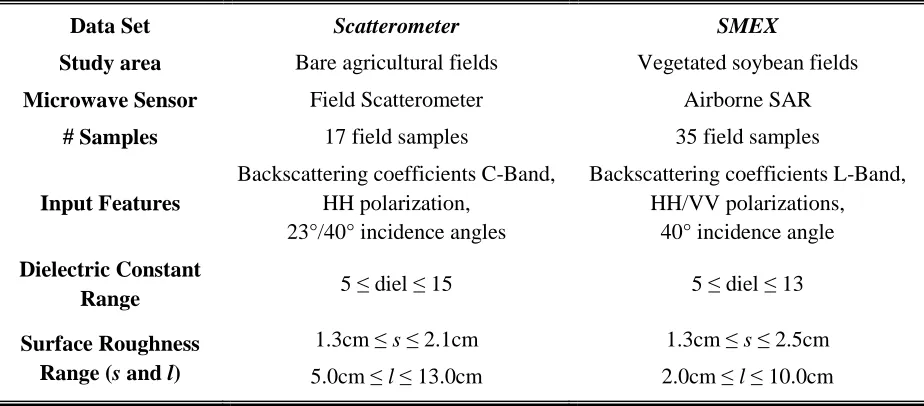
The second data set (indicated as Scatterometer data set) is made up of 17 samples acquired in two bare fields at different times, from 1998 to 2004 (Mattia et al., 2003). For this data set, soil roughness conditions were extremely variable even within the same field, as reported in Table 2.1, due to plowing practice. Remote measurement acquisitions were accomplished with a C-band scatterometer using HH and VV polarizations at 23° and 40° incidence angles, while ground truth measurements of soil moisture content were collected with the same procedure described above (Cihlar et al., 1987). Then soil moisture measurements were converted into relative dielectric constant values.
2.3.2 Simulated Samples
1223 = 4
2 567898:;22< :
∞
6
=<−24>, 0
?! (2.5)
where k is the wavenumber, θ is the incidence angle, 4> = 4 ∙ sin D, 4E = 4 ∙ FGH D, pp refers to the HH or VV polarization states and s is the terrain standard deviation of height. ;22< depends on k, s and the Fresnel coefficients in H and V polarizations. =<−24>, 0 is the
Fourier transform of the n-th power of a predefined surface correlation function, which in this work has been derived according to an exponential correlation function. The exponential function is the most widely used, despite it does not completely describe the variability of natural surfaces (Mattia and Le Toan, 1999)
Concerning the radiometer responses, assuming to consider a simple homogeneous isothermal soil medium with plain air-soil boundary, the brightness temperature of the soil surface can be expressed as:
IJD, K = 92D, KI9223 (2.6)
where T is the soil temperature, θ the incidence angle, p the polarization and 92D, K the soil emissivity, which assumes the following expression according to Wang and Choudhury (1995):
92 = 1 − #1 − LM
N+ LMO$5P6898QR98S (2.7) where MN and MO are the surface reflectivities for the H and V polarization, respectively; a is a mixing polarization parameter depending on the operating frequency and the terrain standard deviation of height s. As for the IEM model, by using this formulation it is possible to derive emissivity values given as input a configuration of the soil and sensor characteristics.
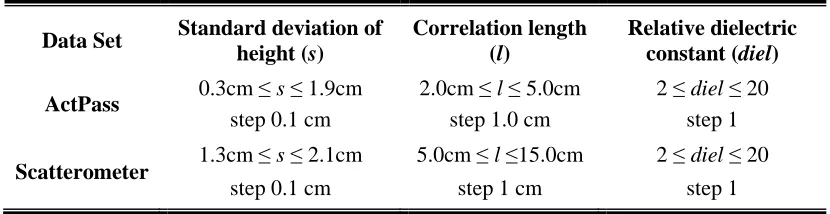
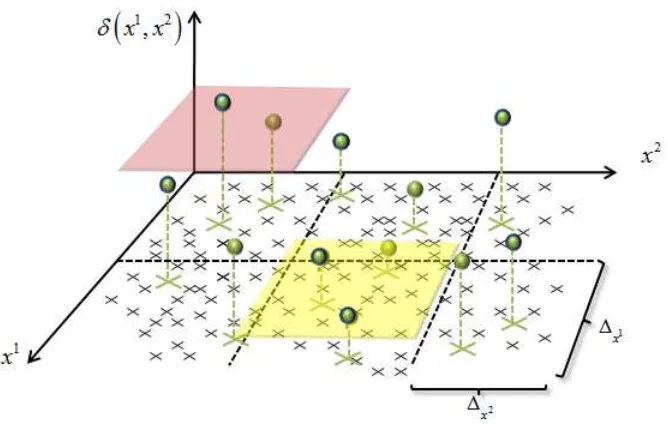
The generation process is performed by considering ranges of soil characteristics (i.e., dielectric constant diel, standard deviation of height s and correlation length l) wider to some extent than those of the field measurements, with the aim to obtain a set of simulated samples capable of representing more general situations. For both ActPass and Scatterometer data sets, more than 1000 samples are generated. A Gaussian noise contribution (estimated on the basis of the real data) is then added to these samples (Notarnicola et al., 2008). Further details on the ranges and settings considered during the model simulations are available in Table 2.2. 2.3.3 Design of Experiments
Comparative Analysis of Non-Linear Regression Methods
Table 2.2. Ranges of soil variables considered for model simulations.
Data Set Standard deviation of height (s)
Correlation length (l)
Relative dielectric constant (diel)
ActPass 0.3cm ≤ s ≤ 1.9cm
step 0.1 cm
2.0cm ≤ l ≤ 5.0cm step 1.0 cm
2 ≤ diel ≤ 20 step 1
Scatterometer 1.3cm ≤ s ≤ 2.1cm
step 0.1 cm
5.0cm ≤ l ≤15.0cm
step 1 cm
2 ≤ diel ≤ 20
step 1
1. Scenario 1: inversion of a physical based electromagnetic model. The regression
method is exploited for approximating the inverse theoretical mapping between electromagnetic measurements and soil variables. To this aim, the following procedure is adopted. The samples simulated according to the IEM and Wang models are randomly divided into two equally sized subsets, i.e., training and validation sets. The first one is used for the training of the estimator, while the second one is used for model-selection purposes. Different configurations of the free parameters, defined according to a pre-defined grid, are tested and the one which provides the best performance on the validation samples is selected. Finally, the regressor is assessed using the field measurements.
2. Scenario 2: inference of an empirical based mapping. In this operational condition, both
training/tuning and performance assessment of the method are done using field measurements. Due to the limited number of field measurements available, a cross-validation scheme has been adopted (Cherkassky and Mulier, 1998). The rationale behind this approach is to split the available samples into t subsets; (t-1) are used for the training/tuning the regression technique, which accuracy is assessed on the remaining subset. The procedure is iterated t times, each time changing the configuration of reference and test sets. At the end, all samples are considered as test.
In both scenarios, various combinations of active and/or passive microwave measurements with the following sensor and acquisition geometry configurations are considered:
• ActPass data set:
• Scatterometer data set:
a) Backscattering coefficient polarizations HH VV at 23° incidence angle (indicated as Scatterometer HHVV 23°).
b) Backscattering coefficient polarizations HH VV at 23° and 40° incidence angles (indicated as Scatterometer HHVV 23°/40°).
The aim is to investigate whether and to what extend different input features affect the estimation accuracy of the considered estimation technique and if the choice of these features depends on the operational scenario. These configurations are motivated by: i) similarities to the acquisition modes of operational microwave remote sensing systems; and ii) continuity with previous research published in the literature (Notarnicola et al., 2008).
Concerning the SVR technique set-up, the LIBSVM software (Chang and Lin, 2011) is used for all the experiments. A Gaussian RBF kernel is adopted thanks to the limited computational overhead and the good performance achieved in previous analyses (Bruzzone
and Melgani, 2005). The ranges of the free parameters are #105T; 10T$ for γ (the RBF kernel width) and C, respectively; #105P; 10$ for ε. With regard to the MLP Neural Network, the Matlab “Neural Network Toolbox” is used. We refer to that Notarnicola et al. (2008) for details on the MLP-NN implementation and tuning.
2.4 Experimental Results
The estimation accuracy of the investigated SVR technique is evaluated on the set of test samples according to two figures of merit, namely the mean squared error (MSE) and the mean relative error (MRE), defined as follows:
WXY =+1
,Z9, [\*] − \^]_ ` abca
(2.8)
WdY =+1
,Z9,
:\*]− \^]_ : \*] abca
(2.9)
Comparative Analysis of Non-Linear Regression Methods
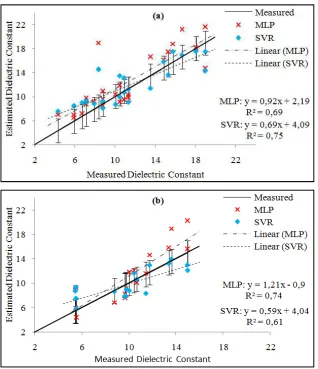
2.4.1 Results: Scenario 1
The results achieved in terms of mean estimation errors in the first scenario investigated are reported in Table 2.3. Considering the whole range of variability of the target parameter, SVR achieves better accuracy than MLP for both data sets and for all the input feature configurations, with the exception of the MRE value in the case of the ActPass
HHVV4.6-HV4.6 configuration. These results suggest that the SVR technique has a better generalization
ability than the MLP NN does, i.e., a better capability to learn a mapping that provides higher accuracy in the prediction of unknown real samples. This capability stems from the use of the ε-insensitive cost function and the optimization of both empirical and structural risks during the training phase.
Analyzing in more detail the results achieved by varying the configurations of sensor type, acquisition geometry and mode, a general tendency to improve the estimation accuracy by increasing and diversifying the information given as input to the SVR technique is observed. This effect can be seen also with the MLP NN. Both methods achieve the highest accuracy (in terms of MSE) when two polarizations (HHVV4.6-HV4.6) and two acquisition angles (HHVV
23°/40°) are provided in input for the ActPass and Scatterometer data sets, respectively. MRE
values confirm this trend in the case of the MLP NN, while are almost constant in the case of the SVR. The improvement in estimation accuracy is mainly for values of dielectric constant lower than 10. This effect can be explained by the fact that differences in the signal acquired by the remote sensor among polarizations or acquisition angles are stronger for dry soils than for wet soils. The use of additional features helps the estimation technique to disentangle the ambiguity (greater for dry soils than for wet soils) introduced by soil roughness into microwave signals. However, while MLP shows a degrade in the estimation accuracy for high soil moisture content values by increasing the number of features provided in input, SVR maintains similar performance in this operating range for all the different configurations considered. This observation points out that the SVR method has a better capability to exploit the information provided by the additional input features and has higher robustness to the noise associated with additional input channels/acquisition angles.
measurements). This suggests that SVR, especially in the presence of noisy and ambiguous input samples, is prone to learn a mapping with a flatter behaviour, which provides estimates with a reduced error, at the price of a reduced dynamic range of the output values at the extremes. In contrast, MLP shows the capability to cover the whole range of output values, but this leads to higher average inaccuracies in the output. Concerning the determination coefficient R2, SVR does not always provide the highest values despite providing the highest estimation accuracy in terms of mean errors. This behaviour was also observed in the case of the Scatterometer data set, characterized by a higher ambiguity. Thus different quality metrics may sometimes provide competing indications about the quality of the estimates of a regression technique. This aspect may become critical when dealing with the model-selection issue in real operational conditions.
Figure 2.2. Scatter-plots of estimated versus measured dielectric constant values for Scenario 1 experiments: (a) ActPass HHVV4.6-HV4.6 configuration; and (b) Scatterometer HHVV 23°/40°
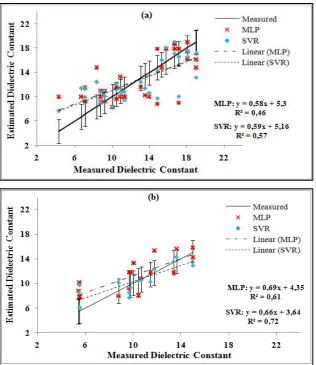
2.4.2 Results: Scenario 2
Numerical performance achieved in the second scenario is reported in Table 2.4. SVR technique achieves better estimation accuracies with respect to MLP with both ActPass and
Scatterometer data sets according to all the considered figures of merit. For some
configurations, such as the ActPass HHVV4.6-HV4.6 and the Scatterometer HHVV 23°, the difference between the two techniques is rather high. A more detailed analysis of the different figures of merit suggests that SVR is more robust with respect to MLP. The second one shows an unexpected degrade of the estimation accuracy for one configuration (i.e., the ActPass
HHVV4.6-HV4.6 configuration), while SVR is able to achieve good accuracies also in this
case. It is worth noting that in this case one out-of-range estimate has been excluded from the computation of the figures of merit associated with the MLP regressor, thus indicating the difficulty of this technique to proper control the range of variability of the output estimates. This behaviour can be ascribed to the limited availability of training samples that characterize this scenario. Indeed, in this operative condition neural networks may be more affected by the problem of under-fitting/over-fitting. Moreover, the limited number of samples available for the tuning of the network connection weights makes this process instable and affected by the specific choice of the initial configuration (typically random).
A comparison of the results reported in Table 2.4 with those of the previous scenario (Table 2.3) indicates that for the ActPass data set the accuracies are worse to some extent, while for the Scatterometer data sets the accuracies are in general higher. In the first case, the trend is expected, due to the smaller number of training samples that characterize this operational scenario. In the second case the observed trend can be due to the high variability and high range of the roughness condition, close to the limit of validity of the IEM model.
Comparative Analysis of Non-Linear Regression Methods
diversified or additional input features can improve the estimation process, but to a less extent with respect to the first operational scenario. This effect can be due to: i) the noise associated to the additional features considered, that may introduce further ambiguity in the small reference set, and ii) the increased complexity of the estimation problem when the number of input features increases. SVR showed to be robust and effective also in this complex operational scenario.
Figure 2.3. Scatter-plots of estimated versus measured dielectric constant values for Scenario 2 experiments: (a) ActPass HH4.6-H2.5 configuration; and (b) Scatterometer HHVV 23°/40°
Comparative Analysis of Non-Linear Regression Methods
2.5 Discussion and Conclusion
This chapter introduced the use of the ε-insensitive Support Vector Regression technique to address the challenging problem of soil moisture estimation at field/basin scale on bare soils from microwave remotely sensed data. More in detail, two distinct operational scenarios were investigated: i) the inversion of a theoretical based electromagnetic model; and ii) the inference of an empirical based mapping from few field measurements. The analysis of the results obtained confirmed the good theoretical features of the SVR method and its effectiveness for the considered estimation problem. In this framework, the SVR is a valid alternative to the more traditional MLP NN regression method since: i) it provided in general greater (or comparable) estimation accuracies; ii) it was more stable and robust to the outliers and noise present in the data; and iii) despite having similar computational complexity in the prediction phase, it was easier to handle (no architecture has to be defined) and faster to train. In particular, from the computational viewpoint SVR showed a significant reduction (on average, equal to about three orders of magnitude with respect to the MLP method) in the computation time required for the training phase. The difference can be explained by the fact that MLP requires the definition of the network architecture (typically addressed with a trial-and-error strategy) and has a learning strategy that should take into account the presence of many local minima in the cost function. In contrast, SVR takes advantage of the convex form of the cost function and simply requires the tuning of relatively few free parameters. All of these characteristics are of great importance in real operational scenarios and in the evaluation of effective soil moisture content processors for near real-time or large scale estimations.
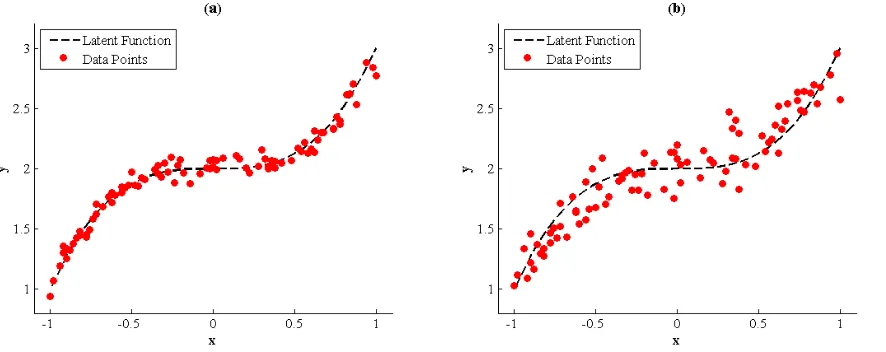
Chapter 3
A Novel Multi-Objective Strategy for Tuning the
Free Parameters of Non-Linear Regression Methods
This chapter deals with the tuning of the free parameters of non-linear regression methods for the retrieval of geo-/bio-physical variables from remote sensing data. We propose to address this task in the framework of the multi-objective optimization, in which a set of two or more metrics are jointly optimized according to the concept of Pareto optimality. The formulation of the proposed strategy is presented with the help of a synthetic data set. Then its effectiveness for tuning the free parameters of the SVR techniqu