Dividend Policy and Corporate Governance Perspective
Salman Riaz1, Yanping Liu2 & Muhammad Ishfaq Ahmad3 1
Xidian University, China
2 Professor of Finance, Chief Financial Officer, Xidian University 3
Liaoning Technology University, China
Correspondence: Salman Riaz, Xidian University, China
Received: June 18, 2016 Accepted: July 7, 2016 Online Published: July 12, 2016
doi:10.5430/afr.v5n3p77 URL: http://dx.doi.org/10.5430/afr.v5n3p77
Abstract
This study examines the influence of corporate governance (Board Size, Board Independence and Board Meetings) and dividend policies of the Pakistani firms. The study covers four important sectors i.e. Cement, Textile, Banks and Sugar of the economy for the time span of 2009 to 2015. By employing the regression analysis, we found that Board size and Board independence does matters significantly for the divided policies of the firm. We also observed that CEO ownership has significant negative influence on the dividend payout ratio of the firm due to entrepreneurial effect. Furthermore in the ownership effect, we found that foreign ownership of the firm has positive influence on the dividend payout ratio of the firms.
Keywords: Dividends, Board size, CEO Ownership and Foreign Ownership
1. Introduction
Company earns the profit to distribute among shareholder either on annually basis, seminally basis or quarterly basis or no dividend, it depends upon the company management decisions. It is wholly dependent upon the management of the company. Dividend is known as puzzle in the field of finance for more than half a century. Starting from the Modigliani and Miller (1959, 1963) debate on the dividend relevance to the firms performance, various arguments have been offered in the relevance of dividends to the firm performance and lack of relevance too. But there is still debate among the researchers.
Modigliani and Miller (MM) argued under the perfect market where there are no taxes, no transaction cost, dividend policy has been argued irrelevance to the firm’s performance. In opposed to Modigliani and Miller (MM) subsequent research concludes that transactions cost, taxes and information asymmetry matters for the dividend policy. Trade off theory, agency cost theory and signaling theories are also offered to explain this puzzle little bit more clearly. The trade off theory consider taxes (Personal and corporate) and explains that when dividends are taxed at different level then the amount of dividend is paid in a line that investors benefits get better. The signaling theory says that firms pay dividends without considering cost in a situation when they realized that there is information asymmetry between the investors and managers. (Jensen, 1986) argue that once there is conflict between managers and investors, firms may pay dividends and gained the disciplinary value to the firm. Easterbrook, 1984 argue that paying dividend could also help the firms for future funding because of the investors special monitoring.
2. Literature Review
The value of a firm is affected by many factors. One of the most important factors that can affect the value of a company is its degree of competitiveness and the availability of a healthy corporate governance (Raisi, 2015). Good governance and ownership structure may be helpful to reduce the agency conflicts and positively influence the firm’s value (Berle and Means, 1932, Crutchley and Hansen, 1989). As board of directors are the formal representative of the shareholders, so they can play vital role to mitigate the agency conflicts. Gompers, Ishi and Metrick (2003) made the causal relationship between the governance and firm’s financial policies. Corporate governance matters for the dividend policies of the firms. In the literature dividend behavior is used as the outcome of the governance (see La Porta, Lopez-de-Silanes, Shleifer&Vishny, (2000); Faccio et al., (2001)).Haiyan Zhang examined corporate governance and dividend payout for Chinese firms. He concluded that Mainland-listed firms with combined title of CEO and board chair tend to pay lower cash dividends, but there is no such evidence for HK-listed firms. Similarly Almeida et al. (2011) describe a theoretical framework and an anecdotal example that show firms with good governance have higher value and better payout ratio as compared to poor governance firms. Faccio et al., (2001) document that when there are multiple large shareholder dividend payout ratios are higher in Europe while lower in Asia. The standard of corporate governance and investor protection are lower in south Asian countries and compared to the US and Japan document by (La Porta et al., 1998). Morck et al., (2000) examined the Japanese market and document the positive relationship between managerial ownership and firm value. The relationship between dividend payout and firm performance has been studied extensively in the literature and has mixed result.
Ajanthan (2012) study the relationship between the board independence and dividend policy for the Sri Lanka hotel industry, and conclude that there is statistically significant relationship between the board independence and dividend payout ratio. Mansourinia et al. (2013) argued that there is no significant relationship between the board independence and dividend payout ratio. There is significant and positive relationship exists between board independence and dividend payout ratio among the Egyptian companies empirically argued by Abor and Fiador (2013), and Afzal and Sehrish (2011).
Some economists argued that whenever firms paid dividend their share prices goes up.Some of them argue that with t he current dividend policy we could not perdict the future ernings of the firm.Gordon and Lintner (1962) suggest that increase of dividend payout ratio impact on return on equity and investor less certain capital gain. Lintner's (1956) explain that the dividend policy influences opportunities, profitability and growth of the firm. Lintner's (1956) document that mangerreluctant to cut dividends when they are not confident that the firm value will improve. Watts (1973) used dividends to measure the future earning and document the positive relationship but that relationship is small. Aharony and Dotan's (1994) examined the unexpected change in dividends resulted unexpected increase in the firm value as compared to those who did not change the dividends. Meanwhile DeAngelo et al. (1996), Benartzi et al. (1997) studied large sample of 1025 and find insignificant earning growth following dividend increase.
Cruchley and Hansen (1989) study the ownership, dividend policy and leverage and empirically prove that manger use financial theory as a tradeoff to manage the agency costs. Ownership is a critical measure of the dividend policy argued by the Kumar (2006). The dividend policy is not uniform across different industries. There is no influence of the size of the firm and its industry on the dividend policy Florence (1959). Meanwhile Michel (1979) and Baker (1988) show the positive relationship between the industry classification and dividend policy. In the same line with Meanwhile Michel industry type does matter for the dividend policy of the firms. Gill et al. (2010) that dividends determinants are industry specific. Coulton and Ruddock (2009) concludes that the firms paying dividend in Australia are larger in size, profitable and do not have enough investment opportunities as compared to firms that did not pay dividends. There is a association between growth, profitability, risk and dividend policy (Rozeff, 1982, Farinha, 2003 and Da Silva et al., 2004).
3. Data and Methodology
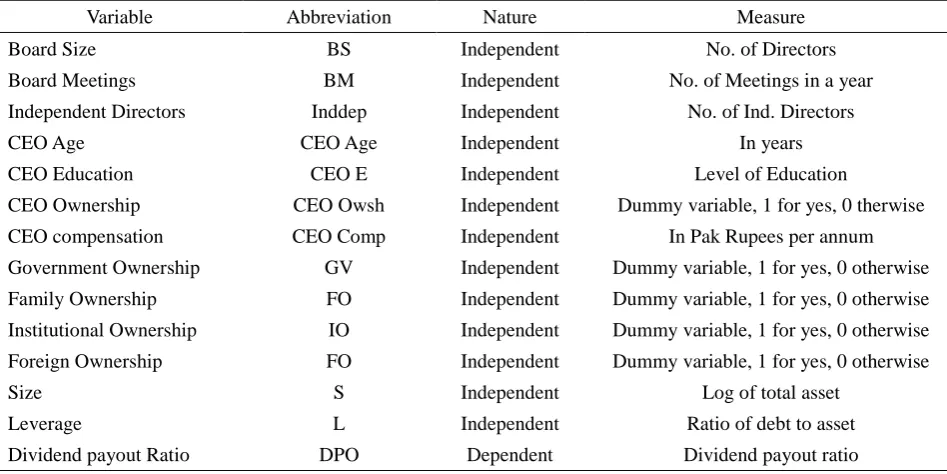
Table 1. Variable Description
Variable Abbreviation Nature Measure
Board Size BS Independent No. of Directors
Board Meetings BM Independent No. of Meetings in a year
Independent Directors Inddep Independent No. of Ind. Directors
CEO Age CEO Age Independent In years
CEO Education CEO E Independent Level of Education
CEO Ownership CEO Owsh Independent Dummy variable, 1 for yes, 0 therwise
CEO compensation CEO Comp Independent In Pak Rupees per annum
Government Ownership GV Independent Dummy variable, 1 for yes, 0 otherwise
Family Ownership FO Independent Dummy variable, 1 for yes, 0 otherwise
Institutional Ownership IO Independent Dummy variable, 1 for yes, 0 otherwise
Foreign Ownership FO Independent Dummy variable, 1 for yes, 0 otherwise
Size S Independent Log of total asset
Leverage L Independent Ratio of debt to asset
Dividend payout Ratio DPO Dependent Dividend payout ratio
3.1 Following Econometrics Models are Regressed
For this study, multiple regression model is applied to estimate the impact of different corporate governance settings such as board charateristics, ownership structure and COE characteristics. A linear regression has applied on the below mentioned model. The key assumptions of linear regression has also tested to ensure the reliability of results.
DPO=α + β1BS+β2 BM+β3 Inddp+β4S+β5L +∊
DPO=α +β1CEOE+ β2 + CEOOWSH+β3CEOA+β4CEOCOM+β5S+β6L +∊
DPO=α +β1FO+β2GO+β3IO+β4FO+β5IO+β6S+β7L +∊
DPO=α+β1BS+β2BM+β3Inddp+β4CEOE+β5CEOOWSH+β6CEOA+β7CEOCOM+β8FO+β9GO+β10IO+β11FO+β12S
+β13L +∊
3.2 Sector Wise Analysis
3.2.1 Cement Sector
DPOC=α1 + β1BSC+β2 BMC+β3 InddpC+β4SC+β5LC +∊
DPOC=α1 +β1CEOEC+β2 CEOOWSHC+β3CEOAC+β4CEOCOMC+β5SC+β6LC +∊
DPCO=α1+β1BSC+β2BMC+β3InddpC+β4CEOEC+β5CEOOWSHC+β6CEOAC+β7CEOCOMC+β8FOC+β9GO C+β10IOC+β11FOC +β12SC+β13LC +∊
3.2.2 Textile Sector
DPOT=α1 + β1BST+β2 BMT+β3 InddpT+β4ST+β5LT +∊
DPOT=α1 +β1TCEOE+β2 CEOOWSHT+β3CEOAT+β4CEOCOMT+β5ST+β6L T+∊
DPOT=α1+β1BST+β2BMT+β3InddpT+β4CEOET+β5CEOOWSHT+β6CEOAT+β7CEOCOMT+β8FOT+β9GOT+ β10IOT+β11FOT+ β12ST+β13LT +∊
3.2.3 Banking Sector
DPOB=α1 + β1BSB+β2 BMB+β3 InddpB+β4SB+β5LB +∊
DPOS=α1 +β1CEOES+β2 CEOOWSHS+β3CEOAS+β4CEOCOMS+β5SS+β6LS +∊
DPOS=α1 + β1BSS+β2 BMS+β3 InddpS+β4CEOES+β5 CEOOWSHSβ6CEOAS+β7CEOCOMS +β8FOS+β9GOS+β10IOS+β11FOS+ β12SS+β13LS +∊
4. Results and Discussion
Table 2. Descriptive Statistics
Sr# Variable Obs Mean Std. Dev Min Max
1 BS 1049 7.65205 1.0647 4 12
2 BM 999 1.053053 0.224252 1 2
3 DD 1064 2.306391 1.195837 1 7
4 Indd 1064 5.679511 1.666931 1 11
5 CEOE 1064 4.227444 0.447591 3 6
6 CEO Ownership 1043 0.476016 0.477998 0 1
7 CEO Age 1064 44.82237 7.859384 32 69
8 CEO Compensation* 1064 13500.96 22064.89 0 145531
9 Family Ownership 1064 0.988722 0.105648 0 1
10 Government Ownership 1064 0.981203 0.135871 0 1
11 Institutional Ownership 1064 0.963346 0.188 0 1
12 Individual Ownership 1064 0.970865 0.168265 0 1
Note: * Pak Rupees in thousand per year.
Without any industry specific , if we see overall descriptive statistics of the studied variables, we see that on average the board size is about 7 which is good enough not big or small. Average board meetings is almost 1 which is alarming here as in one year there is only one meeting. There could be more than one reasons as might be members are so busy that they could not afford number of meetings in one year but it would be definitely influence the financial decisions. The average ratio of the independent directors is quite satisfactory that is 5. The average ownership of the CEO is about 47 percent that is quite high and interesting as it could influence the decisions of the company and the chances of the agency conflicts apparently are high. (see table 2)
4.1 Regression Analysis
4.1.1 Overall Payout Ratio Irrespective to Industry
DPO=α1 + β1BS+β2 BM+β3 Inddp+β4S+β5L +∊
DPO=α1 +β1CEOE+β2 + CEOOWSH+β3CEOA+β4CEOCOM+β5S+β6L +∊
DPO=α1 +β1FO+β2GO+β3IO+β4FO+β5IO+β6S+β7L +∊
DPO=α1 + β1BS+β2 BM+β3 Inddp+β4CEOE+β5 +
Table 3. Regression Results of Overall & Dividend Payout Ratio
Variables Model 1 Model 2 Model 3 Model 4
Constant -0.085 -0.780 -0.455 -1.081
BS 0.038** (0.010) 0.034**
(0.025)
BM 0.109*
(0.052)
0.148**
(0.018)
INDDP 0.011**
(0.007)
0.0113
(0.134)
CEO ONWERSHIP -0.068*
(0.025)
-0.0599**
(0.023)
CEOE 0.052*
(0.080)
0.046
(0.128)
CEO AGE 0.002***
(0.001)
0.002
(0.151)
CEO COMPENSATION 0.0288**
(0.010)
0.00
(0.247)
Family Ownership 0.218
(0.184)
0.246
(0.134)
Government Ownership -0.106
(0.415)
-0.208
(0.115)
Institutional Ownership 0.227**
(0.011)
0.287***
(0.002)
Foreign Ownership 0.203***
(0.000)
0.147***
(0.005)
Individual Ownership -0.199**
(0.049)
-0.155
(0.128)
Size 0.019**
(0.010) 0.005** (0.012) 0.006** (0.011) 0.004 (0.725)
LEVA -0.018*
(0.020) -0.020** (0.020) -0.0153** (0.021) -0.0169 (0.415)
Total Obs 807 827 827 807
Prob> F 0.00 0.00 0.00 0.00
R2 0.092 0.102 0.113 0.148
Note: *, ** and *** Significant level 10%, 5% and 1% respectively.
In model 3, we regress the ownership characteristics and dividend payout ratio. The overall model is significant with 11% explanatory power. It is observed that the institutional and foreign ownership have a positive and significant influence on dividend payout ratio. However, There is a negative and significant effect of individual ownership found on dividend payout ratio. Further, the family and government ownership have no impact on dividend policy.
In the final model, we regress all three factors, such as board characteristics, COE characteristics and ownership structure with dividend payout ratio. The overall model is significant and has 14.8% R-square. The results of other factors have also not changed much as compared with individual models results. This shows the robustness of the results as well. (see table 3)
4.2 Sector Wise Analysis
We employ the sector wise analysis for the studied variables. Sector wise analysis includes growing and sound sectors of the Pakistani economy like Cement Sector, Textile Sector, Banking Sector and Sugar sector.
4.2.1 Cement Sector
Table 4. Regression Results of Cement Corporate Governance & Dividend Payout Ratio
Variables Model 1 Model 2 Model 3
Constant 1.726 1.751 0.895
BS 0.030
(0.617)
.0168
(.785)
INDDP 0.0901**
(0.028)
.0942**
(.024)
CEO ONWERSHIP
-.420**
(.029)
CEOE -.230**
(0.046)
CEO AGE .003
(.658)
.006
(.427)
CEO COMPENSATION .107
(.311)
.0679
(.507)
Size -0.052
(0.404)
-.054
(.413)
-.0636
(.317)
LEVA -0.533***
(0.003)
-.443**
(.014)
-.4836***
(.008)
Total Obs 139 139 139
Prob> F 0.002 0.009 0.004
R2 0.130 .130 .141
Note: *, ** and *** Significant level 10%, 5% and 1% respectively.
The cement sector is one of the important sectors of the Pakistani economy. It share respectable contribution in the total GDP of the economy. In model one in which we regress the board characteristics and Dividend payout ratio of the sector, we found that board independence has significant positive influence on the financial policy of the sector i.e.(0.0901, 0.028). It means that higher independence of the board generated good profits that resulted in the form of good dividends that are in the same line as Gugler and Yurtoglu (2003).
positively but insignificant.
In the final model, we regress both the board characteristics and CEO characteristics; we found that board independence still remains positively significant while board size is positive but insignificant. More interestingly the CEO characteristics do not have so much importance while we regress along with the corporate governance variables and all variables get insignificant. (see table 4)
4.2.2 Textile Sector
Although textile sector of the Pakistan suffers from the energy crisis, but the importance of this sector in the economy could not be ignored. Energy crisis hurt textile sector badly but it is rising up again and contributing the respectable share in the economy.
Table 5. Regression Results of Textile Corporate Governance & Dividend Payout Ratio
Variables Model 1 Model 2 Model 3
Constant -393 -1.078 -.704
BS 0.0211
(0.216)
.015
(.348)
INDDP 0.000
(0.962)
.003
(.619)
CEO ONWERSHIP -.0713***
(.005)
CEOE .125***
(.000)
CEO AGE .004**
(.022)
.006***
(.002)
CEO COMPENSATION .038***
(.000)
.0297
(.581)
Size 0.009
(0.378)
-0.003
(.779)
-.006
(.581)
LEVA 0.006
(0.813)
.008
(.748)
0.0116
(.662)
Total Obs 531 531 531
Prob> F 0.000 0.000 0.000
R2 0.041 .089 .066
Note: *, ** and *** Significant level 10%, 5% and 1% respectively
Similar with the previous sector, in model one we test how the corporate governance variables board size, number of meetings and board independence impact the dividend policy of the textile industry of the Pakistan. we find that the board characteristics does not matters for the dividend policy of the textile sector might be this sector hurt badly not because of the governance issues but through the macro factors especially the energy crisis in the country.
In the second model we regress the dividend payout with the CEO characteristics and found that CEO ownership does negatively influence the dividend policy of the firms as (-0.0713,0.005) while the CEO age and compensation influence significantly and positively.
First model regarding the board characteristics and dividend payout ratio carries the good R-square which is 21 percent while the overall model is highly significant (0.000). Starting from the board size we found that board size is positively and significantly influence the dividend policy of the sector which is in the same line as Haiyan Zhang while the board independence have positive influence but insignificant,
Table 6. Regression Results of Sugar Corporate Governance & Dividend Payout Ratio
Variables Model 1 Model 2 Model 3
Constant -0.5754 -.5254 -.630
BS .0412***
(.007)
.0409***
(.008)
INDDP .0234
(.118)
.025*
(.094)
CEO ONWERSHIP .0112
(.762)
CEOE .043
(.400)
CEO AGE .0015
(.548)
.0018
(.465)
CEO COMPENSATION -.0181
(.183)
-.017
(.166)
Size -.025
(.250)
-.0266
(.282)
-0.0264
(.236)
LEVA -.0213
(.224)
-.009
(.608)
-0.020
(.248)
Total Obs 149 149 149
Prob> F 0.000 0.0001 0.000
R2 0.210 .189 .246
Note: *, ** and *** Significant level 10%, 5% and 1% respectively
In the second model of board characteristics and dividend payout, we found that all the variables do have positive influence on the dividend policy of the sector but insignificant. In the last and overall model which is significant overall and carries R-Square 24 percent explained that Board size does matter for the financial policies of the sector i.e (0.0409, 0.008). (see table 6)
5. Conclusion
References
Aharony, J., & Dotan, A. (1994). Regular dividend announcements and future unexpected earnings: An empirical analysis. Financial Review, 29, 125-151. http://dx.doi.org/10.1111/j.1540-6288.1994.tb00816
Almeida, H., Park, S.Y., Subrahmanyam, M.G., Wolfenzon, D. (2011). The structure and formation of business groups: evidence from Korean chaebols. Journal of Financial Economics 99, 447–475. http://dx.doi.org/10.1016/j.jfineco.2010.08.017
Benartzi, S., Michaely, R., &Thaler, R. (1997). Do changes in dividends signal the future or the past? Journal of Finance, 52, 1007-1034. http://dx.doi.org/10.1111/j.1540-6261.1997.tb02723.xView/save citation
Bhagat, S. , Jefferis, R.H. (2002). The Econometrics of Corporate Governance Studies. The MIT Press, Cambridge, MA.
Bhagat, S., Black, B. (2002). The non-correlation between board independence and long term firm performance.
Journal of Corporation Law, 27, 231–274. http://dx.doi.org/10.2139/ssrn.133808
Brown, L. & M. Caylor. (2004). “Corporate governance and firm Performance”, Working paper, Georgia State University. http://dx.doi.org/10.2139/ssrn.586423
Faccio, M., Lang, L. H. P., & Young, L. (2001). Dividends and expropriation. American Economic Review, 91, 54−78.
http://dx.doi.org/10.1257/aer.91.1.54
DeAngelo, H., DeAngelo, L., & Skinner, D. J. (1996). Reversal of fortune: Dividend signaling and the disappearance of sustained earnings growth. Journal of Financial Economics, 40, 341-371. http://dx.doi.org/10.1016/0304-405X(95)00850-E
Demsetz, H., Lehn, K. (1985). The structure of corporate ownership: Causes and consequences. Journal of PoliticalEconomy, 93, 1155–1177. http://dx.doi.org/10.1086/261354
Gugler, K. and B. B. Yurtoglu. (2003). Corporate governance and dividend pay-out policy in Germany. European Economic Review, 47, 731-758. http://dx.doi.org/10.1016/S0014-2921(02)00291-X
Hermalin, B.E., Weisbach, M.S. (1991). The effects of board composition and direct incentives on firmperformance.
Financial Management, 101–112 (Winter). http://econpapers.repec.org/article/fmafmanag/hermalin91.htm Hermalin, B.E., Weisbach, M.S. (1998). Endogenously chosen boards of directors and their monitoring of the CEO.
American Economic Review, 88, 96-118. doi=10.1.1.49.3767
Hermalin, B., Weisbach, M. (2003). Boards of directors as an endogenously determined institution: a survey of the
economic evidence. Economic Policy Review, 9,7-26.
https://ideas.repec.org/a/fip/fednep/y2003iaprp7-26nv.9no.1.html
Imam, Mahmood Osman & Malik. (2007). Firm Performance and Corporate Governance Through Ownership Structure: Evidence from Bangladesh Stock Market. International Review of Business Research Papers, 88-110. http://papers.ssrn.com/sol3/papers.cfm?abstract_id=2256480
La Porta, R., Lopez-de-Silanes, F., Shleifer, A., & Vishny, R. (2000). Agency problems and dividend policies around the world. Journal of Finance, 55, 1-33. http://dx.doi.org/10.1111/0022-1082.00199
La Porta, R., Lopez-de-Silanes, F., Shleifer, A., Vishny, R.W. (1998). Law and finance. Journal of PoliticalEconomy, 106, 1113–1155. http://dx.doi.org/10.1086/250042
McConnell, J., Servaes, H. (1990). Additional evidence on equity ownership and corporate value. Journal ofFinancial Economics, 27, 595–612. http://faculty.london.edu/hservaes/jfe1990.pdf
Morck, R., Shleifer, A., Vishny, R.W. (1988). Management ownership and market valuation: An empiricalanalysis.
Journal of Financial Economics, 20, 293– 315. http://dx.doi.org/10.3386/w2055
Shefrin, Hersh M., and Meir Statman. (1984). Explaining investor preference for cash dividends. Journal of Financial Economics, 13, 253–282. http://dx.doi.org/10.1016/0304-405X(84)90025-4
Stulz, R.M. (1988). Managerial control of voting rights: financing policies and the market for corporate control. J. Financ. Econ., 20, 25–54. http://dx.doi.org/10.1016/0304-405X(88)90039-6
Watts, R. (1973). The information content of dividends. Journal of Business, 46, 191-211. http://dx.doi.org/10.1086/295525