RESEARCH
Coupling of PARP1-mediated chromatin
structural changes to transcriptional RNA
polymerase II elongation and cotranscriptional
splicing
Elena A. Matveeva
1, Qamar M. H. Al‑Tinawi
1,2, Eric C. Rouchka
3,4and Yvonne N. Fondufe‑Mittendorf
1*Abstract
Background: Recently, we showed that PARP1 is involved in cotranscriptional splicing, possibly by bridging chroma‑ tin to RNA and recruiting splicing factors. It also can influence alternative splicing decisions through the regulation of RNAPII elongation. In this study, we investigated the effect of PARP1‑mediated chromatin changes on RNAPII move‑ ment, during transcription and alternative splicing.
Results: We show that RNAPII pauses at PARP1–chromatin structures within the gene body. Knockdown of PARP1 abolishes this RNAPII pausing, suggesting that PARP1 may regulate RNAPII elongation. Additionally, PARP1 alters nucleosome deposition and histone post‑translational modifications at specific exon–intron boundaries, thereby affecting RNAPII movement. Lastly, genome‑wide analyses confirmed that PARP1 influences changes in RNAPII elon‑ gation by either reducing or increasing the rate of RNAPII elongation depending on the chromatin context.
Conclusions: These studies suggest a context‑specific effect of PARP1–chromatin binding on RNA polymerase movement and provide a platform to delineate PARP1’s role in RNA biogenesis and processing.
Keywords: Splicing, RNA polymerase II, Epigenetics, Poly(ADP)ribose polymerase, Polymerase elongation, Nucleosomes, Chromatin
© The Author(s) 2019. This article is distributed under the terms of the Creative Commons Attribution 4.0 International License (http://creat iveco mmons .org/licen ses/by/4.0/), which permits unrestricted use, distribution, and reproduction in any medium, provided you give appropriate credit to the original author(s) and the source, provide a link to the Creative Commons license, and indicate if changes were made. The Creative Commons Public Domain Dedication waiver (http://creat iveco mmons .org/ publi cdoma in/zero/1.0/) applies to the data made available in this article, unless otherwise stated.
Introduction
PARP1 also known as ARDT1 belongs to family of pro-teins known as ADP-ribosylases. This group of enzymes, up to 17 in humans, have varying degrees of homology but a highly conserved PARP catalytic domain. These proteins use NAD+ as a substrate to catalyze the addi-tion of ADP-ribose moiety(ies) onto target proteins, hence the name ADP-ribosyltransferase. Within this family, only PARP1 and PARP2 can build “poly”-ADP-ribose polymers, while the others are capable of adding only a monomeric ADP-ribose to proteins.
PARP1 is the most studied of this family of proteins for which multiple functions been described, which implies pleiotropic functional characteristics. PARP1 is well known for its role in DNA-repair, genome integrity, and cell death [1]. It also adds poly-ADP-ribose (PAR) onto several proteins involved in NAD+ metabolism [2]. Additionally, for innate immunity, DNA damage, or met-abolic stress, PARP1 can act as a coactivator of NF-κB transcription factors, contributing to the transcription of a subset of NF-κB target genes [3]. Increasingly, the role of PARP1 in modulating chromatin structure to regulate gene expression is being recognized. PARP1 adds PAR residues (PARylates) onto histones [4], which opens the chromatin structure and enables gene activation. In sup-port of this function of maintaining active transcription, several genome-wide studies show PARP1 to be associ-ated with active gene promoters [5, 6], and competing
Open Access
*Correspondence: y.fondufe‑mittendorf@uky.edu
1 Department of Molecular and Cellular Biochemistry, University
of Kentucky, Lexington, KY 40536, USA
with the repressive histone H1 [7, 8] to elicit differential gene expression outcomes. However, while it is clear that PARP1 is important in gene activation, other studies have shown that depletion of PARP1 also results in gene repression [7–11], suggesting that PARP1 most likely acts in a context-specific manner.
Regulation of gene expression occurs at both the tran-scriptional initiation and splicing levels, with chromatin structure influencing both processes. Interestingly, while the role of chromatin in transcription has been stud-ied significantly, the role of chromatin in splicing is just emerging. The recent discovery that splicing, or the deci-sion of a particular region to be spliced, occurs cotran-scriptionally while the nascent mRNA is still tethered to chromatin, developed into the cotranscriptional splicing hypothesis [12–14]. Indeed, changes to the epigenome that mediate chromatin structural integrity have been implicated in alternative splicing regulation. For instance, DNA methylation and histone modifications demarcate exon–intron boundaries [13, 15–19] that regulate splic-ing decisions. It is, therefore, possible that in regulatsplic-ing chromatin structure, PARP1 might also play a role in this process. Indeed, our previous study demonstrated a func-tional role for PARP1 and PARylation in the regulation of pre-mRNA splicing [5]. We showed that PARP1 binds to nucleosomes at target exon/intron boundaries, mediating specific splicing decisions. In addition, we demonstrated that knockdown of PARP1 or inhibition of its PARylation activity resulted in changes in specific alternative splic-ing patterns. Interestsplic-ingly, splicsplic-ing products in PARP1 knockdown (KD) cells versus PARylation-inhibited cells were not similar, possibly suggesting that the effects of PARP1 on chromatin binding are direct while its PARyla-tion activity is indirect. We therefore hypothesized that modulation of chromatin structure by PARP1 directly affects splicing decisions, while its PARylation activity could regulate splicing through activation of splicing fac-tors [20] and/or through PARylation of histones [1, 21,
22] to open up the chromatin structure. However, a clear understanding of how PARP1 regulates alternative splic-ing is unknown.
Two non-mutually exclusive models have been hypoth-esized to explain how chromatin structure or factors that modulate chromatin structure, regulate alternative splicing. (1) The kinetic model proposes that chromatin structure regulates the speed of polymerase elongation to influence splicing outcomes [23]. (2) The adaptor/ recruitment model proposes that chromatin or its asso-ciated factors recruit splicing factors, bridging the chro-matin structure and the nascent mRNA [24–26]. PARP1 could act in both models: PARP1–chromatin binding is well established, and in addition to this function, we showed that PARP1–chromatin binds to splicing factor
3B1 (SF3B1), a U2 spliceosomal member [5], and might therefore act as an adapter, bringing the splicing com-plex (with SF3B1) to RNA. As a further step, we showed that PARP1 binds RNA and identified the PARP1-mRNA binding landscape [11]. In summary, these data support the adapter model for PARP1 to regulate splicing. How-ever, it is not implausible that PARP1 also could regulate the rate of polymerase elongation, especially as PARP1 has been shown to be involved in polymerase pausing at the promoters of heat shock genes [27]. We therefore hypothesized that if PARP1 plays a role in polymerase pausing at the transcription level (promoter region), it may also play a role in chromatin structure that pauses RNAPII elongation along the gene body for splicing regu-lation. In the current study, we propose that PARP1 also works as an RNAPII regulator through mutual interde-pendence of splicing and transcription elongation. Using S2 Drosophila cells as a convenient model (Drosophila contains only one PARP1 gene), we tested the effect of PARP1 on the RNAPII elongation rate and cotranscrip-tional splicing.
Results
PARP1 is involved in mRNA splicing
PARP1–chromatin structure influences RNA polymerase elongation
We next tested whether PARP1 regulates splicing through regulation of the rate of RNAPII elongation. For this, we used our genome-wide data of PARP1 nucleo-some occupancy (GSE56120) in Drosophila S2 cells with PRO-seq data [28] (GSE42117) of transcriptionally engaged RNA polymerase. Analyses of these binding profiles showed that PARP1 and engaged RNAPII are in close proximity within gene bodies. Indeed, we observe a shift ~ 25 bp downstream of the PARP1 signal relative to the RNAPII signal (shown as metagene plots in Addi-tional file 1: Fig. S3). These data suggest that PARP1 may be involved in RNAPII elongation stalling. Next, we investigated if these binding profiles are true in our genes of interest above.
The processivity of RNAPII depends on the phospho-rylation state of its carboxy terminal domain (CTD). In particular, the transition between initiation-pausing and productive elongation is marked by phosphoryla-tion on Ser5 and Ser2, respectively [29–31]. We there-fore asked whether PARP1 influences the recruitment of different forms of phosphorylated RNAPII to exonic regions of our target genes, AKAP and CAPER. Three antibodies that bind specific phosphorylation states of RNAPII were used: (1) 4H8, which recognizes Ser5 phosphorylation (marks initiating and first regions of the gene)—hence referred to as Ser5; (2) H5, which rec-ognizes Ser2 phosphorylation is found mainly in the gene body and toward the 3′ end of the gene. This form is known as the transcriptionally engaged and elon-gating form of RNAPII—hence referred to as Ser2P; (3) 8WG16, which recognizes hypo-phosphorylated a
b
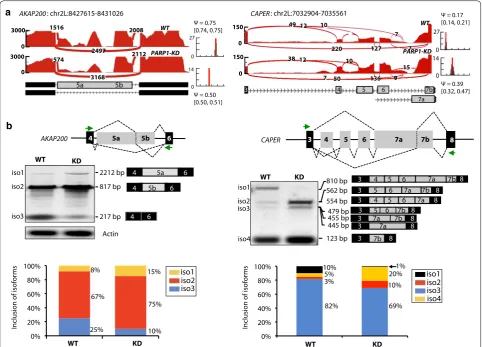
Fig. 1 PARP1 depletion alters splicing decisions. a Sashimi plots showing changes in the splicing decisions due to PARP1 depletion in RNA‑seq genome‑wide analyses for AKAP200 and CAPER. b PCR products with exon junction spanning primers validate splicing changes in AKAP200 and
RNAPII found at pre-initiation sites. The 8WG16 anti-body has been reported to sometimes also recognize Ser5-phosphorylated RNAPII and could be used to determine total RNAPII. We therefore performed ChIP-qPCR using these antibodies on cross-linked chroma-tin from wild type (WT) and PARP1 knockdown (KD) cells and analyzed the occupancy of the various forms of RNAPII on the two PARP1 target genes—AKAP and CAPER (Fig. 2 and Additional file 1: Fig: S4). To better assess the correlation between PARP1 reduction and RNAPII occupancy, we calculated the ratio between the
occupancies of these polymerase forms and PARP1 at three locations: (1) the immediate preceding constitu-tive exon; (2) the intervening intron; (3) the proceed-ing alternative exon of these genes as shown in Fig. 2a. We call this the ‘travelled’ index as it determines the ratio of PARP1 (or RNAPII) occupancy at the proceed-ing intron or alternative exon, relative to the precedproceed-ing constitutive exon.
To begin, the occupancy of PARP1 was measured. In WT cells, at the AKAP gene, a 22% reduction in the rela-tive occupancy of PARP1 was observed at the alternarela-tive
a
b c
d e
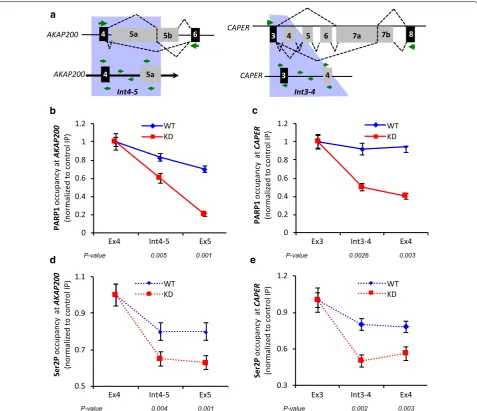
Fig. 2 PARP1 and RNAPII ChIP‑qPCR for PARP1 target genes AKAP200 and CAPER.a Diagram of constitutive (black boxes) and alternative (gray boxes) exons of a wider region (upper) and zoomed in region (lower) for AKAP200 and CAPER genes. Green arrows depict primer locations. b, c
Showing the relative occupancy of PARP1 in wild type (WT, blue line) and PARP1 knockdown (KD, red line) cells for AKAP200 and CAPER at the alternative exon relative to presiding constitutive exon. d, e Showing RNAPII occupancy (elongation form, Ser2P) for AKAP200 and CAPER. All experiments were performed in triplicate, and results are presented as mean ± SD (*p value < 0.05). Statistical significance was tested by Student’s t
exon 5 compared to constitutive exon 4 (Fig. 2b and Additional file 1: Fig. S4A—blue bar). When using the ‘travelled’ index, this represented a steady decline of PARP1 occupancy from the 5′ constitutive exon 4 to pro-ceeding intron 4–5 and was lowest at the 3′ alternative exon 5 (Fig. 2b). In PARP1 depleted conditions (PARP1 KD cells), a reduction of ~ 80% of PARP1 occupancy was measured at alternative exon 5 relative to constitutive exon 4 (Additional file 1: Fig. S4A—red bar). With the travelled index incorporated, this change represented a further decrease of ~ 45% and ~ 80% in PARP1 occupancy at the proceeding intron 4–5 and at alternative exon 5 relative to the constitutive exon (Fig. 4b—red line). A similar trend was observed at the CAPER gene though the decrease in the relative amount of PARP1 occu-pancy from constitutive exon 3 to alternative exon 4 was less pronounced. As expected, there was an additional decrease in PARP1 occupancy at all the tested sites in KD cells (Fig. 2c and Additional file 1: Fig. S4A).
Next, we asked whether the observed changes in PARP1 occupancy correlate with changes in the occupancy of RNAPII forms. Using the Ser2P antibody, which recog-nizes the transcriptionally engaged, elongating form of RNAPII, we showed that depletion of PARP1 correlated with depletion of this transcriptionally engaged RNAPII at the studied exons. These data corroborated our directly measured results comparing alternative versus consti-tutive exons and also those measured by the travelled index. In WT cells, as measured through direct compari-son of occupancy at alternative exon versus constitutive exon, the AKAP gene showed a decrease of ~ 20% (Addi-tional file 1: Fig. S4B). Further supporting these data, the travelled index (Fig. 2d) showed a steady decline of Ser2P from the 5′ constitutive exon toward the 3′ alterna-tive exon. These results were very similar for the CAPER gene (Fig. 2e and Additional file 1: Fig. S4B). Interest-ingly, in PARP1 knockdown cells, Ser2P decreased even further (~ 40% at intron 4–5 and alternative exon 5 compared to constitutive exon 4 at AKAP) (Fig. 2d and Additional file 1: Fig. S4B), while this decrease in Ser2P was ~ 50% at CAPER gene regions (Fig. 2e and Addi-tional file 1: Fig. S4B). These findings correlated with the observed decrease in PARP1 occupancy at these sites (Fig. 2b, c; Additional file 1: Fig. S4A). Next, we asked if this correlation of PARP1 occupancy is specific for only the elongating Ser2P occupancy. For this, we tested the occupancy of the other phosphorylated forms of RNAPII—the pre-initiating form of RNAPII, also known as hypo-phosphorylated RNAPII (8WG16), and Ser 5 (4H8). In WT cells, the occupancy of 8WG16 at alterna-tive exons over constitualterna-tive exons was reduced by 50% for both AKAP and CAPER genes, respectively (Addi-tional file 1: Fig. S4C—blue bars). On the other hand, in
KD cells, we observed an increase in the presence of this polymerase form (Additional file 1: Fig. S4C—red bars). Profiling of 4H8, which measures Ser5 which is found at TSSs and gene bodies, showed a slight increase at the alternative exon 5 of AKAP compared to the constitutive exon 4. For CAPER, we observed a large and significant decrease of ~ 80% occupancy of Ser5 (Additional file 1: Fig. S4D—blue bars). In KD cells, AKAP exhibited an increase in this polymerase form while CAPER showed no significant difference in occupancy compared to WT cells (Additional file 1: Fig. S4D—red bars). Finally, analy-sis of the occupancies of PARP1 and the various RNAPII were recapitulated in cells treated with a second siRNA (siRNA2), thus confirming the effect of PARP1 on the occupancy of RNAPII. In contrast, inhibition of PARyla-tion showed no differences in PARP1 or in the occupan-cies of the different RNAPII forms when compared to WT cells (Additional file 1: Fig. S5). These data there-fore show that PARP1 occupancy and not its PARylation activity exerts an effect on the occupancy of elongating polymerase.
PARP1 depletion disrupts chromatin state and structure Chromatin context can affect the rate of RNAPII elonga-tion, which in turn, would regulate alternative splicing. After confirming the relationship between PARP1 and RNAPII pausing, we next investigated the type of chro-matin context mediated by PARP1 at these alternative exon sites. For this, we mapped the nucleosomes across AKAP and CAPER genes using the nucleosome walk-ing method [32]—a low-resolution technique, which allows gene-specific high-resolution mapping of nucleo-some positions along a stretch of DNA [33]. Chroma-tin is digested with micrococcal nuclease (MNase) to yield mostly mononucleosomal fragments and is then subjected to quantitative real-time PCR (qRT-PCR— see Methods). First, we predicted nucleosome loca-tions based on sequences alone [34] (Fig. 3a, b—top panels). Then, primers were designed to amplify about 80–100-bp-sized amplicons that overlapped by 20–40 bp, tiling across the selected loci of the AKAP and CAPER genes. In this technique, amplification of a product indi-cates the presence of a protected mononucleosome, while the lack of amplification signifies open chromatin susceptible to MNase digestion. Nucleosome positions and strength of nucleosome occupancy were then calcu-lated using the fold change between MNase-treated sam-ples and undigested genomic DNA at an equivalent DNA input concentration (see Methods).
AKAP gene, two clear observations were made: (1) There is a strong nucleosome in PARP1 KD cells, mapped by primer A8, which was previously absent in WT cells. (2) At the genomic locations mapped by primers A13 to A15, a reduction in nucleosome occupancy in PARP1 KD cells was seen, with a shift of the nucleosomes toward the A16 position (Fig. 3a). For the CAPER gene, we observed a reduction in nucleosome occupancy just before the alternate exon 4 (mapped by primers C8–C10) and in the region containing the alternative exon 4 (mapped by primers C12–C16) (Fig. 3b). Here too, PARP1 knock-down using siRNA2 produced similar results for nucle-osome repositioning as seen in cells transfected with PARP1 siRNA1, while PARylation-inhibited cells exhib-ited no changes in nucleosome positioning when com-pared to WT cells (Additional file 1: Fig. S6). Since these PARP1-mediated nucleosome rearrangements occur right before the alternate exon, we posit that PARP1 maintains a chromatin structure that would be amenable to transcription elongation by RNAPII in the absence of PARP1.
PARP1 occupancy displays interplay of selective acquisition of histone methylation at genic regions Several histone marks have been implicated in alterna-tive splicing [20]. Given that our previous data showed interplay between PARP1 and certain histone marks [5], we then sought to determine whether interplay of PARP1 with specific histones could drive the observed chromatin rearrangement and transcriptional elonga-tion machinery at the studied regions. Typically, paused gene regions are marked by bivalent histone marks. In view of this, we used ChIP-qRT-PCR, to measure the occupancy for both the activating mark, H3K4me3, and repressive mark, H3K27me3, in regions that showed the most change in nucleosome structure—regions mapped by primers A14 for AKAP and C8 for CAPER and its surrounding exons (Fig. 3). In WT cells, at both genes, H3K4me3 and H3K27me3 were found at all sites tested (preceding constitutive exon, intervening intron, and alternative exon) with varying levels (Fig. 4). The pres-ence of both the activating H3K4me3 and repressive mark H3K27me3 is indicative of a poised gene region. To further assess whether there is interplay between these
histone marks and PARP1, we investigated whether their occupancy is changed in the absence of PARP1. Knock-down of PARP1 resolved this bivalency of H3K4me3 and H3K27me3 marks to H3K4me3. At both of these genes, there was an increase in H3K4me3 occupancy (Fig. 4a for AKAP and 4c for CAPER) and a decrease in H3K27me3 occupancy (Fig. 4b for AKAP and 4D for CAPER). The resultant net gain of H3K4me3—an active histone mark—possibly opens up the chromatin structure allow-ing for the passage of transcription machinery. These data were recapitulated in cells treated with siRNA2 (Additional file 1: Fig. S7—red bars vs. blue bars), while PARylation-inhibited cells showed no difference relative to WT cells (Additional file 1: Fig. S7—green bars vs. blue bars). In summary, our data are consistent with a model in which binding of the PARP1 mediates or is mediated by specific histone modifications. Additionally, the effect of PARP1 on chromatin structure (nucleosome position-ing and occupancy of histone PTMs) is instigated by the direct presence of PARP1 and not its PARylation activity. Thus, at the sites of alternative splicing, PARP1 could play a dual role in stimulating the release of RNAPII pausing and recruiting chromatin modifications that facilitate its release from the paused state.
PARP1 influences RNAPII elongation genome‑wide
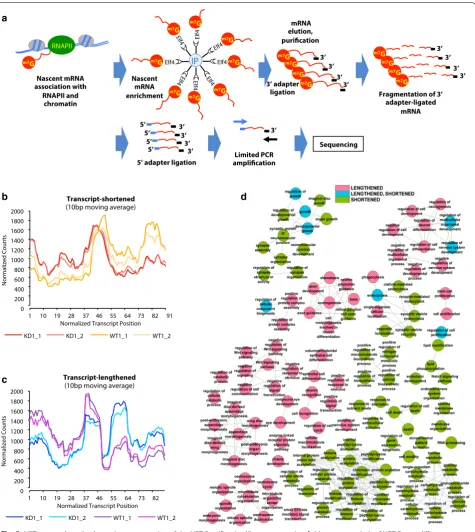
The observations of the direct effect of PARP1 binding on chromatin structure and histone modification occupancy prompted us to ask whether PARP1 could influence the release of RNAPII from pause sites. We used a modified 3′NT-seq method [35] and the NET-seq method [36] to map the positions of elongating and arrested RNAPII complexes at nucleotide resolution (Fig. 5a) in the pres-ence and abspres-ence of PARP1. The 3′NT method effectively isolates mRNA from RNA-RNAPII–chromatin com-plexes. The presence of the m7G cap on RNAPII tran-scripts within the first 20–30 nucleotides of transcription allows for the immunoprecipitation of nascent mRNAs using the GFP-elF4E protein (which binds to the m7G cap) bound on magnetic beads. These captured mRNAs were then eluted from beads, purified, and ligated to the 3′ adapter used in Illumina sequencing. Next, the RNAs were fragmented to not only decap the captured 5′ ends of the mRNAs, but also to reduce the size of the mRNAs
(See figure on next page.)
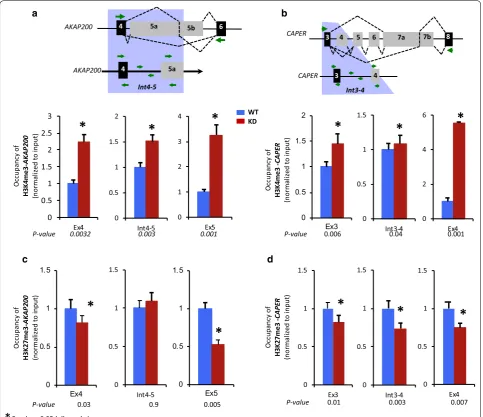
Fig. 3 Analysis of nucleosome architecture. The positions of nucleosomes in non‑treated cells (WT, blue line) versus PARP1 knockdown (KD, red line) for the AKAP200 (a) and CAPER (b) genes are distinctive. For each gene, the top panel shows gene region and the predicted nucleosome location (gray ovals) based on sequence alone [34]. The bottom panel demonstrates the nucleosome position and occupancy (green ovals) obtained by nucleosome scanning analysis (see Methods). Depletion of PARP1 shifts nucleosome positioning and occupancy. Light green ovals depict reduction in nucleosome occupancy, while fuzzy nucleosomes are represented as nucleosomes overlying each other. All experiments were done in triplicate, and results are presented as mean ± SD (results were considered significant as determined by Student’s t test method: p
to ~ 35–100 nucleotides. Fragmented mRNAs were then size selected on a denaturing gel. Next, the 5′ phos-phate groups were removed enzymatically, allowing for the ligation of the 5′ sequencing adapter. cDNA librar-ies were then prepared, and limited PCR amplification with primers that bind to both the 5′ and 3′ adapters was performed. This allowed for the capture and sequenc-ing of only mRNA fragments with both the 5′ end (end after fragmentation) and the original 3′ end of the nas-cent mRNAs. After PCR, samples were size selected on a 3.3% NuSieve agarose gel. These fragments were treated
and analyzed separately, gel purified, and subjected to Illumina high-throughput 50 bp paired-end sequencing. Two biological replicates for WT and PARP1-KD cells were sequenced, generating ~ 30–100 nt reads for each 3′NT-seq sample (LW1 and its corresponding HW1; LW2 and its corresponding HW2). A total of 780 million reads were sequenced, 101 million of which mapped uniquely (i.e., after removing multi-mapped reads and potential PCR duplicates) to the Drosophila genome (Dm6) after additional filtering steps.
a b
c d
Fig. 4 Knockdown of PARP1 induces dynamic changes in the occupancy of histone marks. The occupancy of activating histone marks (H3K4me3;
lower panels of a, b) at AKAP200 (a) and CAPER (b), and the occupancy of the repressive histone marks (H3K27me3) at AKAP200 (c) and CAPER (d) were evaluated by ChIP‑qPCR for PARP1 target genes. All experiments were performed in triplicate, and results are presented as mean ± SD (p
In 3′NT-seq experiments, the sequenced read den-sity reflects the abundance of the transcript and the 3′
ends of the nascent mRNAs map the RNAPII position
at nucleotide resolution. Thus, assuming there is no deg-radation, these sequenced RNAs would have the cap-tured 3′ ends of the elongating polymerase just before b
c
0 200 400 600 800 1000 1200 1400 1600 1800 2000
1 10 19 28 37 46 55 64 73 82
Normalized Counts
Normalized Transcript Position
KD1_1 KD1_2 WT1_1 WT1_2
Transcript-lengthened
(10bp moving average)
0 200 400 600 800 1000 1200 1400 1600 1800 2000
1 10 19 28 37 46 55 64 73 82 91
Normalized Counts
Normalized Transcript Position
KD1_1 KD1_2 WT1_1 WT1_2
Transcript-shortened
(10bp moving average) d
a
Fragmentation of 3’ adapter-ligated
mRNA IP Elf4
Elf4
Elf4
Elf4
Nascent mRNA enrichment
mRNA elution, purification
3’ adapter ligation
3’ 3’
3’ 3’
3’
3’
3’ 3’
RNAPII
m7G
Nascent mRNA association with
RNAPII and chromatin
3’
5’ 3’
5’ 3’
5’ 3’
5’
5’ adapter ligation
Sequencing 3’
Limited PCR amplification m7G
m7G m7G
m7G m7G
m7G
m7G
m7G m7G m7G
m7G m7G m7G
m7G m7G m7G
transcription elongation inhibition by alpha-amanitin. In fact, the resolution afforded by 3′NT-seq and the cover-age obtained should provide an in-depth view of genome-wide transcriptional activity. Thus, to begin our analyses, we first compared the reproducibility of the biological replicates using the multiBamSummary tool from Deep-Tools 2.0 [37]. The biological replicate libraries show strong agreement (Pearson’s coefficient > 0.988), which documents the robustness of our approach. We then compared the sequencing reads normalized by reads per kilobase of transcript, per million mapped reads (RPKM) between WT and PARP1 KD cells. To determine if tran-scription of specific segments of mRNA genes is targeted by PARP1, we calculated the number of normalized reads for all mRNA genes and divided them into five separate regions: 1000 bases immediately upstream of the start codon (upstream); transcript (from transcription start sites (TSS) to transcription end sites); first 100 bp of the transcript; last 100 bases of the transcript; and 1000 bases downstream of the transcript end (downstream).
A total of 100 bins were created for each region. In the initial global test, using a cutoff of p < 0.01, subtle differences between WT and PARP1 KD samples were observed in the bins for the upstream and transcript regions (Additional file 1: Fig. S8A, B). On the other hand, some differences were observed at downstream regions as well as at the early (first 100 nt) and late gene bodies (last 100 nt) due to PARP1 knockdown (Addi-tional file 1: Fig. S8C–E). Next, using the difference in the percentage of reads occurring in the first 50 bins, we filtered the differentially expressed regions into three groups: Group 1: genes with reads that were shortened; Group 2: genes with reads that were lengthened; Group 3: genes with reads that had differential patterns not specifi-cally related with shortening or lengthening. This analysis resulted in a total of 1786 genes, of which 348 (Group 1) and 307 (Group 2) had lengthened and shortened tran-scripts, respectively, in KD versus WT cells, and the rest were placed in Group 3. We show the top 20 shortened (Additional file 1: Table S1) and lengthened genes (Addi-tional file 1: Table S2). Examples of shortened and length-ened genes are shown in Additional file 1: Fig. S9A and B, respectively.
To better understand the pattern of these lengthened and shortened genes, we also performed metagene anal-ysis of the 3′NT-seq at different genomic regions. We observed a shifting of RNAPII locations, evidenced by average RNAPII densities in the PARP1 KD, which were substantial, often decreasing (shortened) or increasing (lengthened) (Fig. 5b & c), when compared to the same sites in WT cells. In the KD condition, when transcripts have shortened RNAPII profiles, there is a slight shift in the peak of RNAPII location toward the 5′ end of the
gene relative to WT (Fig. 5b). For lengthened genes, one main peak (location) of RNAPII was observed in WT cells. In PARP1 depleted cells, there was a decrease in this peak with a concurrent appearance/increase of a new peak located 3′ of this peak (Fig. 5c), resulting in two prominent peaks.
At the upstream regions, in genes with a shortened RNAPII profile, one peak was detected with little to no change in PARP1 KD cells (Additional file 1: Fig. S10A). As for the lengthened genes, several peaks were present. In cells with depleted PARP1, there was a reduction in the peaks at the 5′ region with a concurrent increase in the peaks at the 3′ end (Additional file 1: Fig. S10B). A similar situation occurred for the RNAPII downstream regions with shortened genes (Additional file 1: Fig. S10C). On the other hand, slight differences were detected with lengthened genes, including a stronger peak emerging toward the 5′ of the WT RNAPII positions (Additional file 1: Fig. S10D). At the other gene regions, the first and last 100 bp gene regions, a shortened RNAPII profile can be seen, similar to the downstream regions (Additional file 1: Fig. S10E and G, respectively). With the lengthened genes, there seems to be a flattening and merging of the two RNAPII peaks in PARP1 KD cells for the RNAPII locations within the first and last 100 bp genic regions (Additional file 1: Fig. S10F and H). According to other studies, a fast polymerase is typically associated with an overall flattening of the RNAPII profile in the termina-tion zone replacing the clear drop-off in RNAPII density that occurs in WT cells. Interestingly, such a flattened profile has been associated with reduced pausing [38]. Finally, we asked whether these genes with shortened or lengthened transcript regions are involved in any func-tional pathways. For this we performed gene ontology: biological process analysis (GO:BP) using categoryCom-pare [39]. GO:BP analysis results showed that genes with a shortened RNAPII profile were significantly enriched in genes associated with cell processing (Fig. 5d and Addi-tional file 1: Table S3). On the other hand, the genes with a lengthened RNAPII profile were significantly involved with organismal organization (Fig. 5d and Additional file 1: Table S4).
CAPER gene
300
C T A C C G A C A A C T A C C C A C A C A C A A T C A C C A T T A A A A A A T A C A A A A A A A A A A A A
b
WT: Rep. 1
WT: Rep. 2
PARP1-KD: Rep. 1
PARP1-KD: Rep. 2
7,034,090 7,034,100 7,034,110 7,034,120 7,034,130 7,035,350 7,035,550 7,035,750 7,035,950
20bp dm6
0 400 0 400 0 400 0
40bp dm6
WT: Rep. 1
WT: Rep. 2
PARP1-KD: Rep. 1
PARP1-KD: Rep. 2
0 -50 0 -10 0 -40 0 -40 Chr 2L
Read
count
s
FBtr0344712 FBtr0089636 FBtr0344708 FBtr0344710 FBtr0344711 FBtr0089640 FBtr0344709
AKAP200 gene
WT: Rep. 1
WT: Rep. 2
PARP1-KD: Rep. 1
PARP1-KD: Rep. 2
8,427,985 8,427,995 8,428,005 8,428,015 8,428,025 8,427,360 8,427,370 8,427,380 8,427,390 8,427,400
a 20bp dm6 40bp
211 0 101 0 165 0 125 0
WT: Rep. 1
WT: Rep. 2
PARP1-KD: Rep. 1
PARP1-KD: Rep. 2
G A G C C A C C G C A C C A G A A T G G C A C C A A T G G C A C C A C C A C G C C C C C G C C C A C T A G G A C A A G G T C A A G A A G A A G T G G T C C T T C C G A A G C A T T T C C T T T G G C A A G A A G G A C A A A C
8,427,350
dm6
Chr 2L 211 0 101 0 165 0 125 0
Read
count
s
FBtr0079567 FBtr0340239 FBtr0079564 FBtr0340249 FBtr0340241
FBtr0079565 Exon 4 Exon 4
Intron3- 4 Exon 7 Exon 8
c
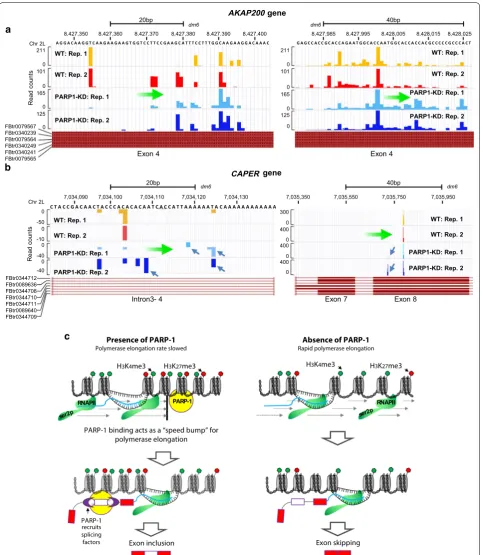
the PARP1-mediated block is relieved (through knock-down of PARP1), more RNAPII was able to move knock- down-stream to selectively include specific exons over others (Fig. 6a). The situation at the CAPER gene is slightly dif-ferent. NET-seq in KD cells shows an increase in RNAPII footprint within the preceding intronic region (left panel—Fig. 6b), and a slowing down of RNAPII around the proceeding exonic region located at 7,035,750 bp (Fig. 6b). These results of a fast RNAPII elongation at upstream intronic regions and slow down of RNAPII elongation at the proceeding exons, could explain the selective exon skipping seen in PARP1 KD cells (Fig. 1b). Additionally, these results resonate with previous studies showing that slowing down of RNAPII not only results in exon inclusion, but has been implicated in exon skip-ping as well [40]. In summary, our analyses for specific genes show a clear RNAPII pausing defect (positive and negative) due to PARP1 depletion. Interestingly, these changes in RNAPII elongation occur at the same location of PARP1-mediated chromatin changes (Figs. 3, 4 and Additional file 1: Figs. S5 and S6), thus supporting our hypothesis that PARP1-mediated chromatin structural rearrangement regulates RNAPII elongation and splicing decisions.
Discussion
Cotranscriptional removal of introns occurs in the vicin-ity of other gene expression machineries, including RNAPII and the chromatin remodeling factors. We pre-viously documented that PARP1 is involved in splicing and proposed that PARP1 might play roles both in the ‘adaptor model’ and in the ‘kinetic model.’ Interestingly, these models are not mutually exclusive. We showed that PARP1 influences splicing, in part, through physi-cal interactions of PARP1-bound chromatin, the spli-ceosome, and RNA. This finding supports the ‘adaptor model’ of cotranscriptional splicing [5, 11]. However, the effect of PARP1 on RNAPII elongation in the context of the ‘kinetic model’ remains unclear. At the beginning of this study, we proposed that PARP1 might also regulate RNAPII elongation. This concept is not unreasonable considering that several studies have shown that PARP1 influences RNAPII pausing at promoters [41], and PARP1 has an impact on negative elongation factor (NELF [42]) during RNAPII elongation. We therefore hypothesized that PARP1-bound chromatin regulates the RNAPII elongation rate by maintaining a specific chromatin structure, thus impacting splicing decisions. In this study, we undertook a comprehensive investigation of the influ-ence of PARP1 on RNA polymerase elongation and splic-ing. Although most of this study focused on two target genes, our data indicate that PARP1-bound chromatin does influence splicing decisions. The local influence of
chromatin was illustrated by the experiments on the two genes of study—AKAP and CAPER. These experiments showed that depending on the exon under scrutiny, a given chromatin factor has a variable effect favoring either exon inclusion or exclusion in a rather unpredict-able manner.
Several mechanisms have been proposed to understand how the rate of RNAPII modulates alternative splicing. First, this process can occur through the phosphoryla-tion state of the transcribing RNAPII [43] as well as the association of RNAPII with specific transcription factors [44]. Second, modulation can occur related to the effect of chromatin structure on the rate of elongation of the transcribing RNAPII, through DNA methylation [45] and histone modifications [12, 40, 46], which could create or eliminate chromatin roadblocks to elongation. The chro-matin structure created impacts splicing decisions. For instance, increased nucleosome occupancy observed in exons compared to introns might aid in exon definition (reviewed in [47]) by modulating the RNAPII elongation rate. It is also possible that a chromatin context mediated by PARP1 represents a stumbling block that influences RNAPII elongation, thereby impacting the outcome of splicing.
The way that PARP1 affects the RNAPII elongation rate in vivo is not fully understood. It is possible that PARP1 acts together with other chromatin factors to remodel the chromatin structure. This could result in opening up the chromatin structure to influence RNAPII move-ment, which suggests that a certain degree of nucleosome remodeling is a prerequisite for, or a consequence of, active transcription. To investigate the role of PARP1 in transcriptional elongation and splicing in vivo, we meas-ured the co-occupancy of PARP1 and RNAPII elongat-ing polymerase (Fig. 2). PARP1-bound nucleosomes and RNAPII occupied similar regions in both genome-wide studies and in gene-specific loci.
two siRNAs targeting different regions of PARP1 showed similar results, while PARylation inhibition had no effect producing results comparable to WT cells (Figs. 3, 4 and Additional file 1: Figs. S5 and S6). In fact, once PARP1 was depleted, the remodeling of chromatin structure to a more open chromatin structure via differential nucleo-some occupancy/positioning, and histone modifications, would allow for transcriptional elongation (Fig. 3). Thus, our results showing bivalency at PARP1-occupied sites suggest these are sites of paused transcription, poised for activation. Another epigenetic mark related to alterna-tive splicing regulation is DNA methylation. Though we analyzed possible differential DNA methylation changes at these sites (data not shown), the results were diffi-cult to interpret. We attribute this diffidiffi-culty to the lack and//or very low levels of DNA methylation present in the fly genome [48]. Overall, our data are consistent with the idea that a chromatin structure mediated by PARP1, impacts RNAPII elongation and possibly splicing decisions.
The effect of PARP1 on polymerase elongation and pausing has been shown in several previous studies. For instance, at heat shock promoters, immediately after induction, PARP1 mediates a rapid loss of nucleosomes in the bodies of induced Hsp70 genes, indicating that PARP1 acted as a block to transcription elongation. Immediately after the block is released through PARyla-tion of PARP1 and histones, nucleosomes are remod-eled, allowing for polymerase to move along the gene body with consequences in increased transcript levels [27, 41, 49]. Interestingly, another study showed that PARP1 PARylates and inhibits negative elongation fac-tor (NELF), thus illustrating that PARP1 is important in transcription elongation. The latter study further showed that knockdown of PARP1 or inhibition of its PARylation activity, increased RNAPII pausing and reduced pro-ductive elongation [42]. These studies therefore provide functional links between PARP-1, ADP-ribosylation, and NELF. Furthermore, the binding of PARP1 to nascent RNA was shown to reduce the rate of RNA elongation by RNAPII, and subsequent automodification of PARP1 removes the transcriptionally inhibitory PARP1 mol-ecules, thus up-regulating RNA synthesis [50]. Together, these studies suggest a link between PARP1 and RNAPII elongation and likely suggest that PARP1 initially would act as a “bump” to elongating RNAPII. With subsequent signals, PARP1 gets PARylated, releasing the block to transcription. PARP1 therefore could act as a hinge between signaling pathways and gene expression by com-municating with the direct regulators of pausing [41,
42, 49]. Our data are consistent with the above studies. First, we observed that Pro-seq signals of paused RNAPII are in the same vicinity as PARP1-bound nucleosomes
genome-wide (Additional file 1: Fig. S3). Sometimes the RNAPII signal is shifted a little downstream (Additional file 1: Fig. S3B–D), and the peak becomes broader with some tailing when compared to the PARP binding peak. These results hinted to the possibility that PARP1-bound nucleosomes could be involved in RNAPII elongation kinetics and possibly that some RNAPII backtracking occurs at these nucleosomes. RNAPII backtracking has been suggested to be the rate-limiting step in RNAPII elongation kinetics [35]. Although we could not defini-tively show RNAPII backtracking in this study, our results demonstrate a correlative presence of PARP1 nucleosome and RNAPII peaks within the gene body. Interestingly, knockdown of PARP1 resulted in loss of PARP1 signals at target regions with a corresponding loss of RNAPII signals (Fig. 2 and Additional file 1: Figs. S5 and S6), suggesting that loss of PARP-1 is necessary to achieve an efficient relieve from the elongation block of RNAPII into productive elongation.
However, these low-resolution studies do not provide a detailed understanding of kinetic coupling for the elon-gation rate, pausing, and nascent RNA structure. We therefore used a modified version of native elongating transcript sequencing (NET-seq), combining NET-seq [36] and 3′NT-seq [35] protocols. Although 3′NT maps all forms of RNAPII (paused, backtracked, and recover-ing), it does not map initiating RNAPII. Thus, all our sub-sequent analyses focused on the regions mapping to the body of the transcripts, as well as upstream and down-stream of the TSS. Our analyses mapping the impact of PARP1 on the RNAPII location showed that some of the transcripts were lengthened after PARP1 knockdown while others were shortened. In comparing our NET-Seq data with our previous study on alternative splicing detected with PARP1-KD RNA-Seq [5] using rMATS [51], transcripts with shortened sites have twice as many alternative splice events than those with lengthened sites or with sites with no change, providing further evidence that pausing affects alternative splice mechanisms (see Additional file 2).
PARP1 knockdown, indicative of a slowing down of poly-merase elongation. Our model though cannot explain these instances of slow RNAPII and exon skipping in the absence of PARP1. Thus, further studies will be needed to tease how PARP1-bound chromatin, by slowing down the rate of RNAPII elongation, also results in exon exclu-sion. Generally, the ‘kinetic model’ of RNAPII’s effect on splicing decisions states that ‘slow RNAPII’ yields exons that are included while ‘fast RNAPII’ leads to exon skip-ping. However, contrary to this simplistic interpretation of the kinetic model, our results show that PARP1–chro-matin binding instigates both lengthening and shorten-ing of transcripts. We therefore interpret this effect of PARP1 on RNAPII elongation and splicing to be context specific. This interpretation is supported by our recent studies where we observed both exon inclusion and exon skipping after PARP1 depletion/PARylation inhibi-tion [5, 11]. In addition, several studies that focused on the kinetic coupling of splicing and transcription showed that similar elongation changes promote different splic-ing outcomes [43, 52, 53]. Thus, changing the elongation rate may not alter the window of opportunity for positive splicing factors to bind but may also allow negative splic-ing factors to bind, justifysplic-ing why slow RNAPII elonga-tion can also favor exon skipping.
Conclusions
We observed that PARP1 depletion produces skipping of exons on the AKAP and CAPER genes. RNAPII accumu-lated at the alternative exons of these genes, which are potential pause sites that facilitate changes in splicing [28, 54, 55]. Upon PARP1 depletion, we showed changes in alternative splicing events and RNAPII accumulation, suggesting that a correct chromatin structure is required for the normal splicing events taking place at these alter-native exons. The salient question is, why is this region so sensitive to PARP1 depletion? We analyzed the context of PARP1 occupying this region (Figs. 3, 4; Additional file 1: Figs. S5 and S6). In the presence of PARP1, both activat-ing and repressive histone marks are also present in this region. In addition to RNAPII elongation rate, PARP1-bound chromatin may also play a role in recruiting splic-ing factors. Because PARP1 can post-translationally modify histones [56, 57], it is possible that the absence of a correct nucleosomal structure under conditions of PARP1 depletion might also impair the recruitment of these splicing factors to the chromatin. Whatever the case, our data show a link in PARP1 depletion, RNAPII phosphorylation state, RNAPII elongation state, histone modification, and nucleosome positioning. In summary, the results in this study are consistent with the idea that PARP1 is crucial in gene regulatory processes in the cell.
Materials
1. S2 cell culture and siRNA-mediated knockdown
Drosophila melanogaster S2 cells (obtained from Thermo Fisher Scientific, Waltham, MA 02451) were cultured in Schneider’s Drosophila medium (Life Tech-nologies, Austin, TX 78744) supplemented with 10% heat-activated fetal bovine serum (Sigma, St Louis, MO 63146), 100 U/ml penicillin, and 100 μg/ml streptomy-cin at 25 °C. All experimental samples and controls were growth time and cell-density matched. siRNA-mediated PARP1 knockdown was performed as described previ-ously [5]. siRNA1 for KD1 was made according to the Lis laboratory—Cornell University, Ithaca, NY, USA [49], while siRNA2 was made from PCR products targeting specific exons of PARP1 and LacZ were obtained from the Drosophila RNAi Screening Center (FlyRNAi.org— the database of the Drosophila RNAi screening center: 2012 update) to produce double-stranded RNA (dsRNA) for PARP1 knockdown and non-targeting control LacZ. Depletion of PARP1 was confirmed by Western blot and quantitative PCR using primers 1–4 (Additional file 1: Table S5).
2. PARylation inhibition
Cells were treated with 10 μM PJ34 hydrochloride (PARylation inhibitor, Thermo Fisher Scientific, #528150, Rockford, IL, 61101) or vehicle overnight for 16 h. Cells were then washed twice with PJ34-free medium, pelleted, and frozen for experiments.
3. Western blots
Western blots were performed using a standard pro-tocol, and input dilutions were used as a quantitative indication of signal linearity. Protein samples were re-suspended in SDS loading buffer and electrophoresed on a 10% Tris–glycine gel with Tris running buffer. The proteins were transferred to PVDF membrane (Thermo Scientific, Rockford IL, 61101) and sequentially probed with primary antibodies for PARP1 and actin. Western blot-based detection was performed using alkaline phos-phatase-coupled secondary antibodies (Sigma, St Louis, MO 63146) with Amersham ECF substrate for visualiza-tion (GE Healthcare, Waukesha, WI 53188), and images were obtained using Typhoon FLA 9500 (GE Healthcare, Piscataway, NJ 08854). ImageQuant TL software was used to quantify protein signals.
PAR assay in cellular extract was done using high-throughput chemiluminescent ELISA (HT PARP in vivo Pharmacodynamic Assay II kit from Trevigen, #4520-096-K, Gaithersburg, MD 20877). Net mean relative light units (RLU) values of the PAR standards were calculat-ing by subtraction of the background (without PAR) from RLU values and presented as a function of PAR values (pg/ml).
5. Chromatin immunoprecipitation (ChIP)
Cross-link chromatin immunoprecipitation (X-ChIP) protocol was performed with slight modifications. In brief, 1 × 10⁷ cells were re-suspended in PBS and fixed with 1% formaldehyde for 10 min. Next, cells were washed 3 times with cold PBS and pelleted at 1200 rpm. The cell pellet was re-suspended in lysis buffer (50 mM HEPES–KOH (pH 7.5); 140 mM NaCl; 1 mM EDTA (pH 8); 1% SDS; 1% Triton X-100; 0.1% sodium deoxycho-late and protease inhibitors). After 10 min incubation on ice, the lysate was sonicated for 20 min (30 s on/30 s off) with Bioruptor 300, (Diagenode, Sparta, NJ 07871) to shear DNA to an average fragment size of 150–700 bp. Cell debris was pelleted and the supernatant (contain-ing chromatin) was used for immunoprecipitation (IP)—25 μg of chromatin was used in an IP experiment. Lysates containing chromatin were diluted 1:10 in RIPA buffer (50 mM mM Tris–HCl, (pH 8); 150 mM NaCl; 2 mM EDTA (pH 8); 1% NP-40; 0.1% SDS; 0.5% sodium deoxycholate and protease inhibitors), and 50 μl of chro-matin was removed to serve as input. Primary antibodies (PARP1, S2P, 4H8, 8WG16, H3K4me3, and H3K27me3) were added to the samples (10 μg per 25 μg DNA) and rotated at 4 °C for 1 h. Rabbit IgG was used for negative or non-specific background control. The pre-bound anti-body–chromatin complexes were incubated with Protein A/G Dynabeads (Thermo Fisher Scientific, Waltham, MA 02451) overnight at 4 °C with rotation in the presence of BSA (0.2 mg/ml). Using a magnetic stand for separation, all beads were washed twice with low salt buffer (0.1% SDS; 1% Triton X-100; 2 mM EDTA; 20 mM Tris–HCl (pH 8); 150 mM NaCl), then twice with high salt buffer (0.1% SDS; 1% Triton X-100; 2 mM EDTA; 20 mM Tris– HCl (pH 8); 500 mM NaCl). In addition, samples were washed twice with LiCl buffer [0.25 M LiCl; 1% NP-40; 1% sodium deoxycholate; 1 mM EDTA; 10 mM Tris–HCl (pH 8)]. Finally, specific DNA–protein complexes were eluted with 120 μl of elution buffer (1% SDS; 10 mM NaHCO3) for 15 min at 30 °C. The immunoprecipitated material and chromatin input were subjected to reverse cross-links according to Abcam X-ChIP protocol, and DNA was purified using the QIAquick PCR Purifica-tion Kit (Qiagen, Gaithersburg, MD 20878). Quantitative
real-time PCR with primers 5–6, 9–10, 13–16, 43–44 (intron 4–5), 77–78 (intron 3–4) (Additional file 1: Table S5) was used to identify the level of specific DNA fragments from the immunoprecipitated DNA. All sets of primers were designed using Integrated DNA Tech-nologies Primer Tools. Real-time, quantitative PCR (RT-qPCR) analysis was performed using CFX96 Real-Time System (Bio-Rad) with Taq DNA polymerase (MB042-EUT-10000, Syd Labs, Natick, MA 01760) and EvaGreen dye (Biotium). Reactions were performed at 25 μl and cycling parameters are as follows: 4 min at 94 °C, fol-lowed by 40 cycles of 45 s at 94 °C, 30 s at 60 °C and 60 s at 72 °C. For quality control purposes, melting curves for all samples were acquired (10 s at 95 °C and 60 s at 60 °C). For qPCR analysis, fold enrichment was measured against the IgG negative control and values were normal-ized to ChIP input.
6. Antibodies
For Western blot analysis:
Primary antibodies: PARP1 C terminal, rabbit (#39561, Active Motif, Carlsbad, CA 92008); Actin, mouse mono-clonal (MA1-744, Thermo Fisher Scientific, Waltham, MA 02451). Secondary antibodies: rabbit and mouse IgG (whole molecule); alkaline phosphatase anti-body (Sigma).
For ChIP:
PARP1, rabbit (#39561, Active Motif, Carlsbad, CA 92008); H5 (S2P), mouse monoclonal (ab24758, Abcam, Cambridge, MA 02139); 4H8 mouse monoclo-nal (ab5408, Abcam, Cambridge, MA 02139); 8WG16, mouse monoclonal (ab817, Abcam, Cambridge, MA 02139); H3K4me3, mouse monoclonal (ab1012, Abcam, Cambridge, MA, USA 02139); H3K27me3, mouse mon-oclonal (ab6147, Abcam, Cambridge, MA 02139), and for non-specificity control: Rabbit IgG (I8140; Sigma-Aldrich, St Louis, MO 63146).
7. PCR to measure isoform expression
and visualized with Typhoon FLA 9500 (GE Healthcare, Piscataway, NJ 08854). ImageQuant TL software was used to quantify cDNA signals and calculate relative iso-form expression. Splice isoiso-forms were confirmed by clon-ing the products from PCR analyses usclon-ing PCR Clonclon-ing Kit (NEB) according to the manufacturer’s protocol and sequenced by Eurofins Scientific.
8. Micrococcal (MNase) digestion of chromatin and DNA purification
Chromatin was digested at 27 °C using a predetermined concentration of MNase (Sigma-Aldrich). Digestion was stopped by adding 1/10th the volume of stop solution [10% of SDS and 0.5 mM EDTA (pH 8)]. Samples were further digested with RNAse A (Goldbio) and proteinase K (Sigma-Aldrich) to remove contaminating RNAs and proteins. DNA was finally purified as described in the Chromatin Immunoprecipitation section.
9. Nucleosome scanning analysis
The resulting purified DNA samples from MNase digestion were electrophoretically separated on 3.5% NuSieve agarose gel (Lonza), and mononucleosome-sized (140–200 bp) fragments were excised from the gel and purified using QIAquick PCR purification kit (Qia-gen). Obtained DNA was analyzed using a ‘nucleosome walking’ technique. A set of overlapping primer pairs, each of which generate 100–120 bp PCR products that are located 20–40 bp away from neighboring primer pairs (Additional file 1: Table S5, primers 17–84), was used to analyze nucleosome positions. For every primer pair, the real-time PCR results (both of DNA isolated from nucleosomes and of naked DNA digested by micrococcal nuclease) were placed on a quantitative scale by compari-son to serial dilutions of a known concentration of undi-gested genomic DNA, used as an absolute standard.
10. Genes of interest
AKAP200 (Flybase ID: FBgn0027932, symbol:
CG13388)
CAPER (Flybase ID: FBgn0031883, symbol: CG11266)
11. Net-seq 3′NT library preparation
Nascent RNA isolation was performed as described by Weber et al. [35], and cap selection was done as described by Ya-Lin Chiu et al. [58] using GFP-elF4E recombinant protein generously provided by Dr. G. Zentner, Indiana University. RNA:GFP-elF4E complexes were isolated using GFP-nAb Magnetic Agarose beads (Allele Biotech) according to the manufacturer’s pro-tocol. Sequencing library preparation for nascent RNA
samples was performed according to the Illumina Pro-tocol with slight modifications. After 3′-SR adaptor liga-tion, RNA was fragmented to 30–100 nucleotides with the RNA Fragmentation Reagent (Albion, AM8740) and purified according to Mayer et al. [36]. In order to prevent RNA fragments ligation, we performed 3′-OH phosphorylation with T4 PNK (3′ phosphatase minus) before hybridization of reverse transcription primer and 5′-SR adaptor ligation. After reverse transcription with superscript reverse transcriptase (Invitrogen), we puri-fied cDNA on 15% polyacrylamide TBE-urea gel to avoid primer dimer formation, excised the gel region between 50 and 300 nt and extracted cDNA. After PCR ampli-fication, we performed quality control (QC) and size selection. To be confident, we cloned and sequenced the PCR products using Zero Blunt TOPO PCR Cloning kit (Thermo Fisher Scientific). Positive colonies were har-vested; plasmid DNA was purified with QIAprep Spin Miniprep kit (Qiagen) and digested with EcoR1. Digested products were visualized on 1% agarose gel and sent for sequencing (Eurofins Scientific). After positive confir-mation, accumulated cDNA was sent for sequencing by HiSeq 4000 Illumina platform.
12. Processing and alignment of sequencing reads Nucleosome sequencing and analyses were done as in Matveeva et al. 2016 [5]. Details on processing and analyses of NET-seq are found in supplementary mate-rials and methods.
Additional files
Additional file 1. Supporting materials and methods section, includ‑ ing supplementary Figures 1–10 and supplementary Tables 1–6 Additional file 2. Western blot images of the full gel images found in Additional file 1: Supplementary Fig. S1
Publisher’s Note
Springer Nature remains neutral with regard to jurisdictional claims in pub‑ lished maps and institutional affiliations.
Abbreviations
Authors’ contributions
EAM, YFM conceived and designed the experiments. EAM, AQMH, and YFM performed the experiments. EAM, ECR, and YFM analyzed the data. YFM contributed reagents/materials. EAM, AQMH, ECR, and YFM wrote the paper. All authors read and approved the final manuscript.
Author details
1 Department of Molecular and Cellular Biochemistry, University of Kentucky,
Lexington, KY 40536, USA. 2 Alfaisal University, Al Maather’ Riyadh 12714, Saudi
Arabia. 3 Kentucky Biomedical Research Infrastructure Network Bioinformatics
Core, 522 East Gray Street, Louisville, KY 40292, USA. 4 Department of Com‑
puter Engineering and Computer Science, University of Louisville, Louisville, KY 40292, USA.
Acknowledgements
We are grateful for to Dr. G. Zentner, Indiana University, for providing the GFP‑elF4E recombinant protein. This work used the Genomics Sequencing Laboratory at University of Louisville for poly‑A RNA sequencing and NET‑seq sequencing. We also acknowledge the Markey Cancer Center’s Research Com‑ munications Office for manuscript editing and assistance with graphic design.
Competing interests
The authors declare that they have no competing interests.
Availability of data and materials
All data needed to evaluate the conclusions in the paper are present in the paper and/or the Supplementary Materials. Additional data related to this paper may be requested from the authors. Additionally, the raw sequencing data have been deposited in GSE118266.
Consent for publication
Not applicable.
Ethics approval
Not applicable.
Funding
This research was supported by NIH grants P20 GM103436 (ECR); 1RO1ES024478 and NSF MCB‑1517986 (YNF‑M).
Received: 21 September 2018 Accepted: 12 February 2019
References
1. Kim MY, Mauro S, Gevry N, Lis JT, Kraus WL. NAD+ ‑dependent modula‑ tion of chromatin structure and transcription by nucleosome binding properties of PARP‑1. Cell. 2004;119(6):803–14.
2. Piao L, Fujioka K, Nakakido M, Hamamoto R. Regulation of poly(ADP‑ ribose) polymerase 1 functions by post‑translational modifications. Front Biosci (Landmark Ed). 2018;23:13–26.
3. Erener S, Petrilli V, Kassner I, Minotti R, Castillo R, Santoro R, et al. Inflam‑ masome‑activated caspase 7 cleaves PARP1 to enhance the expression of a subset of NF‑kappaB target genes. Mol Cell. 2012;46(2):200–11. 4. Gibbs‑Seymour I, Fontana P, Rack JGM, Ahel I. HPF1/C4orf27 Is a PARP‑
1‑interacting protein that regulates PARP‑1 ADP‑ribosylation activity. Mol Cell. 2016;62(3):432–42.
5. Matveeva E, Maiorano J, Zhang Q, Eteleeb AM, Convertini P, Chen J, et al. Involvement of PARP1 in the regulation of alternative splicing. Cell Discov. 2016;2:15046.
6. Zhang T, Berrocal JG, Yao J, DuMond ME, Krishnakumar R, Ruhl DD, et al. Regulation of poly(ADP‑ribose) polymerase‑1‑dependent gene expression through promoter‑directed recruitment of a nuclear NAD+ synthase. J Biol Chem. 2012;287(15):12405–16.
7. Krishnakumar R, Gamble MJ, Frizzell KM, Berrocal JG, Kininis M, Kraus WL. Reciprocal binding of PARP‑1 and histone H1 at promoters specifies transcriptional outcomes. Science. 2008;319(5864):819–21.
8. Krishnakumar R, Kraus WL. PARP‑1 regulates chromatin structure and transcription through a KDM5B‑dependent pathway. Mol Cell. 2010;39(5):736–49.
9. Frizzell KM, Gamble MJ, Berrocal JG, Zhang T, Krishnakumar R, Cen Y, et al. Global analysis of transcriptional regulation by poly(ADP‑ribose) polymerase‑1 and poly(ADP‑ribose) glycohydrolase in MCF‑7 human breast cancer cells. J Biol Chem. 2009;284(49):33926–38.
10. Ogino H, Nozaki T, Gunji A, Maeda M, Suzuki H, Ohta T, et al. Loss of Parp‑1 affects gene expression profile in a genome‑wide manner in ES cells and liver cells. BMC Genom. 2007;8:41.
11. Melikishvili M, Chariker JH, Rouchka EC, Fondufe‑Mittendorf YN. Transcriptome‑wide identification of the RNA‑binding landscape of the chromatin‑associated protein PARP1 reveals functions in RNA biogenesis. Cell Discov. 2017;3:17043.
12. Schor IE, Gomez Acuna LI, Kornblihtt AR. Coupling between transcrip‑ tion and alternative splicing. Cancer Treat Res. 2013;158:1–24. 13. Schwartz S, Ast G. Chromatin density and splicing destiny: on
the cross‑talk between chromatin structure and splicing. EMBO J. 2010;29(10):1629–36.
14. Shukla S, Oberdoerffer S. Co‑transcriptional regulation of alternative pre‑mRNA splicing. Biochem Biophys Acta. 2012;1819(7):673–83. 15. Jimeno‑Gonzalez S, Reyes JC. Chromatin structure and pre‑mRNA
processing work together. Transcription. 2016;7(3):63–8.
16. Keren‑Shaul H, Lev‑Maor G, Ast G. Pre‑mRNA splicing is a determinant of nucleosome organization. PLoS ONE. 2013;8(1):e53506.
17. Schwartz S, Meshorer E, Ast G. Chromatin organization marks exon‑ intron structure. Nat Struct Mol Biol. 2009;16(9):990–5.
18. Spies N, Nielsen CB, Padgett RA, Burge CB. Biased chromatin signatures around polyadenylation sites and exons. Mol Cell. 2009;36(2):245–54. 19. Tilgner H, Nikolaou C, Althammer S, Sammeth M, Beato M, Valcarcel J,
et al. Nucleosome positioning as a determinant of exon recognition. Nat Struct Mol Biol. 2009;16(9):996–1001.
20. Ji Y, Tulin AV. Post‑transcriptional regulation by poly(ADP‑ribosyl)ation of the RNA‑binding proteins. Int J Mol Sci. 2013;14(8):16168–83. 21. Muthurajan UM, Hepler MR, Hieb AR, Clark NJ, Kramer M, Yao T, et al. Automodification switches PARP‑1 function from chromatin architectural protein to histone chaperone. Proc Natl Acad Sci USA. 2014;111(35):12752–7.
22. Verdone L, La Fortezza M, Ciccarone F, Caiafa P, Zampieri M, Caserta M. Poly(ADP‑ribosyl)ation affects histone acetylation and transcription. PLoS ONE. 2015;10(12):e0144287.
23. de la Mata M, Alonso CR, Kadener S, Fededa JP, Blaustein M, Pelisch F, et al. A slow RNA polymerase II affects alternative splicing in vivo. Mol Cell. 2003;12(2):525–32.
24. Aslanzadeh V, Huang Y, Sanguinetti G, Beggs JD. Transcription rate strongly affects splicing fidelity and cotranscriptionality in budding yeast. Genome Res. 2018;28(2):203–13.
25. Huang Y, Li W, Yao X, Lin QJ, Yin JW, Liang Y, et al. Mediator complex regulates alternative mRNA processing via the MED23 subunit. Mol Cell. 2012;45(4):459–69.
26. Monsalve M, Wu Z, Adelmant G, Puigserver P, Fan M, Spiegelman BM. Direct coupling of transcription and mRNA processing through the thermogenic coactivator PGC‑1. Mol Cell. 2000;6(2):307–16. 27. Petesch SJ, Lis JT. Overcoming the nucleosome barrier during tran‑
script elongation. TIG. 2012;28(6):285–94.
28. Kwak H, Fuda NJ, Core LJ, Lis JT. Precise maps of RNA polymer‑ ase reveal how promoters direct initiation and pausing. Science. 2013;339(6122):950–3.
29. Bowman EA, Kelly WG. RNA polymerase II transcription elongation and Pol II CTD Ser2 phosphorylation: a tail of two kinases. Nucleus. 2014;5(3):224–36.
30. Czudnochowski N, Bosken CA, Geyer M. Serine‑7 but not serine‑5 phosphorylation primes RNA polymerase II CTD for P‑TEFb recognition. Nat Commun. 2012;3:842.
31. Komarnitsky P, Cho EJ, Buratowski S. Different phosphorylated forms of RNA polymerase II and associated mRNA processing factors during transcription. Genes Dev. 2000;14(19):2452–60.
32. Lam FH, Steger DJ, O’Shea EK. Chromatin decouples promoter thresh‑ old from dynamic range. Nature. 2008;453(7192):246–50.
•fast, convenient online submission •
thorough peer review by experienced researchers in your field • rapid publication on acceptance
• support for research data, including large and complex data types •
gold Open Access which fosters wider collaboration and increased citations maximum visibility for your research: over 100M website views per year •
At BMC, research is always in progress.
Learn more biomedcentral.com/submissions
Ready to submit your research? Choose BMC and benefit from: 34. Segal E, Fondufe‑Mittendorf Y, Chen L, Thastrom A, Field Y, Moore
IK, et al. A genomic code for nucleosome positioning. Nature. 2006;442(7104):772–8.
35. Weber CM, Ramachandran S, Henikoff S. Nucleosomes are context‑ specific, H2A.Z‑modulated barriers to RNA polymerase. Molecular Cell. 2014;53(5):819–30.
36. Mayer A, di Iulio J, Maleri S, Eser U, Vierstra J, Reynolds A, et al. Native elongating transcript sequencing reveals human transcriptional activity at nucleotide resolution. Cell. 2015;161(3):541–54.
37. Ramírez F, Devon RP, Grüning B, Bhardwaj V, Kilpert F, Richter AS, et al. deepTools2: a next generation web server for deep‑sequencing data analysis. Nucleic Acids Res. 2016;44:W160–5.
38. Fong N, Brannan K, Erickson B, Kim H, Cortazar MA, Sheridan RM, et al. Effects of transcription elongation rate and Xrn2 exonuclease activity on RNA polymerase II termination suggest widespread kinetic competition. Mol Cell. 2015;60(2):256–67.
39. Flight RM, Harrison BJ, Mohammad F, Bunge MB, Moon LD, Petruska JC, et al. Category compare, an analytical tool based on feature annotations. Front Genet. 2014;5:98.
40. Dujardin G, Lafaille C, Petrillo E, Buggiano V, Gomez Acuna LI, Fiszbein A, et al. Transcriptional elongation and alternative splicing. Biochem Biophys Acta. 2013;1829(1):134–40.
41. Petesch SJ, Lis JT. Activator‑induced spread of poly(ADP‑ribose) polymer‑ ase promotes nucleosome loss at Hsp70. Mol Cell. 2012;45(1):64–74. 42. Gibson BA, Zhang Y, Jiang H, Hussey KM, Shrimp JH, Lin H, et al. Chemical
genetic discovery of PARP targets reveals a role for PARP‑1 in transcription elongation. Science. 2016;353(6294):45–50.
43. Ip JY, Schmidt D, Pan Q, Ramani AK, Fraser AG, Odom DT, et al. Global impact of RNA polymerase II elongation inhibition on alternative splicing regulation. Genome Res. 2011;21(3):390–401.
44. Close J, Xu H, De Marco Garcia N, Batista‑Brito R, Rossignol E, Rudy B, et al. Satb1 is an activity‑modulated transcription factor required for the terminal differentiation and connectivity of medial ganglionic eminence‑derived cortical interneurons. J Neurosci Off J Soc Neurosci. 2012;32(49):17690–705.
45. Shukla S, Kavak E, Gregory M, Imashimizu M, Shutinoski B, Kashlev M, et al. CTCF‑promoted RNA polymerase II pausing links DNA methylation to splicing. Nature. 2011;479(7371):74–9.
46. Schor IE, Fiszbein A, Petrillo E, Kornblihtt AR. Intragenic epigenetic changes modulate NCAM alternative splicing in neuronal differentiation. EMBO J. 2013;32(16):2264–74.
47. Saldi T, Cortazar MA, Sheridan RM, Bentley DL. Coupling of RNA Poly‑ merase II transcription elongation with pre‑mRNA splicing. J Mol Biol. 2016;428(12):2623–35.
48. Lyko F, Ramsahoye BH, Jaenisch R. DNA methylation in Drosophila mela-nogaster. Nature. 2000;408(6812):538–40.
49. Petesch SJ, Lis JT. Rapid, transcription‑independent loss of nucleosomes over a large chromatin domain at Hsp70 loci. Cell. 2008;134(1):74–84. 50. Vispe S, Yung TM, Ritchot J, Serizawa H, Satoh MS. A cellular defense path‑
way regulating transcription through poly(ADP‑ribosyl)ation in response to DNA damage. Proc Natl Acad Sci USA. 2000;97(18):9886–91. 51. Park JW, Jung S, Rouchka EC, Tseng YT, Xing Y. rMAPS: RNA map analysis
and plotting server for alternative exon regulation. Nucleic Acids Res. 2016;44(W1):W333–8.
52. Dutertre M, Sanchez G, De Cian MC, Barbier J, Dardenne E, Gratadou L, et al. Cotranscriptional exon skipping in the genotoxic stress response. Nat Struct Mol Biol. 2010;17(11):1358–66.
53. Solier S, Barb J, Zeeberg BR, Varma S, Ryan MC, Kohn KW, et al. Genome‑ wide analysis of novel splice variants induced by topoisomerase I poison‑ ing shows preferential occurrence in genes encoding splicing factors. Can Res. 2010;70(20):8055–65.
54. Brodsky AS, Meyer CA, Swinburne IA, Hall G, Keenan BJ, Liu XS, et al. Genomic mapping of RNA polymerase II reveals sites of co‑transcriptional regulation in human cells. Genome Biol. 2005;6(8):R64.
55. Jimeno‑Gonzalez S, Payan‑Bravo L, Munoz‑Cabello AM, Guijo M, Gutierrez G, Prado F, et al. Defective histone supply causes changes in RNA poly‑ merase II elongation rate and cotranscriptional pre‑mRNA splicing. Proc Natl Acad Sci USA. 2015;112(48):14840–5.
56. Aubin RJ, Dam VT, Miclette J, Brousseau Y, Huletsky A, Poirier GG. Hyper(ADP‑ribosyl)ation of histone H1. Can J Biochem. 1982;60(12):1085–94.
57. Kraus WL, Lis JT. PARP goes transcription. Cell. 2003;113(6):677–83. 58. Chiu YL, Ho CK, Saha N, Schwer B, Shuman S, Rana TM. Tat stimulates