University of New Orleans University of New Orleans
ScholarWorks@UNO
ScholarWorks@UNO
University of New Orleans Theses and
Dissertations Dissertations and Theses
5-20-2005
Information System for Environmental Technologies
Information System for Environmental Technologies
Maria del Carmen Gomez Hernandez
University of New Orleans
Follow this and additional works at: https://scholarworks.uno.edu/td
Recommended Citation Recommended Citation
Gomez Hernandez, Maria del Carmen, "Information System for Environmental Technologies" (2005). University of New Orleans Theses and Dissertations. 235.
https://scholarworks.uno.edu/td/235
INFORMATION
SYSTEM
FOR
ENVIRONMENTAL
TECHNOLOGIES
Thesis
Submitted to the Graduate Faculty of the University of New Orleans in partial fulfillment of the requirements for the degree of
Master of Science in
Computer Science
by
Maria del Carmen Gomez Hernandez
B.S, University of the Americas – Puebla, Mexico, 1998
Acknowledgements
I would like to thank to my advisor Dr. Shengru Tu, for his priceless support,
guidance and encouragement.
I want to thank the members of my committee, Dr. Eduardo Kortright and Dr.
Nauman Chaudhry, for their instruction, help and guidance on my graduate study.
I also want to express my gratitude to Joshua Chatelain and Robert Batherson for
their help and support in this project.
I am deeply grateful to Gabriel for his priceless love, enthusiasm and care.
Without his encouragement, I would never have been able to complete this degree.
Thanks Cosha for inspiring me to always give the best.
I want to thank my brothers and grandmas for all the support and care they
provided to me. Thanks Pepe, Oscar, Elenita, and Aurora for giving me the spiritual
strength when I needed it.
I would like to give the most special acknowledgment to my parents, Jose Gomez
and Carmen Hernandez, who have encouraged and guided me in my life. Their love,
prayers, care, and generosity have helped me in everything I have achieved. Thanks mom
Table of Contents
List of Figures ...iv
Abstract ...v
Chapter 1: Introduc tion... 1
Chapter 2: Background ... 4
2.1 Geographic Information Systems ... 4
2.2 Landfill project... 7
2.3 Actual process for constructing a complaints map ... 10
Chapter 3: Related Work... 14
3.1 An ArcIMS System for City Parcel Mapping. ... 14
3.2 GIS Applications to Manage and Disseminate Emissions Activity Data. ... 18
Chapter 4: System Design... 22
4.1 Web Data Collector... 23
4.2 The Model- View-Controller Architecture of the Web Map Application. ... 24
4.3 Integrate the COTS GIS Software Products into the System ... 27
Chapter 5: Implementation... 35
5.1 Technology used ... 36
5.2 Construction/Modification of layers ... 45
5.3 Web Map... 52
5.4 Automation Process ... 55
5.5 Publishing the map on Internet ... 61
5.6 Handling the Image Services. ... 68
Chapter 6: Conclusions and Future Work... 71
References ... 75
List of Figures
Figure 2.1 ArcGIS Architecture ... 6
Figure 2.2 A match of complaints with its corresponding wind direction and wind speed ... 10
Figure 2.3 Complainants Map from September to December 2004. ... 12
Figure 3.1 Viewer Application and identification results . ... 17
Figure 3.2 Example of spatial emissions activity information contained in the Atlas of the CRPAQS. ... 19
Figure 3.3 COARSE. ... 20
Figure 4.1 Architecture of the Web Data Collector. ... 24
Figure 4.2 Model View Controller Architecture... 25
Figure 4.3 MVC approach. ... 26
Figure 4.4 ArcIMS Architecture. ... 28
Figure 4.5 ArcIMS Spatial Server . ... 29
Figure 4.6 Communication with the ArcIMS Spatial server. ... 31
Figure 4.7 Directory Structure of the HTML Viewer . ... 32
Figure 4.8 Calling Sequence of the HTML viewer... 32
Figure 4.9 File Structure Directory of the HTML Viewer... 33
Figure 4.10 Sequence in which the files of our Web site are called. ... 34
Figure 4.11 Organization of the directories in our Java Viewer web application. ... 34
Figure 5.1 ArcIMS Architecture. ... 38
Figure 5.2 Java Connector Architecture. ... 40
Figure 5.3 Interaction between ArcIMS and ArcXML... 41
Figure 5.4 ArcXML configuration file basic structure. ... 43
Figure 5.5 Diagram of classes of the Java classes defined in the sde package. ... 48
Figure 5.6 Parameters of the SDE connection declared in the config properties file. ... 48
Figure 5.7 ArcIMS Author used to create a map configuration file ... 52
Figure 5.8 Structure of the template for the configuration map file. ... 54
Figure 5.9 Structure of the service map file ... 55
Figure 5.10 Diagram class of the Java classes declared in the db package. ... 57
Figure 5.11 Parameters of the database connection declared in the config properties file. ... 58
Figure 5.12 Diagram of classes defined in the util package. ... 59
Figure 5.13 The input form for the users ... 63
Figure 5.14 Our component based on the HTML Viewer. ... 65
Figure 5.15 Part of code of the viewer.jsp ... 65
Figure 5.16 Part of the code of ArcIMSparam.js ... 66
Figure 5.17 Our component based on the Java Viewer. ... 67
Figure 5.18 The code of the frame.jsp ... 67
Figure 5.19 Part of the code of the default.js file ... 68
Abstract
Geographical Information Systems (GIS) play an important role in environmental
management solutions, and they are being used with increasing frequency in
environmental studies. The use of GIS technolo gy in environmental studies provides a
better way to manage, analyze, display and share the information.
In this thesis, I automated a process for constructing GIS maps of odor complaints
and inspections that have been used to study odor complaints in the vicinity of three
landfills in Jefferson Parish. I provided an application that integrates daily environmental
observation and monitoring data into a GIS and publishes the resulting maps through the
Internet. The user’s interaction with the web-based maps does not require any GIS
expertise.
A Web-application was also implemented for managing the list of the constructed
maps. The maps are deleted or updated through the manager application, a friendly
Chapter 1: Introduction
The rise of the Internet and the World Wide Web (WWW) has created many
opportunities for those involved in GIS and decision support research [1]. A Geographic
Information System (GIS) is an automated information system that is able to compile, store,
retrieve, analyze, and display mapped data. Only a decade ago, this technology was limited to a
relatively small number of colleges, universities, and local, state, and federal agencies. Today, it
is used by government officials, natural resource and social analysts, and many others. The
increased usage of GIS in many disciplines and industries, including urban development [3, 4],
environmental research and model building, urban demographic studies, and transportation
analysis [2], has intensified in the last two decades [4,5,6].
The availability of technology, software, digital datasets and professional personnel has
enabled the expansion of GIS at all levels and in many communities [4]. Google’s satellite
service further brings GIS to every ordinary citizen. This service offers rooftop photographic
views of the United States. Users can zoom to house- level detail only for areas covering about
half the population. In those parts, Google Maps' sharp aerial images, taken by satellite, provide
street-level views of many homes, businesses and landmarks [15].
The integration of remote data into local GIS processing and the use of the Internet for
distributing the data have increased the availability of information and capabilities to remote
users. In the past decade this activity has greatly expanded, facilitated by the Open GIS
industry, and academia) and promotes the interoperability in the geographic information industry
[4, 7].
The need of the technology for coupling GIS with Web servers has encouraged GIS
vendors such as ESRI to provide products that span from the traditional GIS databases and
applications to Web publishing and global data sharing. For example, ArcGIS is one of the suite
products created by ESRI. The potential uses of such integrated GIS software are many,
including published static and dynamic maps, queries of datasets spatial and non-spatial, and the
dissemination of spatial analysis. In the GIS system, ideally the datasets are stored in the
database; they are accessed from the GIS software. This centralized data management greatly
assists web developers in making and delivering maps and data over the Internet.
In this thesis, I will report on the process of automating the integration of daily
environmental observation and monitoring data into a GIS, and the publication of the resulting
mapping by an Internet application. The environmental data consist of the odor complaints and
the inspection measurements reported relative to three landfills in Jefferson Parish. I have
integrated the tabular data into the geographical datasets and published the Web maps. These
Web maps will be used in the environmental studies and analysis for solving the odor problems
generated by landfills in Jefferson Parish.
My first goal was to provide the users with an easy way of creating Web-based maps that
visualize the odor problems generated at the landfills. The maps will give the engineers a
geographical view of the common sources of odors. This solution will also help engineers to
evaluate the effectiveness of the techniques for reducing odors and where the techniques are
My second goal was to show how the integration of tabular and geographical data with
GIS software (ArcSDE, and ArcIMS) can be used as a solution to environmental problems in
which the geographical information plays an important role.
The rest of this document is organized as follows: Chapter 2 provides the background of
the information related with this project, as well as a brief description of the ESRI products used
in our implementation. In Chapter 3, we review some related work.
In Chapter 4, we present the design that we followed in the implementation. Chapter 5
provides the details of the implementation. Finally, in Chapter 6 we present conclusions and
Chapter 2: Background
In this chapter, we will review the background of the project, Geographic Information
Systems, the investigation project of Jefferson Parish landfills and the software solution that has
been used for the studies of the odor complaint problems in the landfills.
2.1 Geographic Information Systems
A GIS is a System of computer software, hardware and data, and personnel to help
manipulate, analyze and present information that is tied to a spatial location [17]. There are five
general functions in a GIS: input, manipulation, management, query and analysis, and
visualization [16, 18].
• Input: Spatial and non-spatial data must be translated into a compatible format,
which, in the case of geographical data, often involves the digitization of analog
information such as traditional paper maps.
• Manipulation: Often necessary prior to analysis, in order to make different data
compatible.
• Management: Typically based on relational database concepts and internal reference
structures.
• Queries and analysis: The key function and strength of GIS; includes the creation of
• Visualization: GIS enables the display of maps that can be tailored to specific needs,
and be rapidly and dynamically updated.
A map in a GIS assists the viewer by relating information from different sources, which
are stored in separate layers in its dataset. The graphical information on a map is displayed as
layers, where each layer represents a particular type of feature such as streams, lakes, highways,
rivers, counties, cities, or homes. A layer may reference the data contained in various resources
such as coverages, shapefiles, geodatabases, images, and grids. The data can be stored in files or
in a GIS database [12].
GIS programs now cover a wide spectrum of complexity and cost, and many universities
and private companies offer degrees and training programs in the use of this technology. In fact,
nowadays there are many software firms such as ESRI that offer GIS services and software.
2.1.1 ArcGIS—GIS Software family from ESRI
ESRI provides software suites that span from GIS databases and desktop applications, to
web publishing and global data sharing. ESRI’s ArcGIS is an integrated collection of GIS
software products for building a complete GIS system. The key components of ArcGIS (Figure
2.1) are [19]:
• Desktop GIS—ArcGIS Desktop GIS software products are used to compile, author,
analyze, map, and publish geographic information and knowledge.
• Embedded GIS—ArcGIS Engine is a library of GIS desktop software components
• Server GIS—ArcGIS Server, ArcIMS, and ArcSDE are used to create and manage
server-based GIS applications that share GIS functionality and data within
organizations and to many other users on the Internet.
• Mobile GIS—ArcPad coupled with a wireless mobile device that is location enabled
is widely used for data collection and GIS information access in the field.
Figure 2.1 ArcGIS Architecture [19]
ArcGIS provides a framework for implementing GIS which can be deployed on a single
desktop, or be distributed on a heterogeneous computer network of workstations and servers
(including the Web), or mobile devices. Users can deploy various parts of this system to
GIS systems. This architecture, coupled with the geodatabase, gives developers the tools to
assemble intelligent geographic information systems [19].
In this thesis, I worked with two of the components of ArcGIS, ArcSDE and ArcIMS.
ArcSDE (Arc Spatial Data Engine) is the GIS gateway to relational databases. The SDE can be
used to access and manage the GIS data stored in the geodatabase; it mainly serves as an
application server that delivers spatial data to many users and applications [9]. I used ArcSDE to
integrate spatial and non-spatial data into an Oracle database.
The ArcIMS (Arc Internet Map Server) is web publishing software; it has a
well-constructed component architecture which consists of the spatial database, the application server,
the manager component, and the web server along with the ArcIMS connectors. The details of
these components will be described in Chapter 5. Using the ArcIMS, the GIS content provider
designs and publishes interactive web pages using the manager component. The manager
generates web pages that are stored in the web server. These web pages interact with the
application server in XML requests/responses [10]. I used ArcIMS in order to publish our maps
through the Internet.
2.2 Landfill project
As a result of odor complaints received, Jefferson Parish County has developed a
program to investigate and gather data relative to the odor complaints. This program has been
developed in conjunction with the management staff of the Jefferson Parish Department of
Environmental Affairs and is the result of a year- long investigation conducted by CDM, Inc.
Strategies have been implemented in an attempt to reduce landfill odors, and similar
measures have been employed successfully at other landfills throughout the country [11]. The
strategies being tested include: (1) Odor Control Management Practices, (2) Topical Application
of Odor Control Chemicals by Water Truck, and (3) Application of Chemicals via Misting
System.
In the Odor Control Management Practices a software solution has been provided by the
project team. A complaint tracking and odor monitoring information Web-based system (Web
Data Collector system) has been developed, and is now currently being utilized. This system
contains the tools for capturing the information that is stored in a database. Rather than relying
on hard copy paper forms for data recording, the system provides a much more effective method
of entering and managing data. The Web Data Collector system is currently being used by the
landfill inspectors for data entry and is used by CDM personnel for data management and
analysis.
The project team decided to develop this system for the purposes of providing:
• the landfill inspectors with an easy means of recording and submitting data to the
main CDM office in New Orleans
• an efficient means of recording and tracking odor complaints and inspections
• environmental engineers at the main office with an effective way to store, manage,
analyze, and present the recorded data.
The architecture of the system will be explained with detail in Chapter 4. There are three
sets of information being collected and maintained with the system: (1) odor complaint
Odor complaint information refers to the data recorded by the inspectors when a
complaint is received. The data recorded includes: time of complaint, complainant name,
address, contact information, odor type, and odor intensity. Odor complaint information also
includes information recorded during the response to the complaint, such as response time, odor
type, and odor readings at various locations.
The odor monitoring information refers to all data recorded on a daily basis for the odor
inspections at and around the landfills. These data include odor intensity readings at odor
checkpoints, cover inspections, sludge inspections, and chemical counter agent specifics.
The meteorological information is collected from the weather station in the scale office
located at the landfill/county is proprietary. Unfortunately, it is not currently possible to
remotely connect the Web Data Collector system to the weather station for a direct download of
the weather data, due to security issues. This problem has been solved on a monthly basis when
the weather data is manually exported from the weather station and imported into the database of
the Web Data Collector system.
The data collected with the systems is being used in a number of ways. One of the
benefits of using the system is that the database can be used in order to extract the information
based on defined criteria. One example of this would be finding the number of complaints during
given time periods. Queries have also been used to extract information in order to compare the
number of comp laints with meteorological data. Another aspect of using this system is the ability
to translate the data collected onto GIS maps. This point will be explained in the next section.
The Web Data Collector system has provided a better way to record and centralize the
information. Its database is used to generate different reports that are useful resources in the
2.3 Actual process for constructing a complaints map
The database that contains the collected information at the landfill is used as a means to
obtain different kinds of reports. A large number of types of report have been created, including
charts that represent the total number of complaints generated at a given period of time, charts
showing according to the wind speed how many complaints have been reported at a period of
time, and charts that classify the number of complaints by odor type and odor intensity.
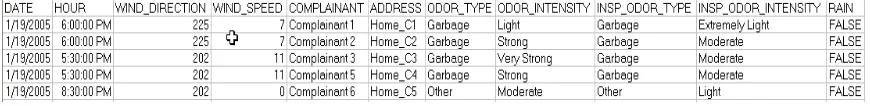
A good source for generating GIS maps is the report matching complaints with the
corresponding wind direction and wind speed at the time the compla ints were received (Figure
2.2). A GIS specialist translates this report into a GIS map, where wind vectors are drawn
according to wind direction from the perspective of the complaint locations. Although wind
direction can vary greatly, and does not always travel in a perfect straight line, this gives us some
insight about possible odor sources.
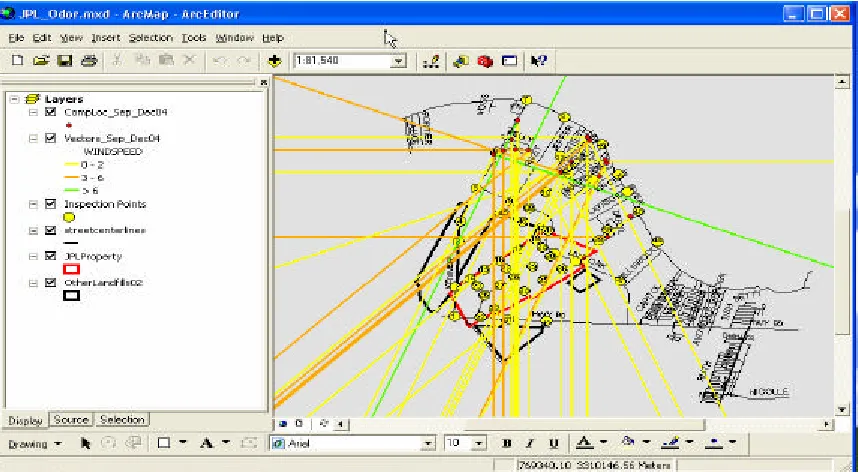
Figure 2.2 A match of complaints with its corresponding wind direction and wind speed.
In the construction of the map, the GIS specialist uses ArcView 3.x and ArcMap 9.x
tools. This technology is GIS software created by ESRI Company. ArcView 3.x is an older
version of the ESRI software; however it provides access to scripts, macros, and tools that are
sometimes not readily available for use with the current versions [8]. In ArcGIS, a map is
A map of complaints usually contains the following layers:
• Addresses – All the existent addresses in Jefferson Parish
• Jefferson Parish landfills
• Street lines – the limits of the streets in Jefferson Parish
• Addresses of the complainants – the locations of each complainant home
• Wind vectors – the lines representing the complaint and its wind direction at the
time the complaint happens
During different periods of time complainant locations will change. This makes it
necessary to create a new match of complaints, with complaint locations and wind vectors each
time a new set of complaints is needed. The rest of the layers don’t suffer any changes, they are
static. The process for creating the GIS map entails the following steps:
1. Create a match of complaints.
2. Export the result in an Excel spreadsheet file (.xls).
3. Convert the xls file in a dbf (dBase database format) file.
4. Import the dbf file into ArcMap.
5. Using the ArcMap Geocoding tool, geocode all the addresses of the complainants and
create the layer of points file (this is the layer of the complainants addresses).
Geocoding is the process of creating geometric representations for description
location [12].
6. Export the layer of complainants’ addresses file from ArcMap and import it into
7. In ArcView 3.x, run the script for drawing the wind vectors over the layer of
complainants’ addresses. The script is written in Avenue which is the object-oriented
program native to the 3x versions of ArcView [13]. This script receives as input the
layer of complainants’ addresses which contains the starting point of the vectors. The
GIS specialist indicates to the script that the attribute of the complainants’ addresses
layer to be used as the lines’ bearing is the wind speed.
8. The wind vectors are created as graphics that will be converted into a layer of lines.
9. Export from ArcView the layer of wind vectors, and import it into ArcMap.
10. Use ArcMap for creating a map with the layer of complainants’ addresses, the layer
of wind vectors, and include the static layers.
11. Save in ArcMap the project that will contain all the layers for display in the map of
complaints. The GIS map will show the match of complaints with its corresponding
Each time a complainants vector map is requested for showing a different period of time,
the steps mentioned above must be executed by the GIS specialist. He has to go back and forth
from ArcView to ArcMap many times, and has to repeat the entire process each time a new map
is needed. This makes the process very laborious and it can take multiple hours of work to
complete.
We have found that this process can be automated and this solution will give us the
benefits of: (1) completing the above steps in a few minutes, (2) publishing it on the Internet, and
(3) allowing the results to be examined by people that do not have GIS expertise. Our automation
will include the integration of tabular and geographical data with two of ESRI’s GIS products
Chapter 3: Related Work
In the Internet era, Geographical Information Systems (GIS) are often the convergence
point that integrates all kinds of spatial attribute data into the models -- the layers of information
in various themes. The layers can be superimposed upon each other, revealing complex spatial
relationships between variables. Thus, GIS have become an integral tool in many applications
including environmental management systems [16].
In this chapter we will describe two GIS projects that have been implemented by others.
They are: (1) an ArcIMS system for city parcel mapping and (2) a set of GIS applications to
manage and disseminate emissions activity data. We studied from these projects the approach
used for publishing GIS data on the Internet.
3.1 An ArcIMS System for City Parcel Mapping.
This project refers to the construction of a land parcel management application created
for the City of Winona. Using Geographic Information Systems (GIS) and other mapping
software, the Geospatial Service Center (GSC, Department of Resource Analysis, St. Mary’s
University) developed an intranet based parcel mapping system to allow all employees to access
the parcel data. The project’s goals were: (1) to implement an intranet based parcel viewing and
querying system that would allow city employees to obtain information about city parcel data;
(2) to demonstrate the effectiveness and efficiency of Internet GIS access to city officials as a
means to make city data available to the public [20].
and ArcView 3.2. They also use ArcIMS ActiveX Connector for allowing GIS data and maps to
be integrated into existing ASP applications, Microsoft’s ActiveX controls and Internet
Information Services (IIS) were also used.
The project went through the following stages:
1. identification of the data to be used
2. preparation of the data for being used in the maps
3. development of the content map
4. creation of an intranet viewer application
5. the creation of an intranet based application that includes three types of searches (the Parcel
Identification Number (PIN), owner name or address)
6. integration of the tools in a homepage
The project embraced the following specific coverages: the Winona County parcels
coverage, Winona County roads coverage, Winona City limits coverage, Winona City zoning
coverage and the Winona Rivers and Lakes coverage. These coverage files were converted into
shapefile format and used by ArcView 3.2 and ArcIMS. In addition to the GIS data, there were
three tables containing information relating to the parcels shapefile. These three tables stored the
property, legal and owner information into the database.
For preparing the data to be used in the maps, the project team used ESRI’s
Geoprocessing Wizard to clip out the parcels of the City Limits from the shapefile. Using the
Edit Tools extension, they transferred attributes from the zoning shapefile to the parcels
shapefile. The final step in data preparation included creating an image catalog of the aerial
Once the data was ready, they developed the content of the map using ArcIMS Author
tool. The data layers added to the map frame were the parcels, roads, city limits and rivers and
lakes shapefiles. The image catalog was added to the map by manually editing the map
configuration file in a text editor. Having the file configuration of the map, they create an Image
Map Service using ArcIMS Administrator tool. For the Website they used ArcIMS Designer
tool.
In the next stage of the project they created an intranet viewer application that would
allow a user to obtain parcel information by clicking on a feature button on a map. When a parcel
is clicked on a map, the Parcel Identification Number, Address, Owner Name, Legal Description,
Zoning Code and Zoning Description would be returned. In order for this to function correctly,
they required to edit the parcels shapefile several times. Using Microsoft’s Internet Information
Services Manager (IIS), a virtual directory (viewer) was created hosting the viewer data folder
Figure 3.1 Viewer Application and identification results [20].
This project also included the creation of an intranet-based application that would allow a
user to search for a parcel based on Parcel Identification Number (PIN), owner name or address.
Because three different types of searches were allowed, the Site Starters searches the application
files and extracts them to three different folders (pin, owner and address). They developed a
search application for each type of search. Finally, using Microsoft’s Internet Information
Manager (IIS), three directories were creating pointing to the three different search application
A homepage was created for integrating the viewer and the three search applications. The
homepage was also designed to create an easy to use interface and help dialog for those not
familiar with GIS.
The Winona land parcel management application is a successful GIS application. In this
project, we can see that using the applications of the ArcIMS suite and other ESRI products
developers can integrate non-spatial and spatial data, and provide GIS functionality without the
logistical costs. One of the advantages of this application is that it makes accessible the
information through the Web. This reduces the time of processing the information and gives a
more efficient service to the community. Another advantage of this application is that it does not
require the users to be GIS experts to operate the system by providing user-friendly Web pages
for the city employees. However, the access to this application is limited to an intranet where
only city employees accessed it.
3.2 GIS Applications to Manage and Disseminate Emissions Activity
Data.
The California Regional PM10/PM2.5 Air Quality Study (CRPAQS) is a multi- year
program involving meteorological and air quality monitoring, emission inventory development,
data analysis, and air quality simulation modeling. In the development of the database that
supports managing emissions activity, Sonoma Technology, Inc. (STI) gathered and processed
information from public records, commercial databases, and government sources to characterize
activity patterns throughout the CRPAQS domain. They compiled all the collected information
activity into the databases that are compatible with Geographic Information System (GIS)
software [21].
This project included the creation of an Internet application, through which all the
research teams can browse and query GIS data, logs, and an on- line archive of digital
photographs. The Internet application is called the CRPAQS On- line Atlas (Figure 3.2) with
Regional and Site-specific Events (COARSE). The COARSE application is a Web site with
interactive mapping tools and options that allow users to explore and download information from
the CRPAQS emissions activity databases. ArcIMS, was used in conjunction with the Web
programming tool ColdFusion in the development of the applications.
The CRPAQS emissions activity data collection phase involved gathering and processing
(1) short-duration emission events data that may impact CRPAQS air quality measurements and
(2) highly resolved activity data in the immediate surroundings of selected CRPAQS monitoring
sites [21].
Once the collected data were placed into ArcGIS format, processed, and to assure the
quality, the COARSE (Figure 3.3) Internet application was deployed. The COARSE Internet
application enables users to query and display emissions activity data for 24 CRPAQS
monitoring sites. The application interface includes mapping, navigation, data query tools, and
access to data archives (i.e., on- line movie archives).
Figure 3.3 COARSE [21].
The CRPAQS On- line Atlas and the COARSE applications are good examples of GIS
applications that show how GIS technology can be used in environmental studies. CRPAQS had
a well designed database of spatial and non-spatial information that ha s been used as a good
source for sharing the information through the Internet among research teams that are
responsible for the analysis and interpretations of the air quality. In COARSE, I observed that the
through the Internet. These maps disseminate the air quality information of any user chosen
locations. They are very intuitive and easy for non-GIS experts to use.
There are hundreds of GIS applications for environmental studies. I have chosen the
above two because their usage is very similar to that of our project, even though we have utilized
different technology – Java-based components. A similar feature is that the systems all
Chapter 4: System Design
The work reported in this thesis is the result of working in conjunction with the CDM
staff on a year- long investigation of odors from Jefferson Parish landfills. When I joined in this
project, a simple Web application was in place. It is called the Web Data Collector. This system
provides the landfill inspectors with an easy means of recording and submitting data to the main
CDM office in New Orleans. It is also used as an efficient means of recording and tracking odor
complaints. This Web application has been providing the environmental engineers at the main
office with an effective way to store and manage data. To support engineering analysis, the odor
complaint data were manually converted into maps using a GIS desktop application, ArcView.
Based on my experience in maintaining and enhancing the Web Data Collector system
and my studies on the GIS integration technologies, I successfully developed a solution that
automated the process of generating the odor complaint maps. Furthermore, I enhanced this
solution to include visualization of the landfill inspection data. In this work, I have combined the
information collected from the Web Data Collector and the geographical information of the area,
and generated map layers of the odor complaints and the odor inspections. In this project, I have
been using the COTS(Commercial Off-The-Shelf) GIS software products ArcIMS and ArcSDE,
in order to publish the resulting maps to the Internet and manage the digital map at the enterprise
level. The programs produced in this project are helpful in the study and analysis for finding
potential solutions to the odor problems.
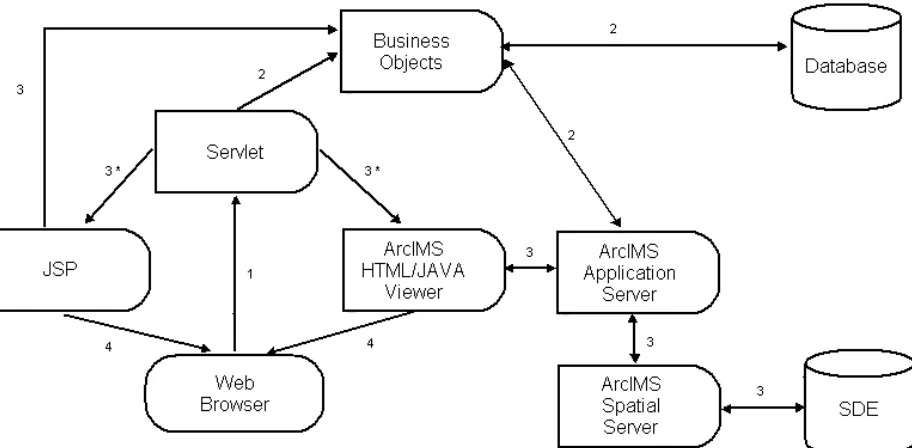
interaction of all the components of our system is reflected in our Web application. The results
are delivered to two types of viewers, the HTML Viewer and the Java Vie wer. Our design
considers the following features:
• integration of spatial and non-spatial information
• construction of a web application
• integration of the web application with the ArcIMS viewers
At the system level, my design follows the Model-View-Controller pattern that leads to its
flexibility. In this chapter, I will first describe the Web Data Collector System, and then the
architecture of my automated map service system and discuss the design decisions that led to the
system.
4.1 Web Data Collector.
The Web Data Collector consists of a database and a number of JSP forms which provide
the landfill inspectors with the ability to enter their collected information into a Web page form.
When a form is submitted by the inspectors, the JSP calls a servlet which processes the data and
inserts them into the database. The JSP forms and the servlet are deployed in an Apache
TOMCAT version 5.0 server.
The database was designed and implemented in Microsoft Access 2000. It is a typical
relational database. The data model is shown in Figure 4.1, which is in the Third Normal Form,
Loss Less-join and preserves the functional dependency. The dynamic data are inserted and
updated by a component based on JDBC. This component handles all the database
Figure 4.1 Architecture of the Web Data Collector.
4.2 The Model-View-Controller Architecture of the Web Map
Application.
The Model-View-Controller (MVC) pattern is one of the most profound and earliest one in
the software design patterns establishment. It is a widely applied in interactive applications. It
divides functionality among objects invo lved in maintaining and presenting data to minimize the
degree of coupling between the objects. The MVC pattern brings traditional application
tasks--input, processing, and output--to the graphical user interaction model. The MVC model is also
The architecture followed by the MVC pattern (Figure 4.2) divides applications into three
layers--model, view, and controller--and decouples their respective respons ibilities. Each layer
handles specific tasks and has specific responsibilities to the other areas.
• A model represents business data and business logic or operations that govern access and
modification of this business data.
• A view renders the contents of a model. It accesses data from the model and specifies
how that data should be presented. It updates data presentation when the model changes.
A view also forwards user input to a controller.
• A controller defines application behavior. It dispatches user requests and selects views
for presentation. It interprets user inputs and maps them into actions to be performed by
the model. In a Web application, user inputs are HTTP GET and POST requests to the
Web tier. A controller selects the next view to display based on the user interactions and
In our system (Figure 4.3) the “Model” Layer are corresponding to the business objects.
The business objects handle the data stored in the database, the objects managed by the ArcSDE
server, and the objects that create and manage the images services. The database stores the
non-spatial data that refers to the information recorded at one of the landfills for the odor complaints
and odor inspections. The ArcSDE server stores and manages the geographical information
associated with the odor complaints and inspections. The ArcSDE also stores all the data in the
same database (an Oracle database). These business objects are in charge of extracting and
updating the data (Section 5.4.1 provides the implementation details). The objects that work with
the image services communicate with the ArcIMS Spatial Server in order to request, add, or
remove any image service (Section 5.4.3 provides more details).
In our design, the “Controller” Layer consists of the Servlet program that handles the
users’ requests. When the Servlet gets the result from the business objects, if the result refers to
an error, then the Servlet redirects the control to the JSP. Otherwise, the Servlet invokes the
ArcIMS Viewer.
One of the characteristics of the GIS application is the complexity of the viewers. As
mentioned in the Background chapter, maps are composed of multiple Layers. The Layers can be
of images or vector data that have been rendered dynamically. To handle all the complexity
effectively, we have chosen the Leading GIS software products ArcIMS. Thus my tasks have
been shifted to integration and adaption: to collect to data sets from different resources, to
specify the data sources, to configure the viewer, and to create and activate the map services for
Web publication. For the viewer we are using two views the HTML viewer and the Java Viewer.
Once the users get into any viewer all the control is delegated to the ArcIMS Application Server
which handles all the requests related with the map displayed in the viewers.
4.3 Integrating the COTS GIS Software Products into the System
In our system, we decided to use ArcIMS for creating the maps. Using the ArcIMS Java
Connector API, we were able to establish the communication with the ArcIMS Server
Application and the ArcIMS Spatial Server in order to construct the Image Services of our maps.
We used ArcSDE to store the geographical data associated with the odor complaints and the odor
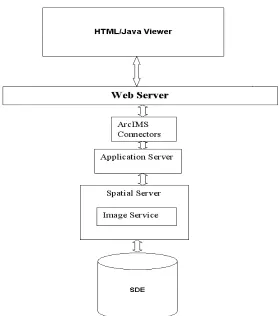
4.3.1 ArcIMS Architecture
ArcIMS is a GIS solution which allows us to build and deliver maps, data, and tools over
the Internet. ArcIMS makes it possible to share information and data with Internet users. ArcIMS
is also a flexible and scalable tool to publish maps and develop applications [10].
ArcIMS runs in a distributed environment and consists of both client and server
components (Figure 4.4). The ArcIMS HTML Viewer and the ArcIMS Java Viewer are the
client-side components. On the server side, the ArcIMS provides three different types of
services. The ArcIMS Spatial Server, the ArcIMS Application Server, and the ArcIMS
Manager, as well as the ArcIMS Application Server Connectors (for Java, ColdFusion, and
ActiveX) [10].
4.3.2 Spatial Server Architecture
The ArcIMS Spatial Server (Figure 4.5) is the backbone of ArcIMS. It processes the
requests for maps and the related information. The Spatial Server can perform seven services
such as the Image, Feature, Query, Geocode, Extract, Metadata, and Route services.
Figure 4.5 ArcIMS Spatial Server [10].
The ArcIMS Spatial Server works with multiple Spatial Services through the use of
Virtual Servers. Virtual Servers group a number of Spatial Servers together and define the types
of requests that will be processed by them. The following six Virtual Servers install with ArcIMS
are the Image, Feature, Metadata, Geocode, Query, and Extract virtual servers [10].
The Image and Feature Services are used to publish maps over the Internet. The Image
and Feature Services may appear similar in a Web browser. However, an Image Server sends
snapshots of a map to the client, while a Feature Server streams map features [10]. The choice of
the Virtual Servers depends on two factors: (1) how the developer wants to deliver the map to the
users (as images or as streamed features), and (2) the level of functionality that the developer
system creates map images that are displayed on the client’s browser. This way requires the least
configuration on the client side.
The Image Server accepts shapefiles (layers), ArcSDE, and image data. It uses
information about data layers to create complete map images. The map configuration files (the
files with .axl extension) contain the information about the map content and symbology. The
creation of an Image Service involves registration of a map configuration file with the ArcIMS
Application Server. When a user requests an Image Service, a map image is created on the
ArcIMS Spatial Server, and then sent to the client. A new map image is generated upon each
client’s request. The image can be sent to the client in one of the three formats – as a JPEG, GIF,
or PNG file [10].
Using the ArcIMS Java Connector API, I implemented a Java Bean that communicates
with the ArcIMS Application Server. Through the Application Server, we get access to the
Image Spatial Server. Once we have opened this channel of communication, our bean will be
able to request, add, or remove an Image Service (Figure 4.6). In our system each time users
request a map of complaints for a given period of time, an Image Service is called in order to
Figure 4.6 Communication with the ArcIMS Spatial server.
4.3.3 Adapt ing the ArcIMS Viewers to Our System
In the implementation of our system we decided to provide users with two different ways
for displaying a map. We use the two viewers that come with ArcIMS: the HTML Viewer and
the Java Viewer. Using ArcIMS Designer tool we constructed two Web applications: one based
on the HTML Viewer, and the other one based on the Java Viewer. In order for making these
4.3.3.1
HTML Viewer
Using ArcIMS Designer, we create output files including the HTML and JavaScript files
(.js) that form the foundation of the HTML Viewer. These files are allocated in the directory
structure depicted in Figure 4.7. The HTML files are used to deliver the Web page content; the
JavaScript functions allow for the user to interact with the map [22].
Figure 4.7 Directory Structure of the HTML Viewer [22].
For our HTML Viewer, we modified two files. Since ArcIMSparam.js is the javascript
file that contains a set of variables that affect the Web pages look and behavior, we modified it as
described in Section 5.5.2. We converted the Viewer.htm into Viewer.jsp file. The Viewer.jsp
receives as a parameter the name of the Map Image Service to display; this will let our HTML
Viewer be able to load different Image services as described in Section 5.5.2. Our HTML Viewer
calls the files showed in the sequence as Figure 4.8. The structure of the HTML viewer directory
Figure 4.9 File Structure Directory of the HTML Viewer.
4.3.3.2
Java Viewer
Using ArcIMS Designer, we create our Web site based on the Java Viewer. The default
Java Viewer is a set of HTML pages and JavaScript files. The HTML files are used to load the
component of each Web page, and to interact with the applets. The Java Viewer differs from the
HTML viewer by using Java applets to display the map, the legend, and the scale bar, and to
send requests to the ArcIMS Spatial Server [23].
In our Java Viewer, we modified three files including the default.js, map.htm, and
frame.htm. With the changes we made in these files, our Java Viewer is able to load different
Map Image Services. In the case of the frame.htm, we converted it into frame.jsp. The frame.jsp
will receive the name of the Image Service to be displayed as a parameter. It passes this datum to
the default.js and the map.htm. (Section 5.5.2 will provide more details.)
Figure 4.10 Sequence in which the files of our Web site are called.
Since our Web application is able to call different Image Services, this implies that the
directory in which resides the files of the viewer will also contain the axl file associated with the
Image Service. The map.htm file calls for the map applet (the IMSApplet). The map.htm sets the
parameters to invoke the IMSApplet including the applet name, Java version, and the
configuration (*.axl) file associated with the ImageService to load into the IMSApplet. The new
map will be displayed in our viewer. The directory of this application contains the html files, the
frame.jsp, default.js, other javascript files, and the axl files. The axl files refer to all the Image
Services that will be called us ing our modified Java Viewer. The directory structure of our Java
Chapter 5: Implementation
In this thesis work I have automated the process of creating dynamic map layers that
represent the reported odor problems around the Jefferson Parish landfills. Our approach is to
integrate the existing information into an off the shelf software (COTS) product ArcIMS and
Web maps. Users will have a Web tool in which they select the period of time that they need to
review. Once the map is displayed, they will be able to query specific information interactively.
In our system, a map consists of a number of layers and is specified by a configuration
file that makes the requests for the layers to the ArcSDE server. The map configuration file is in
the ArcXML language. Our ArcSDE server stores and manages all the map layers. The layers are
classified into static and dynamic. The static layers are those that do not change often. These
layers include the addresses, the street divisions, and the three Jefferson Parish landfills of
interest. The dynamic layers are the layers that will constantly change. Each time a user request a
map that includes a new period of time, our process will insert the information on the layers
extracted from our Oracle Database.
Having the layers specified by a configuration file, we will run the process that creates a
new ArcIMS service. In our web application users will have the option to request either an
existing map or a new map. The existing map has an ArcIMS service running on the ArcIMS
Application Server. In this case, the user can decide if he wants to regenerate the information. If
the user request is referring to a new map, the process will include extracting the information
from the database, inserting it into the layers, creating a new configuration map file, creating a
new ArcIMS service, starting the ArcIMS service, and calling up the map. This process will take
The maps can be viewed by any modern Web browser with some basic features, or by a
Java Plug- in for browsers with enhanced interactive features.
I have also provided users with a maintenance Web tool that will be used for handling the
Image Map Services. With this tool users can delete an existing map, or modify the map’s title.
The users’ interaction with the tool is very friendly and users do not require any specialized GIS
knowledge in using ArcIMS.
5.1 Technology used
In this section, I introduce the technologies used in my project.
5.1.1 ArcSDE server and Java API
ArcSDE is the ESRI GIS gateway to relational databases. SDE (Spatial Data Engine ) can
be used to access and manage the GIS data stored in the geodatabase, it mainly serves as an
application server that deliver spatial data to many users and applications [9]. SDE server is
responsible for receiving the spatial data request and serving the client request with spatial data
accordingly. SDE server also maintains the data integrity, manage the transaction and tune the
overall performance of the spatial data service [26].
ArcSDE uses standard DBMSs to define and manages geodatabases. A geodatabase is a
repository of your spatial data inside a DBMS. It contains all of your vector data, raster data,
tables, and other GIS objects. The simplest geodatabase is one that contains a number of
independent feature layers. Each feature layer can contain points, lines, polygons, or annotations
spatial relationships with other features), annotation features, and other more specialized feature
types [27].
ArcSDE server provides a set of APIs for querying and processing spatial information
[28, 29]. These include the ArcSDE Client API for C programmers and ArcSDE Client API for
Java programmers. These APIs provide GIS functions for advanced application development.
The ArcSDE Java API provides the interfaces to process and analyze spatial information.
It contains three Java packages,
1. Client package
2. Geometry package, and
3. Projection package.
Applications created with the client package can establish a connection to an ArcSDE
instance, query a layer, and otherwise communicate with an ArcSDE server. The Geometry
package contains classes that implement the OGC (Open GIS Consortium) Geometry interfaces.
The Projection package provides classes to define coordinate systems and to transform data
between different coordinate systems.
5.1.2 ArcIMS and Java Connector API
ArcIMS (Arc Internet Map Server) is a powerful Internet-based GIS tool that enables
creating and managing geography-based websites. ArcIMS (Figure 5.1) gives the solution to the
Web developers who know little about GIS by deploying the power and functionality of GIS
over the Internet [20]. ArcIMS includes the client and the server components. The client side is
consists of the ArcIMS Spatial Server, ArcIMS Application Server, the ArcIMS Manager, and
ArcIMS Application Server Connectors [10].
Figure 5.1 ArcIMS Architecture.
The HTML viewer is a lightweight viewer that allows users to interact with a map by
using a set of GIS tools [10]. It requires the least client-side processing of the ArcIMS Viewers.
The Java viewer has two versions the Java Standard Viewer and the Java Custom Viewer. These
viewers are “fat” clients. In order to use the Java Viewers on the client side, the user will have to
install a Java plug- in into the browser.
The ArcIMS Spatial Server is the backbone of ArcIMS. The spatial server can accept
map request from Internet client. The server forwards the request to ArcSDE server that will in
dataset is transmitted back to the server and the server will serve the client with a map. ArcIMS
Spatial Server performs the following services:
• Image- creates image files from maps created in either ArcIMS Author or
ArcMap
• Feature- streams map features
• Query- searches for features matching search criteria
• Geocode- performs address- matching operations
• Extract- creates shapefiles from selected map features
• Metadata-publishes metadata
• Route-calculates routes between a set of two or more stops
The ArcIMS Application Server handles incoming requests and tracks which services are
running on which ArcIMS Spatial Servers. The Application Server hands off a request to the
appropriate Spatial Server.
ArcIMS has four applications to help users create and administer web sites. They are:
ArcIMS Manager, ArcIMS Author, ArcIMS Administrator, and ArcIMS Designer. ArcIMS
Manager is a Web-based application that supports the three main tasks in ArcIMS—map
authoring, Web site design, and site administration.
The ArcIMS Application Server Connectors connect the Web server to the ArcIMS
Application Server. The ArcIMS Servlet Connector is the standard connector used with ArcIMS.
The connectors reside on the Web server computer. The Java Connector communicates with the
ArcIMS Application Server via a JSP client or a standalone Java application.
The JavaBeans and JSP tags libraries help developers to establish communication with an
ArcIMS Application Server —via an HTTP, HTTPS, or TCP/IP connection—and begin sending
ArcXML requests to it. Once the Application Server receives the request, it processes it and
returns the appropriate response [30].
Figure 5.2 Java Connector Architecture [30].
The Java Connector Object Model is a collection of server-side JavaBeans that
implement the ArcXML specification. The object model beans and their methods can be used to
implement map display functions; perform rendering and symbology; add dynamic layers; and
perform feature and spatial queries, address geocoding, projections, and metadata functions.
The Java Connector Tag Library is a collection of custom JSP tags built on the Java
Connector Object Model. This library is very helpful for those developers with little or no
knowledge of Java since they can easily develop advanced mapping applications or integrate
mapping capabilities into existing applications us ing the JSP Tag Library. Applications
5.1.3 ArcXML
ArcXML (The Arc Extensible Markup Language) is the protocol for communicating with
the ArcIMS Spatial Server. ArcXML works as a built- in map request language based on XML.
It is used to handle ArcIMS services, requests, and responses relate to each other and how they
interact with the ArcIMS Spatial Server. Figure 5.3 is a diagram showing the interaction
between the ArcIMS Spatial Server and configuration files, services, requests, and responses.
The communication to the ArcIMS server in ArcXML is performed in four steps:
Step 1. Developer creates a configuration file.
Step 2. Developer uses ArcIMS Administrator to start an ArcIMS Service on the ArcIMS
Spatial Server. The configuration file from Step 1 is the input to the service.
Step 3. The ArcIMS Spatial Server receives a request in ArcXML.
Step 4. The ArcIMS Spatial Server generates a response in ArcXML.
A map configuration file includes:
• A prolog, which is used to define the XML version and encoding.
• An ArcXML element, which is used in all ArcXML statements.
• A CONFIG element, which is used in all configuration files.
• An ENVIRONMENT element, which is used to define the locale.
• A MAP element, which is used to define the map.
The ArcXML element works as the root element of the configuration file. Its child
element is CONFIG. The only CONFIG child elements are ENVIRONMENT and MAP.
ENVIRONMENT is used to set up information about the environment used in the ArcIMS
service. Once the environment is established, clients in one locale can access a service created in
another locale [31].
Child elements of ENVIRONMENT include the following:
• LOCALE. (Required) LOCALE is used to set the country and language for the locale of
the ArcIMS site.
• UIFONT. (Required) UIFONT is used to set a default font for the dialogs in
ArcExplorer 9 and the ArcIMS Java Viewers.
• SEPARATORS. (Optional) SEPARATORS is used to denote characters to separate x,y
coordinates and coordinate pairs.
• SCREEN. (Optional) SCREEN is used to set the resolution of the screen for the
The element MAP contains all the instructions for generating a map. Its child elements
include:
• PROPERTIES. The PROPERTIES section includes the initial map extent, map units,
and current projection, as well as additional instructions used for Image Services.
• WORKSPACES. The WORKSPACES section includes the location of all the data
used to create map layers.
• LAYER. One LAYER element is used for each layer in a map. LAYER contains the
information about how the data should be symbolized.
In order to create a configuration file in ArcXML the developer has to create the file
using a basic structure (Figure 5.4), this basic structure is a template for specifying as many tag
5.1.4 Java XML APIs
The Java 2 Platform, Enterprise Edition (J2EE) is a set of APIs that provides solutions for
developing, deploying, and managing multi- tier server-centric applications. The J2EE platform
adds the capabilities necessary to provide a complete, stable, secure, and fast Java platform to the
enterprise level [32]. J2EE includes a set of packages for processing XML documents, these are:
• javax.xml.transform
• javax.xml.parsers
The javax.xml.transform package is a generic API for processing transformation
instructions, and performing a transformation from source to result. The classes included in this
package are:
• OutputKeys - Provides string constants that can be used to set output properties
for a Transformer, or to retrieve output properties from a Transformer or
Templates object.
• Transformer - An instance of this abstract class can transform a source tree into a
result tree.
• TransformerFactory - A TransformerFactory instance can be used to create
Transformer and Templates objects.
The javax.xml.parsers package provides classes allowing the processing of XML
documents. These classes support two types of parsers:
• SAX (Simple API for XML), an event-driven, serial-access mechanism for
• DOM (Document Object Model) consisting of a tree structure, where each node
contains one of the components from an XML structure. Developers can use
DOM functions for creating nodes, removing nodes, changing their contents, and
traversing the node hierarchy.
Using these two packages, developers can easily read XML files and modify them. In
this thesis work, I decided to use DOM instead of SAX because DOM provides a tree structure
of the document which makes easy modify the files.
5.2 Construction/Modification of layers
A map is a graphical presentation of geographic information [12]. The graphical
information on a map is displayed as layers, where each layer represents a particular type of
feature such as streams, lakes, highways, rivers, counties, cities, or homes. A layer may reference
the data contained in various resources such as coverages, shapefiles, geodatabases, images, and
grids. The data can be stored in files or in a GIS database. In this thesis work, we stored our
geographical information in the SDE server whose repository resides in an Oracle database.
ArcSDE serves the data openly to ArcGIS Desktop, ArcIMS, and other applications.
ArcGIS Desktop is a suite of tools that includes: ArcMap, ArcCatalog, and ArcToolBox.
ArcIMS is an Internet-based GIS tool that enables creating and managing geography-based
websites. In my work, I used two tools: (1) ArcCatalog, to connect to the SDE server for
organizing and managing our GIS data, and (2) ArcIMS, for handling our Internet-GIS based
As mentioned at the beginning of this chapter, our maps contain two types of layers, the
static layers and the dynamic layers. Each one of these types of layers requires a different
procedure to construct.
We use the ArcCatalog functionality for creating the static layers. First, we identified the
static layers. These layers include:
• SDE.UNO_SJPL_ADDRESSES. Layer of addresses, this layer contains the addresses for
all the homes in Jefferson Parish.
• SDE.UNO_SJPL_STREETCENTERLINES. Layer of street limits. The one that has the
street division lines of the addresses.
• SDE.UNO_SJPL_JPLLANDFILL. Layer of Jefferson Parish landfills.
• SDE.UNO_SJPL_OTHERLANDFILLS. Layer of landfills.
• SDE.UNO_SJPL_INSPECTIONPOINTS. Layer of inspection points.
Knowing the static layers and having their shape files, we created a connection to the SDE
server by using the option in ArcCatalog “add a connection”. With this connection, we got the
access to the SDE server and we used its option called “import a shape file” to upload each one
of the static layers. Once we have the layers in the SDE server, we can use them in our map. This
is straightforward.
On the other hand, three sets of data dynamically change. They are represented by the
dynamic layers:
• SDE.UNO_SJPL_DATEMAPLINES. The layer of the lines that represent each of the
• SDE.UNO_SJPL_COMPLAINANTSADDRESSES. The layer of the points that
represent the complainant addresses. This layer contains the addresses for all the
complainants that already exist in the database.
• SDE.UNO_SJPL_IPONOFFSIDE_MAPLINES. The layer of the lines that represent the
inspections. This layer contains the information about the odor readings recorded at the
on site and off site inspection points on a specific date. By on site points we refer to the
points that are inside one of the landfills. The off site points are those points near all the
landfills.
In the construction of the dynamic layers we use the Java SDE API which provides the
interfaces to process and analyze spatial information. I implemented a set of classes for
managing the connection to the SDE server, construction of each layer, and updating the data in
the layers. All these classes were put in a package called edu.uno.sjpl.sde . A diagram of the
classes of this package is shown in Figure 5.5. The classes are: DataLayer.java,
LayerComplainantsAddresses.java, LayerMapComplaintsLines.java, and
Figure 5.5 Diagram of classes of the Java classes defined in the edu.uno.sjpl.sde package.
The DataLayer class is a utility class. It contains the methods for connecting and
disconnecting to the SDE server, the method for constructing a layer, the method for generating
the end point of a line, and other general methods. The methods to connect and disconnect to the
SDE server do not receive any parameters since the attributes of the connection are taken from a
property file (Figure 5.6) in which all the SDE parameters of connection are declared.
The method that constructs a layer needs the following parameters: an array of the column
names of the layer, name of the table to be associated with the layer, description of the layer, and
the type of layer to construct. The type can be single line, multiple line, single points, multiple
points, polygons, and other shapes defined by ArcIMS.
The method for generating the end point of a line receives the parameters: the x value of the
start point of the line, the y value of the start point of the line, an angle, the distance of the line,
and the extent of the layer. The start points are the coordinates of the house in which a complaint
happens; the angle represents the wind direction and the distance of the line is given by the wind
speed, this data is taken from the weather information at the closest time the complaint happens;
the extent of the layer is given by the area that is going to be covered with the map.
The LayerComplainantsAddresses class has the method for inserting data into the
SDE.UNO_SJPL_COMPLAINANTSADDRESSES layer. The parameters of the method are: the
SDE connection, the layer, and a vector. This vector will contain all the new complainants
inserted in the table UNO_SJPL_COMPLAINANTSADDRESSES. When a new complainant is
created, this will be inserted in the Oracle database and in the SDE server. Nowadays, in the Web
Data Collector system each time a new complainant is created, the inspector needs to fill out a
form that contains the complainant’s data. This form will have to be modified in order to
standardize the syntax of the complainant’s address. In the actual form, the address of the
complainant is just a text area field, in which the inspector types in the address. However, when
the inspector types this data, it contains many mistakes that the address then cannot be matched
(geocoded) with an actual address in Jefferson Parish. The solution to this problem will be to
create a new form in which the address of the complainant will be taken from the table of all the
will be correct. Once the complainant information will be inserted in the database this will
already contain its geographical information for being inserted in the
SDE.UNO_SJPL_COMPLAINANTSADDRESSES layer.
The LayerMapComplaintsLines class was implemented to handle the data of the
SDE.UNO_SJPL_DATEMAPLINES. This class has the methods for inserting and deleting data
in the layer. The method that inserts the data receives the next parameters: the SDE connection,
the layer, the database connection, and both the start-date and the end-date of the complaints
period of time. Having this information the process will start. First, I query the information in
which I match the complaints with the weather information. Here, I am assuming that the
database has the up-to date information. In the query, I match each complaint with the date of the
complaint and the closest hour that it is in the weather. The result of the match will be a set of
records that contains the information of each complaint and its respective information of the
weather at the moment the complaint happens. Once I have the response from the database each
record is going to be inserted in the SDE.UNO_SJPL_DATEMAPLINES layer. Second, from
the information I get in the database response, I have the start point of the line that represents a
complaint, however for creating the line I need to create its end point. Third, the end point of
each line is created with the information of the start-point, and the wind-direction. Fourth, with
the start and end points my method creates a line and each line with its respective complaints
information is inserted in the SDE.UNO_SJPL_DATEMAPLINES layer.
The method fo r deleting has the following parameters: an SDE connection, the layer, start
date, and the end date. The deleting process is going to be executed over the data that exists in
the SDE layer. The process of this method is to execute a delete query over the
![Figure 2.1 ArcGIS Architecture [19]](https://thumb-us.123doks.com/thumbv2/123dok_us/8939167.1849015/12.612.139.474.213.531/figure-arcgis-architecture.webp)
![Figure 3.2 Example of spatial emissions activity information contained in the Atlas of the CRPAQS [21]](https://thumb-us.123doks.com/thumbv2/123dok_us/8939167.1849015/25.612.150.463.456.647/figure-example-spatial-emissions-activity-information-contained-crpaqs.webp)
![Figure 3.3 COARSE [21].](https://thumb-us.123doks.com/thumbv2/123dok_us/8939167.1849015/26.612.91.523.237.487/figure-coarse.webp)
![Figure 4.2 Model View Controller Architecture [24].](https://thumb-us.123doks.com/thumbv2/123dok_us/8939167.1849015/31.612.124.490.437.702/figure-model-view-controller-architecture.webp)
![Figure 4.4 ArcIMS Architecture [10].](https://thumb-us.123doks.com/thumbv2/123dok_us/8939167.1849015/34.612.123.485.355.584/figure-arcims-architecture.webp)
![Figure 4.5 ArcIMS Spatial Server [10].](https://thumb-us.123doks.com/thumbv2/123dok_us/8939167.1849015/35.612.159.453.194.368/figure-arcims-spatial-server.webp)