University of New Orleans University of New Orleans
ScholarWorks@UNO
ScholarWorks@UNO
University of New Orleans Theses and
Dissertations Dissertations and Theses
5-14-2010
Essays on Stock Market Liquidity and Liquidity Risk Premium
Essays on Stock Market Liquidity and Liquidity Risk Premium
Shu Tian
University of New Orleans
Follow this and additional works at: https://scholarworks.uno.edu/td
Recommended Citation Recommended Citation
Tian, Shu, "Essays on Stock Market Liquidity and Liquidity Risk Premium" (2010). University of New Orleans Theses and Dissertations. 1153.
https://scholarworks.uno.edu/td/1153
This Dissertation is protected by copyright and/or related rights. It has been brought to you by ScholarWorks@UNO with permission from the rights-holder(s). You are free to use this Dissertation in any way that is permitted by the copyright and related rights legislation that applies to your use. For other uses you need to obtain permission from the rights-holder(s) directly, unless additional rights are indicated by a Creative Commons license in the record and/ or on the work itself.
Essays on Stock Market Liquidity and Liquidity Risk Premium
A Dissertation
Submitted to the Graduate Faculty of the
University of New Orleans
in partial fulfillment of the
requirements for the degree of
Doctor of Philosophy
in
Financial Economics
by
Shu Tian
B.S. Shandong University, China, 1998
M.S. Sam Houston State University, 2005
M.S. University of New Orleans, 2008
Table of Contents
Abstract ...v
Chapter One: Introduction ...1
Chapter Two: Liquidity, Macro Factors and the U.S. Equity Flows to Emerging Markets 3 I. Introduction ...3
II. Related Literature...4
II. A. Possible Macro Factors Affecting Equity Flows...4
II. A. 1. Country Equity Market Return...4
II. A. 2. Market Openness...5
II. A. 3. Country Risk...5
II. A. 4. Trading Restrictions ...6
II. B. The Role of Liquidity ...7
III. Our Major Hypothesis...8
IV. Data...8
IV. A. Data on U.S. Equity Flows .………8
IV. B. Data on Various Macro Factors .……….8
IV. C. Measurements of Liquidity .………..10
IV. D. Summary Statistics ……….. 11
V. Methodology and Empirical Results ...16
V. A. Time-Series Cross-Section Data Analysis ...16
V. A. 1. The Model ...16
V. A. 2. Results on Control Variables ...19
V. A. 3. The Impact of Liquidity on Equity Flows ...21
V. A. 4. Does the Past Liquidity Matter? ...28
V. B. A Comparison of Short and Long-Horizon U.S. Equity Flows ...32
V. C. Dynamic Specifications ...46
VI. Conclusion and Contributions ...52
REFERENCES ………54
Table I. Summary Statistics for Various Variables, Jan. 1995 – Dec. 2002………13
Table II. The Impacts of Control Variables and Liquidity on U.S. Equity Flows...……23
Table III. Regressions with Lagged Liquidity ……….29
Table IV. Estimation of the Average Twelve-Month-Ahead U.S. Equity Flows...36
Table V. Estimation of the One-Month-Ahead U.S. Equity Flows ...41
Table VI. Estimation of a Dynamic Specification ...49
Figure 1 Monthly Foreign Equities Purchased by U.S. Investors – by country ...56
Figure 2 Monthly Foreign Equities Purchased by U.S. Investors – by region ...57
Figure 3 Monthly Foreign Market Turnover ...58
Figure 4 Monthly Foreign Market Trading Volume ...59
Figure 5 Monthly Foreign Market Price Impact ...60
Appendix...61
Table AI. Data Sources ...61
Table AII. Local Stock Markets of Fifteen Emerging Countries...62
Chapter Three: Liquidity Risk Premium Puzzle and Possible Explanations...63
I. Introduction ...63
II. A. Liquidity and Return ...64
II. B. Volatility of Liquidity...65
II. C. Liquidity Measures ...66
II. D. Behavioral Finance Arguments as Possible Explanations for the Puzzle ...67
III. Methodology and Data...68
III. A. A Model for the Relation between Excess Return and Liquidity Risk ...68
III. B. Data ...71
III. B. 1. Data Selection ...71
III. B. 2. Descriptive Statistics ...72
IV. Empirical Relations between Returns and Liquidity Risk...76
Sub-Period Results and Other Robustness Checks ...80
A Summary on Liquidity Risk Puzzle ...84
V. Potential Factors that Might Influence the Return-Liquidity Risk Relation...84
V. A. The Impact of Market Condition on the Relation between Liquidity Risk and Excess Return...84
V. B. Small vs. Large...89
V. C. The Role of Investor Sentiment...92
VI. Conclusions and Contributions...97
REFERENCES ...99
Table I. Descriptive Statistics ...74
Table II Correlation between Excess Return and Explanatory Variables...75
Table III. Regression of Excess Return on Liquidity, Liquidity Risk and Control Variables ...79
Table IV. Regression of Excess Return on Explanatory Variables for Sub-periods ...81
Table V. The Impact of Market Condition on the Puzzle...88
Table VI. The Impact of Firm Size on the Puzzle ...91
Table VII. The Impact of Investor Sentiment...95
Figure I. Time Series Plots of Liquidity Measures ...102
Appendix...104
Table A1. Regression without Liquidity Risk Measure...104
Table A2. Regression of Excess Return on the First Difference of Non-Stationary Explanatory Variables...105
Table A3. The Impact of Value Stocks on the Puzzle ...106
Abstract
This dissertation addresses issues concerning liquidity and its volatility. It consists of two essays. The first essay, “Liquidity, Macro Factors and the U.S. Equity Flows to Emerging Markets”, examines the role of liquidity on equity flows from the U.S. to fifteen emerging markets around the world. Since liquidity has many dimensions, an emphasis is placed on utilizing various measures of liquidity. Moreover, both static and dynamic analyses, as well as short and long-horizon regressions, are performed to investigate the research questions. The results suggest that a liquid market attracts flows, after controlling for market size, political openness, exchange rate and other macro factors. Additionally, evidence indicates that the importance of liquidity varies across regions. For instance in the Asian region, the relation between equity flows and volume-related liquidity is weak while that between flows and price impacts of trading is strong. Evidence also supports the relevance of macro factors such as a country’s economic freedom.
The second essay, “Liquidity Risk Premium Puzzle and Possible Explanations”,attempts to resolve the liquidity risk puzzle: a negative relation between returns and liquidity risk, documented by Chordia, Subrahmanyam, and Anshuman (2001b), by employing alternative liquidity measures and by incorporating factors that might potentially affect the relation. The main findings are as follows. The relation between stock returns and volatility of liquidity depends on the measure of liquidity. When liquidity measures are based on trading volume, the results are largely mixed, but when liquidity is measured based on price impact of trading, the relation between returns and volatility of price impacts is positive, as expected. The results are sensitive to time periods examined. Moreover, during extreme down markets, the aversion to liquidity volatility is lower, suggesting behavioral bias might potentially address the puzzle. Empirical findings also suggest that liquidity risk premium tends to be greater for small stocks. Finally, when the VIX index is included as a proxy for investor sentiment, the results indicate that the relation between returns and liquidity risk is significantly positive in four out of five liquidity measures. In sum, the empirical analysis partially but not completely addresses the puzzle.
Chapter One: Introduction
This dissertation addresses issues concerning liquidity and its volatility. It consists of two essays. One of them examines the relation between U.S. equity flows to emerging markets and various macro factors, particularly the liquidity of emerging markets. The other paper attempts to resolve the liquidity risk puzzle: a negative relation between returns and liquidity risk.
The first essay, presented in Chapter Two, is “Liquidity, Macro Factors and the U.S. Equity Flows to Emerging Markets”. Liquidity in emerging stock markets is typically low and may be a major concern to foreign investors. This essay examines the role of liquidity on equity flows from the U.S. to fifteen emerging markets around the world, for the period of 1995 to 2002. Since liquidity has many dimensions, an emphasis is placed on utilizing various measures of liquidity. Moreover, both static and dynamic analyses, as well as short and long-horizon regressions, are performed to investigate the research questions. The results suggest that a liquid market attracts flows, after controlling for market size, political openness, exchange rate and other macro factors. Additionally, evidence indicates that the importance of liquidity varies across regions. For instance in the Asian region, the relation between equity flows and volume-related liquidity is weak while that between flows and price impacts of trading is strong, reinforcing the notion that there are multiple dimensions in liquidity. Evidence also supports the relevance of macro factors such as a country’s economic freedom.
Chapter Two:
Liquidity, Macro Factors and the U.S. Equity Flows to Emerging Markets
I. Introduction
The financial crises during 1997-99 highlight the effects and importance of cross-border capital flows. Some studies attempt to examine factors that influence international equity investment flows. Aggarwal, Klapper, and Wysocki (2005) and Gelos and Wei (2005) find that equity flows and transparency are correlated, while Edison and Warnock (2003a) suggest that flows are affected by capital control and cross-border listing, controlling for macro factors such as relative stock performances. Kaminsky, Lyons, and Schmukler (2001) also provide an overview of mutual fund investments in emerging markets. They find that equity flows to emerging markets are volatile. Not emphasized in these studies is the potentially important role of liquidity on equity flows, which is somewhat surprising given that the literature on market microstructure generally indicates that liquidity has important effects on pricing, portfolio holdings, and trading1. Emerging markets are largely illiquid because of their limited access to
world capital markets. Thus, market liquidity is likely to be important from the perspective of foreign investors, which motivates this research. Specifically, we are raising the question whether liquidity also influences equity flows.
Most of the extant empirical liquidity literature focuses on the U.S. market. With the increasing availability of data regarding trading on emerging markets in recent years, researchers are able to take a closer look at the liquidity of these markets, where liquidity may be a major concern. Indeed, Lesmond (2005) indicates that liquidity varies considerably across emerging markets. Bekaert, Harvey, and Lundblad (2007) point out that trading volume based liquidity proxy in emerging markets does not predict future returns but some other liquidity measures do, while Jun, Marathe, and Shawky (2003) find a positive correlation between returns and turnover in emerging markets. These findings reinforce the idea that liquidity has many dimensions, including trading costs, trading frequency, trading intensity, and price impacts. With this in mind, we employ several measures of liquidity to determine whether foreign investors desire liquidity; if so, it should be reflected by their investment flows to emerging markets. However,
1These include, among many other studies, the seminal work by Kyle (1985) and Amihud and Mendelson (1986).
due to the unavailability of data on trading costs, our liquidity measures primarily capture trading frequency, trading intensity, and price impacts of trading. Essentially, this study also investigates whether or not the different dimensions of liquidity measures are consistently influencing equity flows.
In addition to the relation between equity flows and liquidity, this study considers the correlations between equity flows and various macro factors including market size, prior market excess returns, country’s economic freedom, capital control, changes in exchange rate, and trading restrictions. Most factors are shown by various papers to affect equity flows to emerging markets. In brief, this study is comprehensive in terms of the number of factors being considered. We expect that the above-mentioned factors, as well as liquidity, are correlated with the U.S. equity flows to emerging markets. The different measures of liquidity may result in different impacts on equity flows.
The remainder of the paper is organized as follows. The next section discusses the most related research, followed by a section describing the hypotheses. Following that, we describe the data, variables, and various measures of liquidity in Section IV. Methodology and empirical results are presented in Sections V. Section VI contains concluding remarks.
II. Related Literature
II. A. Possible Macro Factors Affecting Equity Flows II. A. 1. Country Equity Market Return
Earlier studies on equity flows to emerging markets focus on the relevance of macroeconomic variables especially stock market returns. In an early study that covers both emerging and developed countries, Bohn and Tesar (1996) document no strong relation between stock returns and equity flows. Brennan and Cao (1997) theorize that, when foreign investors face an information disadvantage, they tend to chase foreign returns; that is, buy when foreign returns are high and sell when returns are low. Using data on several emerging markets in early 1990s,2they find evidence supportive of their model. Using daily flow data from one investment firm, Froot, O’Connel, and Seasholes (2001) present evidence also consistent with flows being affected by past returns. Additionally, they document that flows have predictive power for future returns. More recently, Griffin, Nardari, and Stulz (2002) provide an empirical investigation
using daily fund flow data, which they obtain directly from exchanges from nine emerging markets. They find that equity flows are positively correlated to past host country returns as well as home country returns. That is, the evidence suggests that equity flows are both pushed and pulled by related market returns; however, the effects are relatively short-lived—present only in daily data but not so with the use of weekly data. Overall, the evidence concerning the effects of market returns are not conclusive.
II. A. 2. Market Openness
Edison and Warnock (2003b) find that flows are related to the degree of capital control, as well as economic conditions proxied by interest rates. They point out that the intensity of capital control indicates the openness to foreign investment, which in turn measures a government’s commitment to free market policies. Their evidence suggests that markets are more likely to be viable if they have less restriction imposed on foreign investors.
II. A. 3. Country Risk
Country risk, such as political risk, exchange rate movement, economic risk, etc, affects the investment climate within a country and the allocation of foreign investment. Extant literature explores various indicators for country risk and their impacts on international trading. Here we highlight country political risk, exchange rate movement, stock market transparency, investor protection, and economic freedom as components of country risk.
Erb, Harvey, and Viskanta (1996) find a link between cross-border investments and political risk and suggest that political stability is necessary to support free market development and attract and retain long-term sources of capital.
Blonigen (1997) states that exchange rates movements play an important role in influencing foreign direct investment. A country’s exchange rate regime developed by Reinhart and Rogoff (2003) is used as an indicator of whether the exchange rate is pegged, managed float, or floating.
Gelos and Wei (2005) use the Global Competitiveness Report to measure transparency3 and point out that fund inflows are on average greater in countries and in firms with a greater
3Financial transparency refers to investors’ access to truthful, accurate and relevant information on the conditions in
degree of transparency. Moreover, some studies also use accounting standards4as another proxy for transparency. For example, Aggarwal et al. (2005) utilize both country-level and firm-level data on corporate governance including accounting standards. Based on U.S. fund holdings in 2002, they find that funds tend to invest more in countries with stronger accounting standards and shareholder protections.
Partly in response to the crisis in confidence regarding corporate governance, a few recent papers examine the role of corporate governance in equity flows across countries, starting with the seminal work of La Porta, Lopez-de-Silanes, and Shleifer (1997) that establishes a link between share holdings and shareholder protection.5 Wurgler (2000) further finds that capital is more efficiently allocated in countries with better legal protection for minority investors and more firm-specific information in domestic stock returns.
Economic freedom measures country’s economic performance and the consistency of its institutions and policies. Kim (2008) points out that greater economic freedom implies fewer barriers to economic activities and tends to generate more opportunities for people and create lasting prosperity.
II. A. 4. Trading Restrictions
Both trading restrictions and liquidity are important considerations for traders that place a high value on liquidity. We consider short-selling restrictions as another important aspect for the ease of trading. Bris, Goetzmann, and Zhu (2007) present evidence that short-selling constraints affect a market’s degree of efficiency. They find that prices reflect negative information faster in countries where short-selling is practiced. In that paper, they carefully collect information about short-selling practices in various countries and construct a short-selling indicator, which we utilize here. Moreover, Ahearne, Griever, and Warnock (2004) find that the portion of a
PricewaterhouseCoopers from late 1990s and early 2000s. Morck, Yeung and Yu (2000)3show that R2and other
measures of stock market synchronicity, as alternative measures of transparency, are higher in countries with less developed financial systems and poorer corporate governance. They also point out that R2is inversely related to the
degree of investor protection.
4 Accounting standards indicate the extent to which publicly traded companies in the country utilize either US
GAAP or IAS in financial reporting, and whether the country is a member of the International Accounting Standards Council.
5Daouk, Lee and Ng (2006) further show that good governance reduces cost of capital and increases liquidity and
country’s market that has a public U.S. listing is a major determinant of a country’s weight in U.S. investors’ portfolio.
II. B. The Role of Liquidity
Some literature provides evidence that market liquidity has important effect on risk of emerging market investment and, therefore, on the future returns. As Bekaert et al. (2002) find, liquidity measure significantly predicts future returns and equity market liberalization significantly improves the level of liquidity. As a result, the increasing investment interest in emerging markets relative to developed markets yields spectacular returns, which are subject to increased risk and are significantly reduced by the increased illiquidity of trading stocks in emerging markets.
As mentioned in the introduction, studies such as Lesmond (2005) and Bekaert et al. (2007) suggest that liquidity has many dimensions. Lesmond (2005) indicates that liquidity varies considerably across emerging markets. He finds that price-based measures of liquidity are more correlated with transaction costs compared to those based on trading volume. Similarly, Bekaert et al. (2007) present evidence that trading volume based liquidity proxy in emerging markets does not predict future returns while some other liquidity measures do. In addition, Amihud (2002) measures market illiquidity as the daily ratio of absolute stock return to its dollar volume averaged over some period and points out that expected market illiquidity positively affects ex ante stock excess return, whereas Jun et al. (2003) document a positive correlation between returns and turnover in the markets for emerging countries, a puzzling result contrary to the existence of liquidity premium.
III. Our Major Hypothesis
If investors demand liquidity, then markets/stocks with greater liquidity likely will attract more attention and investments. Specifically, we hypothesize that
Emerging countries with more liquid equity market and less trading restrictions are likely to be associated with higher equity inflows from the U.S. investors. The results are expected to be robust with respect to multi-dimensions liquidity measures.
Based on previous literature, we expect the relation between equity flows and prior country market excess returns6to be positive due to trading feedback. We also expect that capital control is negatively correlated with the U.S. equity flows into emerging markets. Also, higher equity flows from U.S. to emerging markets would be associated with higher local market capitalization, greater economic freedom, and favorable exchange rate movements.
IV. Data
IV. A. Data on U.S. Equity Flows
The primary data source for the U.S. equity flows to emerging markets is the U.S. Treasury International Capital (TIC) Reporting System, which reports portfolio equity flows from the U.S. to emerging countries. The flow data is available at the monthly frequency. In this study the U.S. equity flows to a given emerging market are the U.S. residents gross purchases of foreign stocks from residents of that country scaled by the country’s GDP. Figure 1 present the U.S. equity inflows into our fifteen sample emerging countries. Obviously, equity flows vary considerably across countries. During the sample period the U.S. investors purchase a larger amount of equities from Latin America, specifically Brazil and Mexico, than from the other two regions, as shown in Figure 2.
IV. B. Data on Various Macro Factors
The data on various explanatory variables are collected from multiple sources. Table AI in Appendix provides details of data sources. Our sample7consists of fifteen emerging markets
6Edison and Warnock (2003a) find evidence that investors are chasing prospective returns, as proxied by dividend
yields, but not past returns. Moreover, the evidence on past-returns-chasing behavior is mixed. Using monthly data, Bohn and Tesar (1996) find that investors chase past returns in 7 of 22 markets.
for the period between January 1995 and December 2002. These emerging countries are classified into three subgroups based on regions: Latin America Argentina, Brazil, Chile, Mexico, and Peru, Europe, Africa, and Middle East Israel, Poland, South Africa, and Turkey, and Asia Indonesia, Malaysia, Philippines, Taiwan, Thailand, and South Korea. Due to data unavailability, data is incomplete for some variables under investigation.
The monthly data analysis includes the following control variables: country stock market size, the past excess country market return, countries’ economic freedom, capital control, exchange rate movement, and short-selling restriction. These variables are selected based on the earlier discussions of literature and described as follows:
1)Market Size: It is measured by country equity market capitalization as a percentage of country’s GDP, both denominated in current U.S. dollars. As mentioned earlier, market size can be a proxy for liquidity.
2) Prior Excess Local Stock Market Returns8: The excess return is computed by
subtracting the value-weighted return on all NYSE, AMEX and NASDAQ stocks from the local stock market return. Table AII in Appendix contains the information regarding the local stock markets of the fifteen emerging countries.
3) Country’s Economic Freedom9: The index of economic freedom is based on ten
components of economic freedom which represents openness to the global commerce, transparency, and the rule of law, and rated on a scale of zero (least free) to 100 (most free). Also, a higher score implies a lower level of government interference in the marketplace. The natural logarithm of the index is used for regression analysis.
4) Capital Control10: It represents changes in foreign ownership restriction or the intensity
of capital controls, which is presented by Edison and Warnock (2003b). The measure of capital control can vary from zero to one, with zero representing a completely open market with no restrictions, and a value of one indicating that the market is completely closed. However, their data only covers the period from January 1989 to December 2000.
8Some studies use dividend yield to estimate prior equity market performance. We use it in our annual data analysis.
Bekaert et al. (2002) use lagged excess returns (excess of the foreign market over the U.S. market) in their study.
9 Our study excludes the measure of transparency because the data on transparency is fairly limited and seldom
undated in emerging markets. Because currently the International Accounting Standards are undergoing significant revisions, we do not analyze the impact of accounting standard either.
10Because the data used to compute capital control is propriety data which is not accessible to the general public, we
5)Changes in Exchange Rate11: Presumably exchange rate movements affect U.S. capital
flows; therefore, we compute the changes in the exchange rates relative to the U.S. dollar over the past month by taking natural logarithm of the current exchange rate over the past rate, where exchange rate is stated as the number of foreign currencies per U.S. dollar.
6) Trading Restriction12: The dummy variable used here takes on the value of one when
short-selling is practiced in country and zero otherwise (either short sales are not allowed or not practiced).
IV. C. Measurements of Liquidity
To account for various liquidity dimensions, three alternative measures of liquidity are taken into account:
1) Trading Frequency13: It is denoted by market turnover, TURNOVER, which is the
ratio of the value of shares traded to the value of shares outstanding.
2) Trading Dollar Volume: We use two ways to calculate trading volume: taking natural logarithm of the value of share traded14, denoted by TRADVOL_1; the share trading value as a
percentage of country’s GDP, denoted by TRADVOL_215.
3) Price Impact: It represents the absolute monthly price change per dollar of monthly trading volume, or say, the monthly price impact of the order flow, which serves as a rough measure of price impact and reflects stock illiquidity. Following Amihud (2002), we calculate the monthly price impact for each emerging country market by dividing the absolute value of monthly stock market price changes by the dollar value traded for that month. It can be written
as: t i t i t i t i Traded Dollar p p ln | Impact rice P , 1 , , , | ) / (
, where i denotes individual country and tdenotes month.
We use three different price indexes to calculate price impact:
11Data on exchange rate regime developed by Reinhart and Rogoff (2003) is not accessible to the public.
12The number of ADR or ADR issuance can be another proxy of trading restriction, since firms in emerging
countries may be more inclined to choose to issue ADRs or GDRs. According to Aggarwal et al. (2005), we can calculate the percentage of market value of firms that issue ADRs relative to the total market value of all listed firms, or the percentage of listed firms that issue ADRs. This is left for further research if the data is accessible.
13It can also be measured by the ratio of the number of shares traded to shares outstanding. However, we do not
obtain monthly data on these two variables.
14Share trading value is the total number of shares traded multiplied by their respective prices.
15This measure is on an economy-wide basis since it gauges the positive effects of liquidity as a share of national
PRIIMPACT_1i,t is the absolute value of the International Finance Corporation’s Global (IFCG) price change over dollar value traded on month t, where IFCG index captures the return of mostly large firms, specifically it covers all publicly listed equities with float-adjusted market values of US $100 million or more and annual dollar value traded of at least US $50 million;
PRIIMPACT_2i,t is the absolute value of the International Finance Corporation’s Investable (IFCI) return over dollar value traded on month t, where IFCI represent the investable index available to foreign investors16; The difference between PRIIMPACT_1 and 2 is the
number of restricted shares (restricted from foreign investors).
PRIIMPACT_3i,t is the absolute value of return of the value-weighted composite (including all stocks) market index over dollar value traded on month t. The difference between this and measures 1 and 2 is the representation of smaller firms’ stocks.
The graphs on our measures of three dimensions of liquidity by regions are presented in Figures 3 - 5. The figures show that Asia has the highest TURNOVERand Latin America has the lowest among the three regions during our sample period. Furthermore, Latin America has larger PRIIMPACT than the other two across the sample period. These results point out that Asian market is more liquid than Latin America and Europe, Africa, and Middle East markets.
As hypothesized, the coefficients of TURNOVER, TRADVOL_1, and TRADVOL_2 are expected to be positive, and the coefficients of PRIIMPACT_1i,t, PRIIMPACT_2i,t, and
PRIIMPACT_3i,texpected to be negative.
IV. D. Summary Statistics
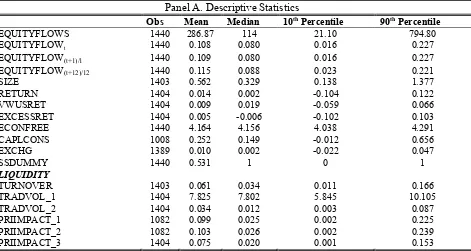
Table I Panel A reports descriptive statistics for equity flows, various control variables, and six measures of liquidity employed by this study. The average gross equity flow from the U.S. investors to the sample emerging markets is $286.87 million and the median flow is substantially lower at $114 million, suggesting that the distribution of equity flows is positively skewed. The average equity flow is 0.108 percent of country’s GDP. The mean values of one-month ahead and the average twelve-one-month-ahead equity flows are 0.109 percent and 0.115 percent of GDP, respectively. The average market size scaled by GDP is 0.562. Panel B of Table
16Edison and Warnock (2003b) suggest that for a given country the IFCG index is designed to represent the overall
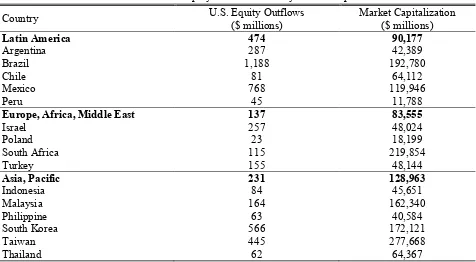
1 reports the average U.S equity flows and market capitalizations by country and regions. Although Asia has the largest market size, the U.S. investors prefer Latin American market.
The average local stock market return, the U.S. value-weighted market return on NYSE/AMES/NASDAQ, and the excess return are 1.4 percent, 0.9 percent, and 0.5 percent, respectively. The distribution of the excess return is positively skewed, and the middle 80 percent of the excess return lie between -10.2 percent and 10.3 percent, representing a spread of 20.5 percent during January 1995 and December 2002. Regarding the liquidity measures, the mean, median, and 10th and 90th percentiles are of similar magnitude for all measures of liquidity except TRADVOL_1.
The correlations17among the variables are shown in Panel C of Table 1. Most correlation coefficients confirm our expectations: the U.S. equity flows are positively correlated with market size, country stock market excess return, deregulations of short-selling restriction, turnover, and trading volumes; and negatively correlated with capital control, changes in exchange rate, and price impact. Panel D presents the correlations among the alternative measures of liquidity. As expected, TURNOVER and TRADVOL_1 and TRADVOL_2 are highly correlated but far from perfect, and these three are negatively related with PRICEIMPACT_1, PRICEIMPACT_2, and PRICEIMPACT_3.
17The correlation tables for each region are also made but not reported. With few exceptions, the correlations are of
Table I. Summary Statistics for Various Variables, Jan. 1995 – Dec. 2002
EQUITYFLOWS ($ millions) is the gross equity flows from U.S. investors to foreign markets. EQUITYFLOWt, EQUITYFLOW(t+1)/1, and EQUITYFLOW(t+12)/12 are the gross equity flows scaled by country’s GDP in a specific month t, one month ahead, and the average twelve-month ahead, respectively. SIZE is the market capitalization as a percentage of GDP. RETURN, VWUSRET, and EXCESSRETare country local stock market return, value-weight U.S. market return on NYSE/AMEX/NASDAQ, and the excess return of local stock market, respectively. ECONFREE is the natural logarithm of the index of country economic freedom. CAPLCONS is the intensity of capital controls. EXCHG is the change in exchange rate. SSDUMMY is short-selling restriction dummy variable. TURNOVER is the ratio of the value of share traded to market capitalization. TRADVOL_1 is the natural logarithm of the value of share traded. TRADVOL_2 is the value of share traded as a percentage of GDP. PRIIMPACT_1 is the absolute value of the IFCG price change over dollar value traded. PRIIMPACT_2 is the absolute value of the IFCI price change over dollar value traded. PRIIMPACT_3 is the absolute value of local stock market price change over dollar value traded.
Table I. Panel A reports the descriptive statistics for U.S. equity flows, various control variables, and liquidity measures. The sample period is from January 1995 to December 2002.
Panel A. Descriptive Statistics
Obs Mean Median 10thPercentile 90thPercentile
EQUITYFLOWS 1440 286.87 114 21.10 794.80
EQUITYFLOWt 1440 0.108 0.080 0.016 0.227
EQUITYFLOW(t+1)/1 1440 0.109 0.080 0.016 0.227
EQUITYFLOW(t+12)/12 1440 0.115 0.088 0.023 0.221
SIZE 1403 0.562 0.329 0.138 1.377
RETURN 1404 0.014 0.002 -0.104 0.122
VWUSRET 1404 0.009 0.019 -0.059 0.066
EXCESSRET 1404 0.005 -0.006 -0.102 0.103
ECONFREE 1440 4.164 4.156 4.038 4.291
CAPLCONS 1008 0.252 0.149 -0.012 0.656
EXCHG 1389 0.010 0.002 -0.022 0.047
SSDUMMY 1440 0.531 1 0 1
LIQUIDITY
TURNOVER 1403 0.061 0.034 0.011 0.166
TRADVOL_1 1404 7.825 7.802 5.845 10.105
TRADVOL_2 1404 0.034 0.012 0.003 0.087
PRIIMPACT_1 1082 0.099 0.025 0.002 0.225
PRIIMPACT_2 1082 0.103 0.026 0.002 0.239
PRIIMPACT_3 1404 0.075 0.020 0.001 0.153
Table I. Panel Bpresents the average U.S. equity flows in millions of dollars to each emerging market and region, and the average market capitalization in millions of dollars of each country and region during January 1995 and December 2002
Panel B. U.S. Equity Flows vs. Country Market Cap.
Country U.S. Equity Outflows ($ millions)
Market Capitalization ($ millions)
Latin America 474 90,177
Argentina 287 42,389
Brazil 1,188 192,780
Chile 81 64,112
Mexico 768 119,946
Peru 45 11,788
Europe, Africa, Middle East 137 83,555
Israel 257 48,024
Poland 23 18,199
South Africa 115 219,854
Turkey 155 48,144
Asia, Pacific 231 128,963
Indonesia 84 45,651
Malaysia 164 162,340
Philippine 63 40,584
South Korea 566 172,121
Taiwan 445 277,668
Thailand 62 64,367
Table I. Panel Creports the panel data correlation coefficients between equity flows and the various explanatory variables. Panel C. Correlations
EQUITYFLOWt EQUITYFLOW(t+12)/12 EQUITYFLOW(t+1)/1 SIZE EXCESSRET ECONFREE CAPLCONS EXCHG SSDUMMY EQUITYFLOW(t+12)/12 0.53
EQUITYFLOW(t+1)/1 0.58 0.60
SIZE 0.24 0.26 0.25
EXCESSRET 0.02 0.09 0.05 -0.01
ECONFREE -0.04 -0.03 -0.03 0.27 -0.07
CAPLCONS -0.16 -0.10 -0.15 -0.11 -0.01 -0.01
EXCHG -0.02 -0.06 -0.04 -0.04 -0.01 -0.05 -0.01
SSDUMMY 0.19 0.24 0.21 0.04 0.08 -0.42 -0.10 0.01
TURNOVER 0.06 0.12 0.04 0.08 0.02 0.23 0.43 -0.03 -0.28
TRADVOL_1 0.30 0.38 0.29 0.33 0.05 -0.05 0.44 -0.05 0.02
TRADVOL_2 0.17 0.23 0.16 0.40 0.03 0.29 0.33 -0.04 -0.23
PRIIMPACT_1 -0.21 -0.26 -0.19 -0.23 -0.04 0.09 -0.20 0.15 -0.14
PRIIMPACT_2 -0.21 -0.25 -0.19 -0.23 -0.03 0.09 -0.21 0.14 -0.14
PRIIMPACT_3 -0.19 -0.22 -0.17 -0.21 0.05 0.08 -0.21 0.05 -0.14
Sources: Data sources are reported in Table A1 of Appendix.
Table I. Panel Dreports the correlation coefficients among the alternative measures of liquidity. Panel D. Correlation among Liquidity Measures
TURNOVER TRADVOL_1 TRADVOL_2 PRIIMPACT_1 PRIIMPACT_2 PRIIMPACT_3
TURNOVER 1
TRADVOL_1 0.73 1
TRADVOL_2 0.90 0.70 1
PRIIMPACT_1 -0.18 -0.49 -0.17 1
PRIIMPACT_2 -0.18 -0.50 -0.17 1.00 1
PRIIMPACT_3 -0.17 -0.48 -0.16 0.75 0.75 1
V. Methodology and Empirical Results
V. A. Time-Series Cross-Section Data Analysis V. A. 1. The Model
As mentioned earlier, this study focuses on the impact of various macro factors, especially liquidity, on the U.S. equity flows into emerging markets. We conduct a time series-cross section data18framework which allows us to analyze time series properties of the data and
identify individual country effects. The country effect model that we estimate is of the following type:
it i it M
k
it k k
it X LIQUID
y
1
, (1)
where
o yit denotes the U.S. equity flows of country iat time t; i=1, 2, … Nis a country index; t=1,2,…,Tis a time index.
o Xk,itdenotes the explanatory variables including control variables of country iat time t;k = 1, 2, …M the number of explanatory variables.
The control variables include various macro factors: market size SIZEi, t, prior foreign stock market excess returns EXCESSRETi, t-1, country economic freedom ECONFREEi,t, capital control CAPLCONSi, t, change of exchange rate EXCHGi, t, and the dummy variable on short-selling restriction SSDUMMYi, t
o LIQUIDitdenotes the alternative measures of liquidity of country iat time t;
Alternative measures of liquidity are trading frequency TURNOVERi,t, dollar trading volume TRADVOL_1i,t andTRADVOL_2i,t, and price impact PRIIMPACT_1i,t, PRIIMPACT_2i,t, and PRIIMPACT_3i,t
o βkand γ denotethe coefficients of Xk,itand LIQUIDit, respectively. We assume that βkand γare the same from one country to the next.
o α is the intercept
o itis the combined time series and cross-country error component, or the
observation-specific errors.
18Our panel data is unbalanced (some countries do not have data for one or more months, or not all countries have
o i is an unobserved variable and varies across countries but not over time. The
country-specific effects can be treated as fixed or as random. With the fixed-effect model, i is
assumed to be correlated with the regressors and represents the country-specific
characteristics19, and i is the intercept specific for each country. With the
random-effect model, iis assumed to be uncorrelated with the regressors and represents the
country-specific error component i.e., differences across countries are captured through
the disturbance term, and i it is the error term, where ~ (0, 2)
i IID and
) , 0 (
~ 2
v
it IID
.
Since each country has its own individual characteristics that may influence or bias some or all the explanatory variables and/or the predicted equity inflows, the pooled OLS regression model may yield biased coefficients because it does not account for those unobservable time-invariant20country-specific characteristics. We use a Fixed-Effect (FE) estimation21 approach to
verify whether the inclusion of country-specific characteristics in the model is valid. F-tests of the presence of country-specific effects reject the null hypothesis that alli shown in Table
II. Therefore, the time series-cross section data are not poolable with respect to country.
To decide which estimation, fixed or random effects, is superior to the other, we further perform a Hausman test22. The results are reported in Table II, indicating that the fixed-effect is
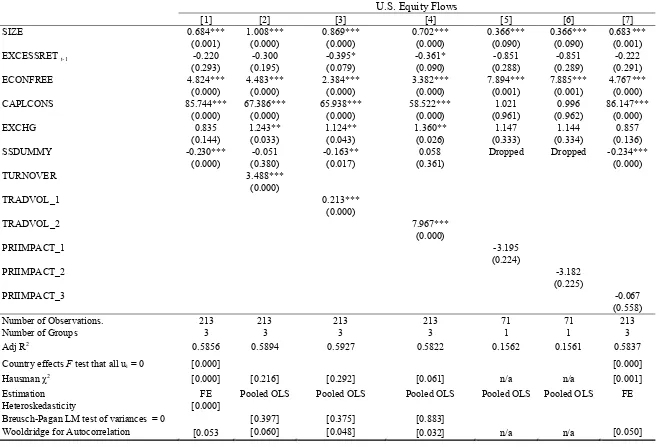
an appropriate estimator for all regression models in the full sample and Latin America, the models (1) and (7) in Europe, Africa, and Middle East sample, and the models (1) – (4) and (7) in Asia samples. Thus, we use random-effect estimation for the other models. However, we use the OLS estimation for the models (5) and (6) in Europe, Africa, and Middle East sample, because the data on the liquidity measures of PRIIMPACT_1 and PRIIMPACT_2 are only
19Time-invariant country characteristics (fixed effects), such as culture, language, geography and demographics,
may be correlated with the explanatory variables. National policies, federal regulations, and international agreements, may change over time but not across countries.
20We assume that the country-specific characteristics are time-invariant.
21It is equivalent to the least square dummy variable (LSDV) estimation, where the test associated with individual
group is the test that all of the dummy variables are zero
22Hausman test: the null hypothesis is that the preferred model is random effects and the alternative is the fixed
effects (Greene, 2000) or the unique errors (ui) are correlated with the regressors. If the null is rejected, then the RE
available for one country. We also test if cross-sectional variances23 equal to zero for those
models estimated by random-effects. The p-values reject the null for models (5) and (6) in Asia sample, meaning that there are country-specific error component. The p-values are not rejected for models (2) to (4) in Europe, Africa, and Middle East sample, indicating that there is no individual effect for these three models and the pooled regression model is appropriate.
Modified Wald test for groupwise heteroskedasticity24 in the residuals of the fixed-effect model is also performed reported in Table II. The null hypothesis is constant variance for all countries. The rejected null indicates that the error variances are specific to the individual country. Therefore, we need to control for the effects of the unobserved heteroskedasticity for both fixed and random-effects by adjusting the regression standard errors for clustering on country.
In addition, we perform Wooldridge test25 for autocorrelation in our time series-cross sectional data. The null hypothesis of no serial correlation for models is rejected in the full sample and Latin America sample, as well as models (3), (4), and (7) in Europe, Africa, and Middle East sample and models (5) and (6) in Asia sample at the 5 percent significant level. The p-value is reported in Table II where we can see that with very few exceptions, most test statistics are not highly significant. Basically, there is no serial correlation in models (1) and (2) for Europe, Africa, and Middle East sample. For Asia sample, there is no serial correlation for all models except models (5) and (6). The serial correlation test indicates that for some of the sample countries the errors within countries are correlated across time. Therefore, we also compute Newey-West (1987) standard errors to control for both heteroskedasticity and serial correlation. The results indicate that there is a very slight difference between the robust standard errors mentioned earlier and the Newey-West standard errors, and the difference does not affect the statistical significance of each coefficient; consequently we only report robust standard errors in Table II.
23 The Breusch-Pagan Lagrange multipliers test helps us on the selection of the appropriate model (pooled vs.
individual effects). If the null of cross-sectional variance of iequals to zero:2 0 is not rejected, the pooled regression model is appropriate. We also test if the variance components for time are zero. The null is rejected at 5 to 10 percent significance levels.
24The modified Wald test allows for unbalanced panels (as ours).
25 It is a test for serial correlation in linear panel data models. The null hypothesis is the residuals from the
V. A. 2. Results on Control Variables
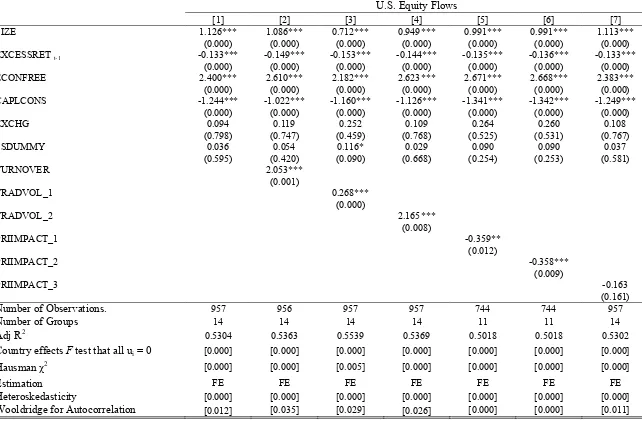
Table II four panels shows, separately, the regression results for full sample, Latin America sample, Europe, Africa, and Middle East sample, and Asia sample. For each individual panel, we perform seven regression models, each with a different measure of liquidity except for model (1) which only includes control variables.
The coefficient of SIZEis significantly positive in all models except models (3) and (4) in the Latin America sample. It is consistent with the notion that a larger market likely attracts more investors. As mentioned earlier, SIZE may proxy for liquidity to some extent, since larger markets also tend to be more liquid. To the extent this argument is true, the results on SIZEis in agreement with the hypothesis that a more liquid market attracts more equity flows.
Based on the result on EXCESSRETt-1, there appears to be no evidence supporting return chasing behavior: among all four samples, only six models in Asia sample indicate a positive but insignificant coefficient. Interestingly, the coefficient of EXCESSRETt-1 is negative and statistically significant in all models of the full sample and Latin America sample, as well as in models (3) and (4) of Europe, Africa, and Middle East sample. Also, the coefficients are remarkably close across samples. EXCESSRETt-126 here is the past excess country stock market return over the U.S. value-weighted stock market return. The empirical evidence indicates that a decrease in the past excess return of emerging stock market,especially in Latin America market, leads to an increase in immediate purchases of foreign equities by the U.S. investors. This suggests that some investors behave more like contrarians than momentum chasers. While this appears to be inconsistent with previous studies, investors’ strategies might depend on the time horizon since Griffin et al. (2002) indicate that return-chasing behavior is short-lived. It should be noted that the standard deviation, skewness, and kurtosis27of EXCESSRET for Latin America sample are much larger than those for the other two regions. Also, we suspect that some unobserved variables, such as geographic preference, may correlate with one or some of explanatory variables, e.g.,EXCESSRET.
The impact of country market economic freedom, ECONFREE, on equity flows is positive and statistically significant in all models of the full sample and both Latin America and
26Analysis was also performed in sub-periods, but not reported. Except the coefficients on excess return, others
remain largely unchanged for sub-periods.
Europe, Africa, and Middle East samples. This result is consistent with our expectation that equity flows are larger for the country with more economic freedom. However, for the Asian sample, the coefficient of ECONFREE is negative but insignificant. We check the correlations between ECONFREE and other explanatory variables for the Asian sample and do not see any correlation more than 0.3. Thus, the counter-intuitive result on ECONFREEin the Asian market is unlikely to be caused by multicollinearity. Overall, economic freedom of emerging countries, particularly those in Latin America and Europe, Africa, and Middle East, plays a significant role in attracting foreign equity inflows.
As for CAPLCONS, its coefficient is significantly negative in all models for the full sample, Latin America, and Asia samples, which is consistent with our expectation. However, in models (1) to (4) and (7) of Europe, Africa, and Middle East sample, the coefficient of CAPLCONShas a positive and statistically significant value. It should be noted that the region of Europe, Africa, and Middle East includes relatively fewer countries and some data is lacking for a couple of countries there. These may affect the estimates for CAPLCONSin that region. With the exception of this region, our evidence in general indicates that a loosening of foreign ownership restriction expands the investment opportunity and leads to an increased purchases of foreign equity by U.S. investors.
As mentioned earlier, foreign investors should prefer an emerging market where short selling is allowed; hence a positive relation between short selling dummy and equity flows is expected. Our evidence indicates that the impact of short-selling practice varies across regions: the coefficient for SSDUMMY is positive for all models in the full sample and Latin America, and is statistically significant in Latin America sample. For both Europe, Africa, and Middle East sample and the Asian sample, the impact is negative and statistically significant for some models. Since the data on short-selling is very limited, we should not surprise for the mixed results.
V. A. 3. The Impact of Liquidity on Equity Flows
We now turn to the focus of our paper, the relation between liquidity and equity flows in emerging markets.
As a measure of trading frequency, TURNOVERin model (2) has a positive sign in both full sample and three regional samples, and its coefficients are statistically significant at 1 percent level, except in Asia sample. As an illustration, with every 1 percent increase in TURNOVER, the equities purchased by the U.S. investors increased about 12.85 percent of a country’s GDP in Latin America and 3.49 percent in Europe, Africa, and Middle East during January 1995 and December 2000. Figure 3 also displays that except South Korea and Taiwan, other sample countries maintain a steady TURNOVERratio across the sample time. Intuitively, a higher TURNOVERratio signals lower transactions costs of the local equity market. That is, U.S. investors prefer a more stable, cheaper, and easier market.
prefer an active emerging stock market and would purchase foreign equities from a market that they have confidence in.
Models (5), (6), and (7) use price impact to measure liquidity. We calculate PRIIMPACT_1, PRIIMPACT_2, and PRIIMPACT_3 based on three different price indexes to measure the absolute price change per dollar of monthly trading volume. The coefficients on PRIIMPACT_1 and PRIIMPACT_2 are negative for all but the Latin America sample. They are statistically significant for both full sample and the Asian sample, as we hypothesize that investors desire deeper markets with lower degree of price impacts, or the market with lower price change in terms of one dollar of trading volume. The exception is in Latin America sample where the coefficients are positive but insignificant. The descriptive statistics28 of PRIIMPACT_1 and PRIIMPACT_2 across countries indicate that Argentina and Peru have very volatile price impact over the sample period. Thus, the individual country characteristics may affect the estimation. As for PRIIMPACT_3, its coefficient is negative, which is consistent with our expectation, for all four samples, but not statistically significantly.
As a summary, the overall evidence regarding the effects of liquidity supports our hypotheses. The importance of different dimensions of liquidity varies across regions. For example in the Asian region, the relation between equity flows and volume-related liquidity is weak while that between flows and price impacts of trading is quite strong. This reinforces the notion that there are multiple dimensions in liquidity.
Table II. The Impacts of Control Variables and Liquidity on U.S. Equity Flows
Table II includes four Panels A – D presenting estimation results for full sample, Latin America sample, Europe, Africa, and Middle East sample, and Asia sample, respectively. For each panel, seven regression models [1] – [7] are estimated, each with a different measure of liquidity except for model [1] which only includes control variables. In regressions [2] to [7], liquidity is measured by TURNOVER, TRADVOL_1, TRADVOL_2, PRIIMPACT_1, PRIIMPACT_2, and PRIIMPACT_3, respectively. All regressions are estimated over the period from January 1995 to December 2002.
The dependent variable, yit, in fixed country effect estimation is the U.S. equity inflow into country i at month tscaled by country i’s GDP:
it i it M
k
it k k
it X LIQUID
y
1
,
it k
X , denotes the control variables including SIZE, EXCESSRETt-1, ECONFREE, CAPLCONS, EXCHG, and SSDUMMY. All explanatory
variables are at month t, except EXCESSRET, the excess return of country equity market of a period t-1. SIZEis market size. ECONFREEis the natural logarithm of the index of economic freedom. CAPLCONSis the capital control. EXCHGis the change in exchange rate. SSDUMMYis the dummy equal to 1 if shorting-selling is allowed in stock market.
it
LIQUID denotes the alternative liquidity measure: TURNOVERis the ratio of value of share traded over market capitalization; TRADVOL_1 is the natural logarithm of the value of share traded; TRADVOL_2 is the value of share traded as a percentage of GDP; PRIIMPACT_1 is the absolute value of the IFCG price change over dollar value traded; PRIIMPACT_2 is the absolute value of the IFCI price change over dollar value traded; PRIIMPACT_3 is the absolute value of local stock market price change over dollar value traded.
Table II. Panel A. Full Sample
U.S. Equity Flows
[1] [2] [3] [4] [5] [6] [7]
SIZE 1.126*** 1.086*** 0.712*** 0.949*** 0.991*** 0.991*** 1.113***
(0.000) (0.000) (0.000) (0.000) (0.000) (0.000) (0.000) EXCESSRET t-1 -0.133*** -0.149*** -0.153*** -0.144*** -0.135*** -0.136*** -0.133***
(0.000) (0.000) (0.000) (0.000) (0.000) (0.000) (0.000)
ECONFREE 2.400*** 2.610*** 2.182*** 2.623*** 2.671*** 2.668*** 2.383***
(0.000) (0.000) (0.000) (0.000) (0.000) (0.000) (0.000) CAPLCONS -1.244*** -1.022*** -1.160*** -1.126*** -1.341*** -1.342*** -1.249***
(0.000) (0.000) (0.000) (0.000) (0.000) (0.000) (0.000)
EXCHG 0.094 0.119 0.252 0.109 0.264 0.260 0.108
(0.798) (0.747) (0.459) (0.768) (0.525) (0.531) (0.767)
SSDUMMY 0.036 0.054 0.116* 0.029 0.090 0.090 0.037
(0.595) (0.420) (0.090) (0.668) (0.254) (0.253) (0.581)
TURNOVER 2.053***
(0.001)
TRADVOL_1 0.268***
(0.000)
TRADVOL_2 2.165***
(0.008)
PRIIMPACT_1 -0.359**
(0.012)
PRIIMPACT_2 -0.358***
(0.009)
PRIIMPACT_3 -0.163
(0.161)
Number of Observations. 957 956 957 957 744 744 957
Number of Groups 14 14 14 14 11 11 14
Adj R2 0.5304 0.5363 0.5539 0.5369 0.5018 0.5018 0.5302
Country effects Ftest that all ui= 0 [0.000] [0.000] [0.000] [0.000] [0.000] [0.000] [0.000]
Hausman χ2 [0.000] [0.000] [0.005] [0.000] [0.000] [0.000] [0.000]
Estimation FE FE FE FE FE FE FE
Heteroskedasticity [0.000] [0.000] [0.000] [0.000] [0.000] [0.000] [0.000]
Table II. Panel B. Latin America
U.S. Equity Flows
[1] [2] [3] [4] [5] [6] [7]
SIZE 2.246*** 2.265*** 0.795 0.903 2.261*** 2.263*** 2.222***
(0.000) (0.000) (0.206) (0.179) (0.001) (0.000) (0.000)
EXCESSRET t-1 -0.114*** -0.108*** -0.113*** -0.107*** -0.115*** -0.115*** -0.114***
(0.000) (0.000) (0.000) (0.000) (0.000) (0.000) (0.000)
ECONFREE 2.947*** 2.911*** 3.913*** 3.012*** 2.946*** 2.947*** 2.946***
(0.001) (0.001) (0.000) (0.000) (0.002) (0.002) (0.002)
CAPLCONS -2.530** -2.696*** -2.307** -2.464*** -2.521** -2.521** -2.540**
(0.014) (0.004) (0.014) (0.008) (0.014) (0.014) (0.014)
EXCHG -0.451 -0.402 -0.182 -0.243 -0.453 -0.453 -0.447
(0.430) (0.462) (0.741) (0.644) (0.427) (0.427) (0.436)
SSDUMMY 0.3442** 0.634*** 0.699*** 0.523*** 0.344** 0.344** 0.345**
(0.017) (0.000) (0.000) (0.001) (0.017) (0.017) (0.017)
TURNOVER 12.845***
(0.000)
TRADVOL_1 0.526***
(0.000)
TRADVOL_2 53.440***
(0.000)
PRIIMPACT_1 0.024
(0.903)
PRIIMPACT_2 0.025
(0.892)
PRIIMPACT_3 -0.046
(0.777)
Number of Observations. 330 329 330 330 330 330 330
Number of Groups 5 5 5 5 5 5 5
Adj R2 0.3592 0.3945 0.4184 0.4087 0.3572 0.3572 0.3573
Country effects Ftest that all ui= 0 [0.000] [0.000] [0.000] [0.000] [0.000] [0.000] [0.000]
Hausman χ2 [0.000] [0.000] [0.000] [0.000] [0.000] [0.000] [0.000]
Estimation FE FE FE FE FE FE FE
Heteroskedasticity [0.000] [0.000] [0.000] [0.000] [0.000] [0.000] [0.000]
Table II. Panel C. Europe, Africa, and Middle East U.S. Equity Flows
[1] [2] [3] [4] [5] [6] [7]
SIZE 0.684*** 1.008*** 0.869*** 0.702*** 0.366*** 0.366*** 0.683***
(0.001) (0.000) (0.000) (0.000) (0.090) (0.090) (0.001)
EXCESSRET t-1 -0.220 -0.300 -0.395* -0.361* -0.851 -0.851 -0.222
(0.293) (0.195) (0.079) (0.090) (0.288) (0.289) (0.291)
ECONFREE 4.824*** 4.483*** 2.384*** 3.382*** 7.894*** 7.885*** 4.767***
(0.000) (0.000) (0.000) (0.000) (0.001) (0.001) (0.000)
CAPLCONS 85.744*** 67.386*** 65.938*** 58.522*** 1.021 0.996 86.147***
(0.000) (0.000) (0.000) (0.000) (0.961) (0.962) (0.000)
EXCHG 0.835 1.243** 1.124** 1.360** 1.147 1.144 0.857
(0.144) (0.033) (0.043) (0.026) (0.333) (0.334) (0.136)
SSDUMMY -0.230*** -0.051 -0.163** 0.058 Dropped Dropped -0.234***
(0.000) (0.380) (0.017) (0.361) (0.000)
TURNOVER 3.488***
(0.000)
TRADVOL_1 0.213***
(0.000)
TRADVOL_2 7.967***
(0.000)
PRIIMPACT_1 -3.195
(0.224)
PRIIMPACT_2 -3.182
(0.225)
PRIIMPACT_3 -0.067
(0.558)
Number of Observations. 213 213 213 213 71 71 213
Number of Groups 3 3 3 3 1 1 3
Adj R2 0.5856 0.5894 0.5927 0.5822 0.1562 0.1561 0.5837
Country effects Ftest that all ui= 0 [0.000] [0.000]
Hausman χ2 [0.000] [0.216] [0.292] [0.061] n/a n/a [0.001]
Estimation FE Pooled OLS Pooled OLS Pooled OLS Pooled OLS Pooled OLS FE
Heteroskedasticity [0.000]
Breusch-Pagan LM test of variances = 0 [0.397] [0.375] [0.883]
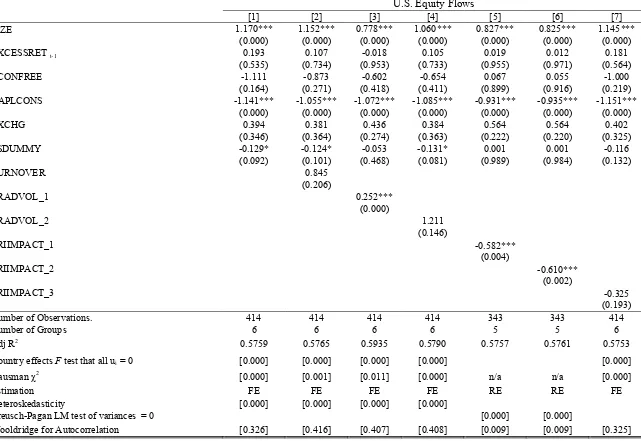
Table II. Panel D. Asia
U.S. Equity Flows
[1] [2] [3] [4] [5] [6] [7]
SIZE 1.170*** 1.152*** 0.778*** 1.060*** 0.827*** 0.825*** 1.145***
(0.000) (0.000) (0.000) (0.000) (0.000) (0.000) (0.000)
EXCESSRET t-1 0.193 0.107 -0.018 0.105 0.019 0.012 0.181
(0.535) (0.734) (0.953) (0.733) (0.955) (0.971) (0.564)
ECONFREE -1.111 -0.873 -0.602 -0.654 0.067 0.055 -1.000
(0.164) (0.271) (0.418) (0.411) (0.899) (0.916) (0.219) CAPLCONS -1.141*** -1.055*** -1.072*** -1.085*** -0.931*** -0.935*** -1.151***
(0.000) (0.000) (0.000) (0.000) (0.000) (0.000) (0.000)
EXCHG 0.394 0.381 0.436 0.384 0.564 0.564 0.402
(0.346) (0.364) (0.274) (0.363) (0.222) (0.220) (0.325)
SSDUMMY -0.129* -0.124* -0.053 -0.131* 0.001 0.001 -0.116
(0.092) (0.101) (0.468) (0.081) (0.989) (0.984) (0.132)
TURNOVER 0.845
(0.206)
TRADVOL_1 0.252***
(0.000)
TRADVOL_2 1.211
(0.146)
PRIIMPACT_1 -0.582***
(0.004)
PRIIMPACT_2 -0.610***
(0.002)
PRIIMPACT_3 -0.325
(0.193)
Number of Observations. 414 414 414 414 343 343 414
Number of Groups 6 6 6 6 5 5 6
Adj R2 0.5759 0.5765 0.5935 0.5790 0.5757 0.5761 0.5753
Country effects Ftest that all ui= 0 [0.000] [0.000] [0.000] [0.000] [0.000]
Hausman χ2 [0.000] [0.001] [0.011] [0.000] n/a n/a [0.000]
Estimation FE FE FE FE RE RE FE
Heteroskedasticity [0.000] [0.000] [0.000] [0.000]
Breusch-Pagan LM test of variances = 0 [0.000] [0.000]
V. A. 4. Does the Past Liquidity Matter?
In this section, we substitute a lagged liquidity for the current one to investigate if liquidity in the earlier month has any impact on equity flows after controlling for those macro factors mentioned above. Using lagged liquidity may also help to assess the robustness of results and to address the potential problem on endogeneity29for our estimations.
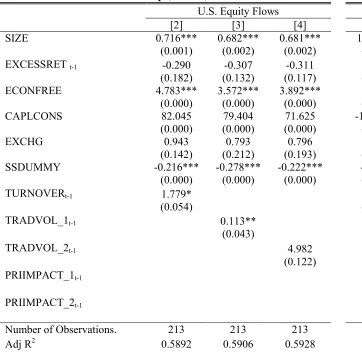
Because the data on PRIIMPACT_1 and PRIIMPACT_2 is lacking for some countries in the Europe, Africa, and Middle East region, here we have to omit these two measures of liquidity on equity flows for this region. Recall that previous results we do not observe a significant impact of PRIIMPACT_3 on equity flows even though the coefficients of PRIIMPACT_3 have a negative sign as we hypothesize. For this reason, PRIIMPACT_3 is not examined in this exercise. Table III indicates that with very few exceptions, the coefficients for the past TURNOVER, TRADVOL_1, TRADVOL_2, PRIIMPACT_1, and PRIIMPACT_2, as well as the coefficients for all control variables are similar to those in Table II. We compare the results in the two tables: the magnitude of the coefficients for the past liquidity is lower than that for the contemporaneous liquidity. Stated differently, the explanatory power of equity flows by past local market liquidity is less pronounced for all models in Table III than that in Table II which shows the regressions in contemporaneous variables. Also, the lagged liquidity does not affect the other coefficients.
29Gelos and Wei (2005) address the problem of endogeneity in several ways. One way is using lagged independent
Table III. Regressions with Lagged Liquidity
Table III includes four Panels A – D presenting estimation results for full sample, Latin America sample, Europe, Africa, and Middle East sample, and Asia sample, respectively. Panel A, B, and D include five models [2] – [6] and Panel C only include three models [2] – [4], each with a different measure of liquidity. In regressions [2] to [7], liquidity is measured by TURNOVER, TRADVOL_1, TRADVOL_2, PRIIMPACT_1, PRIIMPACT_2, andPRIIMPACT_3, respectively. All regressions are estimated over the period from January 1995 to December 2002.
The dependent variable, yit, in fixed country effect estimation is the U.S. equity inflow into country i at month tscaled by country i’s GDP:
it i t i M
k
it k k
it X LIQUID
y
, 11
,
it k
X , denotes the control variables including SIZE, EXCESSRETt-1, ECONFREE, CAPLCONS, EXCHG, and SSDUMMY. All control variables are
at month t, except EXCESSRET, the excess return of country equity market of a period t-1. SIZE is market size. ECONFREE is the natural logarithm of the index of economic freedom. CAPLCONSis the capital control. EXCHGis the change in exchange rate. SSDUMMYis the dummy equal to 1 if shorting-selling is allowed in stock market.
1 ,t
i
LIQUID denotes the lagged liquidity. In this table, we analyze five liquidity measures: TURNOVER is the ratio of value of share traded over market capitalization; TRADVOL_1 is the natural logarithm of the value of share traded;TRADVOL_2 is the value of share traded as a percentage of GDP; PRIIMPACT_1 is the absolute value of the IFCG price change over dollar value traded; PRIIMPACT_2 is the absolute value of the IFCI price change over dollar value traded. All liquidity measures are at month t– 1.
Table III. Panel A. Full Sample Table III. Panel B. Latin America
U.S. Equity Flows U.S. Equity Flows
[2] [3] [4] [5] [6] [2] [3] [4] [5] [6]
SIZE 1.103*** 0.830*** 0.981*** 1.018*** 1.016*** 2.259*** 1.066* 1.249* 2.347*** 2.339*** (0.000) (0.000) (0.000) (0.000) (0.000) (0.001) (0.103) (0.065) (0.001) (0.001) EXCESSRET t-1 -0.145*** -0.146*** -0.143*** -0.029 -0.030 -0.103*** -0.113*** -0.109*** -0.178 -0.179 (0.000) (0.000) (0.000) (0.914) (0.914) (0.000) (0.000) (0.000) (0.714) (0.722) ECONFREE 2.496*** 2.220*** 2.594*** 2.573*** 2.579*** 2.849*** 3.858*** 3.085*** 2.766*** 2.767***
(0.000) (0.000) (0.000) (0.000) (0.000) (0.001) (0.000) (0.001) (0.003) (0.004) CAPLCONS -1.091*** -1.165*** -1.131*** -1.319*** -1.322*** -2.616*** -2.130** -2.285** -2.621** -2.625**
(0.000) (0.000) (0.000) (0.000) (0.000) (0.008) (0.033) (0.028) (0.014) (0.014) EXCHG 0.073 -0.105 0.030 0.190 0.187 -0.511 -0.868** -0.704 -0.498 -0.502 (0.844) (0.753) (0.936) (0.668) (0.671) (0.360) (0.098) (0.173) (0.485) (0.489) SSDUMMY 0.049 0.102 0.032 0.073 0.074 0.556*** 0.669*** 0.496*** 0.333** 0.333**
(0.470) (0.137) (0.630) (0.355) (0.336) (0.003) (0.000) (0.001) (0.029) (0.025)
TURNOVERt-1 1.386* 9.448***
(0.057) (0.002)
TRADVOL_1t-1 0.205*** 0.466***
(0.000) (0.000)
TRADVOL_2t-1 1.932** 41.574***
(0.022) (0.000)
PRIIMPACT_1t-1 -0.114 0.214
(0.430) (0.368)
PRIIMPACT_2t-1 -0.136 0.199
(0.320) (0.381)
Number of
Observations. 956 957 957 735 735 329 330 330 326 326
Table III. Panel C. Europe, Africa, and Middle East Table III. Panel D. Asia U.S. Equity Flows U.S. Equity Flows
[2] [3] [4] [2] [3] [4] [5] [6]
SIZE 0.716*** 0.682*** 0.681*** 1.165*** 0.959*** 1.089*** 1.112*** 1.105*** (0.001) (0.002) (0.002) (0.000) (0.000) (0.000) (0.000) (0.000) EXCESSRET t-1 -0.290 -0.307 -0.311 0.165 0.093 0.119 0.094 0.096
(0.182) (0.132) (0.117) (0.588) (0.768) (0.703) (0.784) (0.774) ECONFREE 4.783*** 3.572*** 3.892*** -1.031 -0.777 -0.747 -0.579 -0.533 (0.000) (0.000) (0.000) (0.209) (0.318) (0.357) (0.512) (0.545) CAPLCONS 82.045 79.404 71.625 -1.112*** -1.093*** -1.093*** -1.207*** -1.213 (0.000) (0.000) (0.000) (0.000) (0.000) (0.000) (0.000) (0.000)
EXCHG 0.943 0.793 0.796 0.380 0.176 0.333 0.484 0.477
(0.142) (0.212) (0.193) (0.383) (0.654) (0.447) (0.348) (0.353) SSDUMMY -0.216*** -0.278*** -0.222*** -0.127* -0.079 -0.129* -0.122 -0.118 (0.000) (0.000) (0.000) (0.095) (0.301) (0.083) (0.116) (0.111)
TURNOVERt-1 1.779* 0.284
(0.054) (0.723)
TRADVOL_1t-1 0.113** 0.143**
(0.043) (0.037)
TRADVOL_2t-1 4.982 0.960
(0.122) (0.245)
PRIIMPACT_1t-1 -0.013
(0.954)
PRIIMPACT_2t-1 -0.077
(0.726)
Number of Observations. 213 213 213 414 414 414 339 339