0 INTRODUCTION
Extensive studies of “road-friendly” heavy vehicles have been performed during the last few decades to reduce road damage and increase the rated load of vehicles. However, the load-sharing ability of multi-axle heavy vehicles, which has a strong correlation with road-friendliness, has been far from adequately investigated. Load-sharing is defined as the equalization of the axle group load across all wheels/ axles [1]. When a multi-axle heavy vehicle with leaf suspensions travels on a rough road or hits a bump/ pothole, such as a bridge-head, or speed control humps, unequally distributed loads among the axles of an axle group tend to appear due to the ineffectiveness of the load-sharing mechanism (centrally pivoted walking beam, trunnion shaft, etc.) and the high stiffness of leaf springs [2]. This phenomenon causes overloading of a single axle of the axle group, which has at least two disadvantages: (a) it increases the possibility of a tire bursting as well as reducing the maneuverability and stability of the vehicle; (b) it accelerates the rutting and fatigue that contributes to pavement damage [3]. As a consequence, the improvement of load-sharing within axle groups has attracted much attention among both vehicle manufacturers and road management departments.
Load-sharing performances of axle groups are specified in regulations for road-friendly vehicles in many countries. The DIVINE (Dynamic Interaction between Vehicle and Infrastructure Experiment)
project undertaken by OECD (Organization for Economic Cooperation and Development) suggests that in order to qualify as a road-friendly tandem suspension, the average load variation per unit of relative vertical suspension displacement must be less than 0.3 kN/mm [4]. The Australian specification for friendly suspensions nominates that road-friendly suspensions must have static load-sharing, i.e., load-sharing when the vehicle is stationary, to a defined value, between axles in an axle group or tires in an axle group. However, the formal methodology to determine the static load-sharing value on a heavy vehicle is not defined [5]. In Europe, an air suspension needs to have fully-functioning hydraulic shock absorbers to pass a static road-friendliness test [6], and heavy vehicles with road-friendly suspensions are allowed higher static axle loads. A common problem with these regulations is that only the static load-sharing of vehicles is specified and that there is no requirement for suspensions to retain their dynamic load-sharing performance, i.e., load-sharing when the vehicle is driving.
Many other load-sharing metrics have also been proposed by researchers. LSC (Load-Sharing Coefficient) [7] and DLSC (Dynamic Load-Sharing Coefficient) [8] have been used to evaluate static and dynamic load-sharing, respectively. Noting that perfect load equalization would give a LSC of 1.0 [9], LSC values for steel suspensions were documented in the range 0.791 to 0.957 [7]. Air suspensions with conventional-size longitudinal air lines were placed
Model Development and Dynamic Load-Sharing Analysis of
Longitudinal-Connected Air Suspensions
Chen, Y. – He, J. – King, M. – Chen, W. – Wang, C. – Zhang, W.
Yikai Chen1,5,* – Jie He2– Mark King3– Wuwei Chen4 – Changjun Wang5– Weihua Zhang1
1 Hefei University of Technology, School of Transportation Engineering, China 2 Southeast University, School of Transportation, China
3 Queensland University of Technology, Centre for Accident Research and Road Safety- Queensland, Australia 4 Hefei University of Technology, School of Mechanical and Automotive Engineering, China
5 Traffic Management Research Institute of the Ministry of Public Security, China
The objective of this research was to investigate the effect of suspension parameters on dynamic load-sharing of longitudinal-connected air suspensions of a tri-axle semi-trailer. A novel nonlinear model of a multi-axle semi-trailer with longitudinal-connected air suspension was formulated based on fluid mechanics and thermodynamics and was validated through test results. The effects of suspension parameters on dynamic load-sharing and road-friendliness of the semi-trailer were analyzed. Simulation results indicate that the road-friendliness metric DLC (Dynamic Load Coefficient), is generally in accordance with the load-sharing metric - DLSC (Dynamic Load Sharing Coefficient). When the static height or static pressure increases, the DLSC optimization ratio declines monotonically. The effect of employing larger air lines and connectors on the DLSC optimization ratio gives varying results as road roughness increases and as driving speed increases. The results also indicate that if the air line diameter is always assumed to be larger than the connector diameter, the influence of air line diameter on load-sharing is more significant than that of the connector.
in the middle of this range with LSCs of 0.904 to 0.925 [4]. More recent studies commissioned by the National Road Transport Commission of Australia found that installation of larger air lines on multi-axle air suspensions increased longitudinal air flow between air springs on adjacent axles [10] and [11] Follow-up tests funded by the Queensland Department of Main Roads discovered that an improvement in DLSC of 4 to 30% for a tri-axle coach and 37 to 77% for a tri-axle semi-trailer were obtained by alternating the conventional-size longitudinal air connection (three 6.5 mm inside diameter connectors connecting 6.5 mm inside diameter air lines) with a larger air connection (three 20 mm inside diameter connectors connecting 50 mm inside diameter air lines) [12] and [13]. However, due to the limitations of laboratory equipment, only vehicle speed and a limited number of air connections were considered in most tests, so that the effect of some other factors like the static absolute air pressure of the air spring and static height of the air spring on load-sharing have not yet been reported before.
Limitations of laboratory and on-road tests can be addressed by developing realistic models of longitudinal-connected air suspensions. Potter et al developed a simplified tandem bogie model, and by changing the damping coefficient and torsional stiffness of the leveling beam of the model [2], it can represent load-leveling steel suspensions, independent steel suspensions, longitudinal-connected air suspensions, and independent air suspensions, respectively. Davis proposed a model of a tri-axle semi-trailer with longitudinal-connected air suspensions [12], and used a variable “load-sharing fraction” to represent the load-sharing ability of the suspension. However, the physical meaning of the variable was unclear. A more realistic model of a similar tri-axle semi-trailer was developed by Roebuck et al based on aerodynamics and thermodynamics [14]. In the
model, the volumetric flow rate [m3/s] between two
air springs was assumed to be simply proportional to the difference in air pressure with a constant coefficient Cflow [m3/(kPa·s)]; in addition, the volumes and effective areas of the air springs were simplified as constants while the vehicle was travelling.
Unfortunately, these simplifications of nonlinearities reduced the precision of the proposed models. A more realistic model of longitudinal-connected multi-axle air suspensions is urgently needed for precise analysis and optimization of load-sharing in multi-axle semi-trailers.
The rest of this paper is organized in the following order. In Section 1, a novel nonlinear
model of longitudinal-connected tri-axle air suspensions is derived based on fluid mechanics and thermodynamics. The accuracy of the model is validated and load-sharing criteria are chosen in Section 2. Based on the model, the effects of air suspension parameters (static height and static absolute air pressure of air spring, inside diameters of air line and connector) on dynamic load-sharing are analyzed in Section 3. Finally, Section 4 presents a summary of the results and draws conclusions.
1 INTEGRATED MODEL OF VEHICLE AND ROAD EXCITATION
1.1 Mathematic Model of the Tri-Axle Semi-Trailer
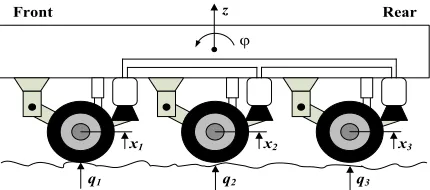
A basic half model representing a typical tri-axle semi-trailer with longitudinal-connected air suspensions in most western countries was employed, as shown in Fig. 1. This model includes five degrees of freedom (DOF), which are vertical displacements of sprung mass and three unsprung masses, z, x1, x2, x3, as well as the pitch angle of the sprung mass, ϕ.
Front Rear
q1 q2 q3
x1 x2 x3
z
ϕ
Fig. 1. Schematic of the tri-axle semi-trailer with longitudinal-connected air suspensions
The equations of motion of the semi-trailer are given by:
m x q x k c z x l
P P A mg
t t
s s
1 1 1 1 1 1 1
1 0 1 1
3
= − + − − −
− − +
( ) ( )
( )
φ
,,
(1)
m x q x k c z x
P P A mg
t t
s s
2 2 2 2 2 2 2
2 0 2 1
3
= − + − −
− − +
( ) ( )
( ) ,
(2)
m x q x k c z x l
P P A m
t t
s s
3 3 3 3 3 3 3
3 0 3 1
3
= − + − + −
− − +
( ) ( )
( )
φ
J P P A c z x l mg l
P P
s s
s
φ = − − − +φ −
−
− −
( ) ( ) )
(
3 0 3 3 3
1 0
1 3 ))As1−c z x1( − −1 l)−13mg l) ,
φ
(4)
mz P P A P P A
P P A c z x
s s s s
s s
= − + − +
+ − − − −
( ) ( )
( ) (
1 0 1 2 0 2
3 0 3 1 1
φll
c z x c z x l mg
)
( ) ( ) ,
−
− − − − − −
2 2 3 1 φ
(5)
where mt1, mt2, mt3 and q1, q2, q3 are the unsprung masses and road excitation of the three axles, respectively. m is the sprung mass of the semi-trailer.
J is the moment of inertia of the gross sprung mass
around the lateral axis. Ps1, Ps2, Ps3 and As1, As2, As3 are the dynamic absolute air pressure and dynamic effective area of the three air springs, respectively. P0 is atmospheric pressure. l is the wheelbase, c1, c2, c3 are the damping coefficients of three dampers, and kt1,
kt2, kt3 are the stiffness of the three tires. 1.2 Road Roughness Excitation
Many methodologies have been proposed to model road surface profile [15] to [17]. One method is to describe the profile as a realization of a random process that is represented by its PSD (Power Spectral Density). A concise spectral model is used in this study as [18]:
G n G n n
n n n n
q( )= q( )( )0 − < 0
2
1 2
( < ), (6)
where Gq(n) is the PSD function [m3/cycle] for the
road surface elevation; n is the spatial frequency
[cycle/m]; n0 is the reference spatial frequency,
n0 = 0.1 cycle/m; Gq(n0) is roughness coefficient
[m3/cycle], whose value is chosen depending on the
road condition. Classification of road roughness is based on the index of the ISO standard [19]. The ISO has proposed a road roughness classification from Class “A” (very good) to Class “H” (very poor) according to different values of Gq(n0). n1 and n2 are lower and upper spatial cutoff frequencies when Gq(n) reaches 1 and 10-5 m3/cycle, respectively [19].
When travelling along the road surface at a constant vehicle speed u, the temporal frequency, f, and n are related as f = un. Therefore, the relationship between spatial PSD and temporal PSD becomes:
G f
uG n uG n
n
n G n n uf
q( )= q( )= q( ) q( ) .
=
−
1 1
0 0
2
0 02 2 (7)
As the angular frequency, ω, is related to f as
ω = 2 πf, Eq. (7) is rewritten as: Gq( )ω π G n n uq( ) .
ω =4 2
0 02 2 (8)
Eq. (8) is transformed to the following equation
when inserting a lower cutoff angular frequency, ω1
[20]:
Gq( )ω π G n nq( ) u ,
ω ω
=
+
4 2
0 02 2 12
(9)
where ω1 = 2 πn1u. Standard road roughness is a
response of a first order linear to a white noise, w(t) [21], therefore:
Gq( )ω = H( )ω 2Sω,
(10)
where Sω is the PSD of the white noise, Sω =1.
Substituting Eq. (10) into Eq. (9) yields:
H n G n u
j q
( )ω π ( ) .
ω ω
=
+
2 0 0
1
(11)
Then the road roughness q(t) is given by:
q t( )= −2πn uq t1 ( )+2πn G n uw t0 q( ) ( ).0 (12)
The upper cut-off frequency n2 was modeled
by setting the sampling frequency of w(t) based on
Nyquist sampling theory, i.e., the sampling frequency should be at least 2n2u Hz. A time delay of l / v for road excitation is applied between adjacent axles.
1.3 Detailed Model of Longitudinal-Connected Tri-Axle Air Suspensions
To solve the equations in section 1.1, a detailed model of longitudinal-connected tri-axle air suspensions is needed to express Ps1, Ps2 and Ps3 as functions of the 5 variables (5 DOF).
It is assumed that all the air springs are stroked fast enough so that all the heat of the operation is conserved when the vehicle is travelling, i.e., an adiabatic process occurs. Thus, the formula for calculating the dynamic absolute air pressure inside the front air spring, Ps1, is [22]:
P V
m P
V m
s s
s k
s s
s k
1 1 1
10 10 10
( ) = ( ) =constant. (13)
dynamic air mass, and static air mass inside the front air spring; and Ps10 is the static absolute air pressure inside the front air spring. The value of the
above exponent, k, varies with the gas used and is a
function of the specific heat of the gas. Air suspension operation is characterized by neither an isothermal nor an adiabatic process, but is instead polytropic. In normal use, however, the process is much closer to
adiabatic than isothermal. Accordingly, the value of k
is set to 1.4.
Ps1 is obtained from Eq. (13) as follows:
P V m
V m P
s s s
s s s
1 10 1
1 10 1 4
10
=( ). ,
(14)
where Vs1 is a function of the dynamic height of the front air spring, and is given by:
Vs1=(z x− −1 φl A) s1+Vs10, (15)
where As1 can also be approximated as a function of dynamic height based on experimental data.
ms1 depends on the air flow rate inside the front connector, G1 [kg/s], is given by:
ms1 =m10+
∫
0tG dt1 . (16)Since only small variations of temperature, air pressure and air spring volume exist when the semi-trailer is travelling, the air flow inside the front connector is considered to be an incompressible steady flow, which satisfies the following formula, according to Bernoulli’s equation [23]:
P v P
v s
s f f
1 1 2 1 1 2 1 2 1 2
ρ + = ρ + , (17)
where Pf1 is the dynamic absolute air pressure inside the front connector; vs1, vf1 are the air flow speed [m/s] inside the front air spring and the front connector, respectively; and the air inside all the air springs, connectors and the air line is assumed to have a same constant density, ρ, when the semi-trailer is travelling;
Af1 is the effective area of the front connector, which is equal to the actual area multiplied by a contraction coefficient, 0.7 [24].
Noting that As1 is related to Af1 because
As1·vs1 = Af1·vf1, inserting vs1 = Af1·vf1 / As1 into Eq. (17) yields:
v P P A
A
f s f f
s
1 1 1 1
2 1 2 2 1 = − −
ρ ( ) , (18)
where vf1 is modified with a coefficient, cd (0.8), to
reflect the friction of the connector. Therefore, the actual air flow speed inside the front connector, v'f1, and G1 are given by:
′ = − −
v c P P A
A
f d s f f
s
1 1 1 1
2
1 2
2 1
ρ ( ) , (19)
G P P c A
P P A
A
f s d f
s f f
s
1 1 1 1
1 1 1
2 1 2 2 1 = − × × − − sgn( ) ( ) .
ρ (20)
Substituting Eqs. (15), (16) and (20) into Eq. (14) yields:
P P V z x l A V m
m P
s1 s10 s10 s s s
1 4
1 1 10
1 4 1 4
10 10 =
[
− − +]
× × + − − . ( ) . . sgn( φ[ ff s d f t
s f f
s P c A
P P A
A dt
1 1 1
0
1 1 1
2 1 2 1 4 2 1 − × × − −
∫
) ( ( )) ] .. ρ (21)The dynamic absolute air pressures inside the three connectors and the longitudinal air line are assumed to have the same value, Pf1, during travel. Thus, similar expressions for the air flow rate inside the middle and rear connectors (G2 and G3), as well as the dynamic absolute air pressure inside the middle and rear air springs (Ps2 and Ps3) are derived as follows:
G P P c A
P P A
A
f s d f
s f f
s
2 1 2 2
2 1 2
2 2 2 2 1 = − × × − − sgn( ) ( ) ,
ρ (22)
G P P c A
P P A
A
f s d f
s f f
s
3 1 3 3
3 1 3
2 3 2 2 1 = − × × − − sgn( ) ( ) ,
ρ (23)
P P V z x A V m
m P
s s s s s
f
s
2 20 1 420 2 2 20
1 4 1 4
20 1 20 =
[
− +]
× × + − − − . ( ) . . sgn([ PP c A
P P A
A dt
s d f
t
s f f
s 2 2 0 2 1 2 2 2 2 1 4 2 1 ) ( ( )) ] ,.
∫
×
P P V z x l A V m
m P
s3 s30 s30 s s s
1 4
3 3 30
1 4 1 4
30
30
=
[
− + +]
×× +
− −
. ( ) . .
sgn(
φ
[ ff s d f t
s f f
s P c A
P P A
A dt
1 3 3
0
3 1
3 2
3 2
1 4
2 1
− ×
× − −
∫
)( ( )) ] ,.
ρ (25)
where Ps20, Vs20, ms20 are the static absolute air pressure, static volume and static air mass of the middle air spring, Ps30, Vs30, ms30 are the corresponding parameters for the rear air spring; and Af2, Af3 are the areas of the middle and rear connectors, respectively. The three air springs have the same static absolute air pressure, static volume and static air mass, and the three connectors have the same inside diameter.
The air line is made of steel, so the volume of air line is constant. Based on Eq. (14), the dynamic
absolute air pressure inside the air line, Pf1, is
expressed as a function of the static air mass of the air line, ml0, the static absolute air pressure inside the air line, Ps10, and the gross air flow rate inside the air line,
Gl, shown as follows:
P m G dt
m P
f
l l
t
l s
1
0 0
0 1 4
0
=( +
∫
). ,1 (26)
Gl = − −G G G1 2− 3. (27)
Substituting Eqs. (20), (22), (23) and (27) into Eq. (26) yields:
P m P m P P
c A P P A
f l sl l f s
t
d f s f f
1 01 4 0 0 0 1 1
1 2 1 1 1
= +
{
− − ×× − −
−. (
∫
sgn( )(
ρ 211
1 2
1 2 2 2 1 2
2
2 2
2 1
A
P P c A P P A
A
s
f s d f s f f
s )
sgn( ) ( )
−
− − × ρ − −
−
− − × − −
sgn(Pf P c As ) d f Ps Pf (AAf )
s
1 3 3 3 1 3
2
3 2
2ρ 1
dt) .1 4. (28)
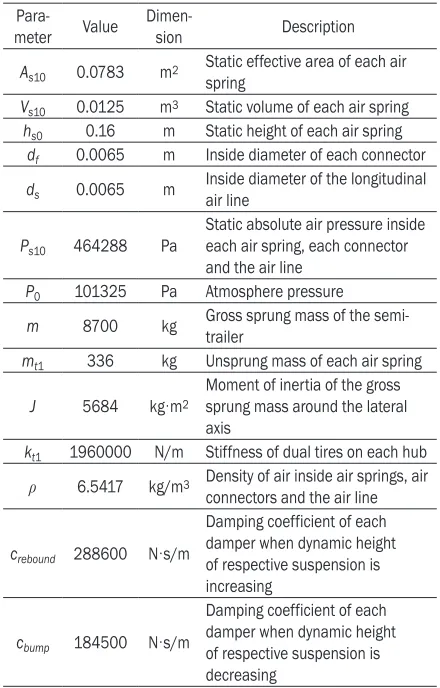
Based on the equations in Section 1.1, Section 1.2 and Eqs. (21), (24), (25) and (28), an integrated model of road excitation and a fully-loaded tri-axle semi-trailer with longitudinal-connected air springs was developed with Matlab/ Simulink. Parts of the key parameters are tabulated in Table 1. The expression of the effective area of each air spring as a function of the dynamic height of corresponding air spring will be obtained based on test results in Section 2.2.
Table 1. Parameters of the Tri-axle Semi-trailer Model Para-
meter Value Dimen-sion Description As10 0.0783 m2 Static effective area of each air spring Vs10 0.0125 m3 Static volume of each air spring hs0 0.16 m Static height of each air spring
df 0.0065 m Inside diameter of each connector
ds 0.0065 m Inside diameter of the longitudinal air line
Ps10 464288 Pa
Static absolute air pressure inside each air spring, each connector and the air line
P0 101325 Pa Atmosphere pressure
m 8700 kg Gross sprung mass of the semi-trailer mt1 336 kg Unsprung mass of each air spring
J 5684 kg·m2 Moment of inertia of the gross sprung mass around the lateral axis
kt1 1960000 N/m Stiffness of dual tires on each hub ρ 6.5417 kg/m3 Density of air inside air springs, air
connectors and the air line
crebound 288600 N·s/m
Damping coefficient of each damper when dynamic height of respective suspension is increasing
cbump 184500 N·s/m
Damping coefficient of each damper when dynamic height of respective suspension is decreasing
2 LOAD-SHARING CRITERIA AND MODEL VALIDATION
2.1 Load-Sharing Criteria
Criteria need to be chosen to evaluate the load-sharing of the semi-trailer. A metric often used to characterize the magnitude of dynamic forces of a wheel in an axle
group is the DLC (Dynamic Load Coefficient) [7],
defined as:
DLC i
Fmeani i
( )
( ),
= σ (29)
where σi denotes the standard deviation of
wheel-force i, and Fmean(i) denotes the mean wheel-force
of wheel i. Although DLC is usually referred to as a
De Pont points out that LSC does not address dynamic load-sharing [8]. The DLSC was proposed as an alternative to LSC, to account for the dynamic nature of wheel-forces and instantaneous load-sharing during travel, and is defined as [8].
DLSC
DLS j
k DLS j
k i
i i
j k
j k
=
−
=
=
∑
∑
( ( ) ( )). 1
1
2
1
(30)
The dynamic load-sharing of wheel i, DLSi(j), is:
DLS j nF j
F j
i i
i i
n
( ) ( ) ( ),
=
=
∑
1
(31)
where n is the number of wheels on one side of an
axle group; k is the number of terms in the dataset;
and Fi(j) is the instantaneous force at wheel i.
In this study, the average DLSC of tires on the same side of the semi-trailer axle group was employed as a metric of load-sharing. The average DLC of tires on the same side of the semi-trailer axle group was used to evaluate road-friendliness as well as to analyze the relationship between load-sharing and road-friendliness.
2.2 Model Validation
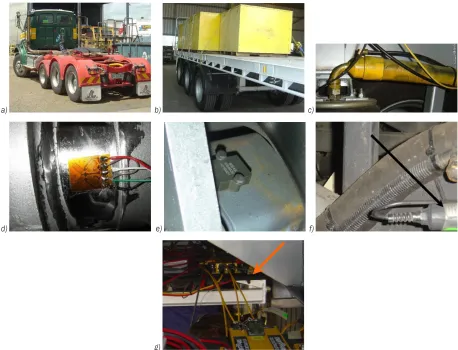
The prototype of the tri-axle semi-trailer was tested on various road sections for verification of the integrated model of vehicle and road excitation, as shown in Fig. 2. The tests were part of a joint project titled “Heavy vehicle suspensions – testing and analysis” between the Queensland University of Technology (QUT) and the Department of Transport and Main Roads, Queensland (TMR) [26].
The setups of the tests are shown in Fig. 2. Two types of longitudinal connections were used to connect the passive air suspensions on the same side: conventional (three 6.5 mm inside diameter connectors connecting a 6.5 mm inside diameter air line) and large (three 20 mm inside diameter connectors connecting a 50 mm inside diameter air line). Strain gauges (one per hub) were mounted on the neutral axis of each axle between the spring and the hub to record the shear force on the hubs, i.e., air spring force, and accelerometers were mounted as closely as possible to each hub and to the corresponding upper positions at the chassis to derive the height of each air spring. In addition, six air pressure transducers were employed to obtain the pressures inside the air springs, and a
TRAMANCO P/L on-board CHEK-WAY telemetry system was used to record all the data.
The dynamic force of each tire was derived based on the shear force on the respective hub and the acceleration on the respective axle. The effective area of each air spring was obtained by dividing the respective shear force by the respective pressure inside the air spring, and the volume of each air spring was derived by multiplying the respective effective area by the respective spring height.
The tests comprised of driving the semi-trailer over three typical urban road sections at speeds ranging from 60 to 80 km/h; the sections of road varied from smooth with long undulations to rough with short undulations. The IRI (International Roughness Index) values of each road section were provided by TMR, and the IRI is related to Gq(n0)
in Eq. (6) as IRI=0 78 10× 3 G nq
0
. ( ) [27]. Ten
seconds of dynamic signal data were recorded per road section, and this was done for both experimental cases (i.e., conventional longitudinal connection vs. large longitudinal connection) for the fully loaded condition.
Thus, the dynamic effective area of each air spring is approximated as a function of the dynamic
height of corresponding air spring, y, based on the
experimental results, shown as:
A y y
y
s1 7.670500 2.866880
0.354226 0.093002.
= − +
− +
−
3 2
(32)
The effective area multiplied by the dynamic spring height yields:
Vs y y
y y
1 7.670500 2.866880
0.354226 0.093002
= − +
− +
−
4 3
2 .
(33)
The comparisons between the test and simulation results in terms of load-sharing performance are listed in Table 2.
As shown in Table 2, a reasonable agreement exists between test and simulation results for both types of connection, under various road roughness conditions and vehicle speeds. The absolute error
ratio of the DLCbetween each test and corresponding
a) b) c)
d) e) f)
g)
Fig. 2. Setups of the tests; a) prime mover, b) test semi-trailer with test load, c) large longitudinal air line, d) strain gauge, e) accelerometer mounted on the axle, f) air pressure transducer, g) CHEK-WAY telemetry system underneath the semi-trailer [26]
Table 2. Comparison of Load-Sharing Performances between Tests and Simulations Test/
simulation number
Type of longitudinal
connection IRI
Velocity
[km/h] Load-sharing criteria Test results Simulationresults
Error ratio (compared with the
test results) [%]
1 conventional 6.213 60 DLC 0.0791 0.0733 -7.3
DLSC 0.0505 0.0431 -14.6
2 large 6.213 60 DLC 0.0699 0.0637 -8.9
DLSC 0.0440 0.0357 -18.8
3 conventional 7.602 70 DLC 0.1034 0.1001 -3.2
DLSC 0.0851 0.0721 -15.3
4 large 7.602 70 DLC 0.0983 0.0926 -5.8
DLSC 0.0819 0.0645 -21.2
5 conventional 8.880 80 DLC 0.1773 0.1679 -5.3
DLSC 0.1506 0.1256 -16.6
6 large 8.880 80 DLC 0.1775 0.1626 -8.4
DLSC 0.1474 0.1256 -14.8
It can be concluded from Table 2 that the simulation results correlated well with the measurements. Therefore, the integrated model
3 EFFECT OF SUSPENSION PARAMETERS ON LOAD-SHARING
3.1 Effect of Static Height and Static Pressure
The effect of the static height and static pressure of air springs for the fully-loaded semi-trailer are discussed in this section, for a constant vehicle speed of 20 m/s and a standard “B” class road profile. Note that the effective area of each air spring at a given height is nearly constant with various static absolute air pressures, i.e., Eq. (32) always holds. The new static pressure of each air spring under a new static height is related to the corresponding static spring height as follows:
Ps10(new) = × × −( hs new30( )
+
+
2900 9.8 7.670500 2.86688
00 0.354226
0.093002)
hs new20 hs new0
1 1 0
( ) ( )
.
−
+
+
+
−
11325 105
*
.
(34)a) 0.15 0.16 0.17 0.18 0.19 0.2 0.21 0.22
0.042 0.044 0.046 0.048 0.05 0.052 0.054 0.056
Static height (m)
DL
S
C
Type 1 Type 2
b) 0.15 0.16 0.17 0.18 0.19 0.2 0.21 0.22
0.065 0.07 0.075 0.08 0.085 0.09
Static height (m)
DL
C
Type 1 Type 2
c) 0.15 0.16 0.17 0.18 0.19 0.2 0.21 0.22
2% 4% 6% 8% 10% 12% 14% 16% 18%
Static height (m)
O
pt
im
iz
at
ion r
at
io
DLSC DLC
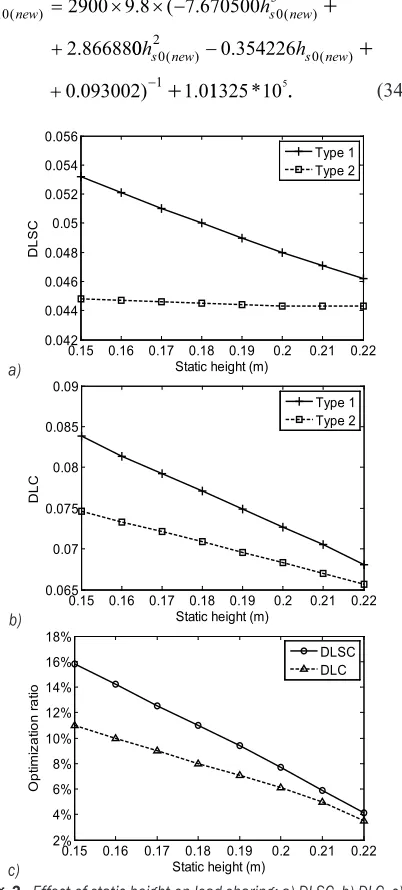
Fig. 3. Effect of static height on load-sharing; a) DLSC, b) DLC, c) DLSC optimization ratio and DLC
The influence of the static height (varying from 0.15 to 0.22 m) and corresponding static pressure (varying from 463431 to 495204 Pa) on load-sharing are shown in Fig. 3.
It can be seen in Figs. 3a and b that both the DLSC and DLC reduce as the static height increases. In fact, when the static height increases, the absolute value of dAs10 / dy increases and dVs10 / dy decreases based on Eqs. (32) and (33). These result in the reduction of dynamic stiffness of each air spring and accordingly the decline of DLSC and DLC.
Another finding is that compared with the DLCof
the semi-trailer with connection “2”, which decreases at a relatively constant rate, the DLSC of the semi-trailer with connection “2” decreases more slowly and becomes constant when the static height exceeds 0.19 m. This indicates that when a large connection is employed, the load-sharing will not change much as the static height increases and the air pressure of air springs decreases, but the dynamic tire forces will continue to reduce.
The optimization ratios of both DLSC and DLSC decline as the static height increases, as shown in Fig. 3c. As the static height increases, Vs10 increases, and the volume of air line / Vs10 decreases, and the effect of employing large air line and connectors becomes less prominent.
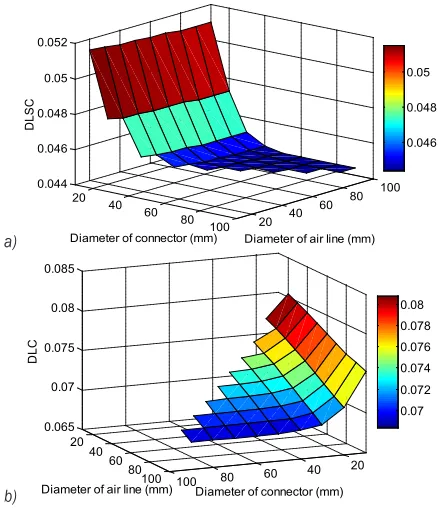
3.2 Effect Of Inside Diameter of Air Line and Connector
The effects of size of air line and connector (varying from 10 to 100 mm) on load-sharing are plotted in Fig. 4, with a constant vehicle speed of 20 m/s for the fully-loaded semi-trailer and a standard “B” class road profile. The diameters of the connectors are always less than or equal to those of the air lines in all the simulations.
It can be seen in Figs. 4a and 4b that with a fixed diameter of air line, both DLSC and DLC reduce quickly as the air line diameter increases from 10 to 30 mm. For example, with a 100 mm diameter air line, reductions up to 11.4 and 8.4% are observed for DLSC and DLC, respectively. When the diameter of air line increases beyond 30 mm, both DLSC and DLC decrease more slowly and finally become constants.
tire force and accordingly the road-friendliness of the semi-trailer are effectively improved.
a)
20 40
60
80 100 20 40
60 80
100 0.044
0.046 0.048 0.05 0.052
Diameter of air line (mm) Diameter of connector (mm)
D
LS
C
0.046 0.048 0.05
b)
20 40 60 80 100 20
40 60
80100 0.065
0.07 0.075 0.08 0.085
Diameter of connector (mm) Diameter of air line (mm)
D
LC
0.07 0.072 0.074 0.076 0.078 0.08
Fig. 4. Effect of size of air line and connector on load-sharing optimization ratios; a) DLSC, b) DLC
The change in dynamic tire force can be revealed more clearly with spectral analysis. Fig. 5 shows the PSD for dynamic tire force for three types of longitudinal connections among air suspensions, i.e., type “1”, type “2” (both as specified above), and type “3” (three 100 mm inside diameter connectors connecting a 100 mm inside diameter air line). It is evident that the dynamic tire forces are effectively isolated by using large air lines and connectors, especially at frequencies lower than 0.3 Hz and frequencies from 0.8 to 5.0 Hz. Compared with the semi-trailer with air connection “1”, the peak values around the body bounce frequency (about 1.9 Hz) of the front dual tires decreased by 18.6 and 60.6% through employing air connections “2” and “3”, and the corresponding optimization ratios of the middle, rear dual tires are 22.3, 50.5, 36.6 and 58.1%, respectively.
4 CONCLUSIONS
In this study, the effects of suspension parameters on dynamic load-sharing of longitudinal-connected air suspensions of a tri-axle semi-trailer were investigated comprehensively. A novel nonlinear model of longitudinal-connected tri-axle air suspensions
was formulated based on fluid mechanics and thermodynamics and validated through test results. The effects of road surface conditions, driving speeds, air line diameters and connector diameters on the dynamic load-sharing capability of the semi-trailer
were analyzed in terms of the DLSCand DLC, and
the following conclusions can be drawn:
1. The road-friendliness metric DLC, is generally in accordance with the load-sharing metric DLSC. a)
10-1 100 101
101 102 103 104 105 106 107
Frequency (Hz)
PSD
(N
2 /H
z)
Type 1 Type 2 Type 3
b)
10-1 100 101 100
101 102 103 104 105 106 107
Frequency (Hz)
PSD
(N
2 /H
z)
Type 1 Type 2 Type 3
c)
10-1 100 101 100
102 104 106 108
Frequency (Hz)
PSD
(N
2 /H
z)
Type 1 Type 2 Type 3
2. When the static height or the static pressure is
increased, the DLSC optimization ratiodeclines.
The reason for this phenomenon is that the static height increases with more static pressure, Vs10 increases, and the volume of air line divided by
Vs10 decreases. Thus, the effect of employing
a large air line and connectors becomes less prominent.
3. Assuming that the diameter of the air line is always larger than that of the connector, the influence of the diameter of air line is more significant than that of the connector. When the semi-trailer is driving at 20 m/s on a standard “B” class road and the connector diameter is fixed at
10 mm, the DLSC only decreases 1.0% as the
air line diameter increases from 10 to 100 mm. However, when the air line diameter is fixed at 100 mm, the reduction reaches 11.4% as the connector diameter increases from 10 to 30 mm; as the connector diameter continues to increase, the DLSC declines at a very slow rate and becomes constant.
Based on the proposed model, investigation of the control methods of the tri-axle air suspension system with longitudinal air line and their influence on load-sharing will be undertaken in the future.
5 ACKNOWLEDGEMENT
This work was supported by the National Natural Science Foundation of China (Grant Nos. 51078087, 51178158, 51075112), the Natural Science Foundation of Anhui Province (Grant No. 11040606Q39), and the Fundamental Research Funds for the Central Universities (Grant No. 2012HGQC0015 and 2011HGBZ0945). The assistance of Dr Lloyd Davis from the Queensland Department of Transport and Main Roads is also greatly acknowledged.
6 REFERENCES
[1] Davis, L.E., Bunker, M.B. (2008). Load-Sharing in
Heavy Vehicle Suspensions - New Metrics for Old.
Queensland University of Technology, QUT Digital Repository, Brisbane.
[2] Potter, T.E.C., Cebon, D., Cole, D.J., Collop, A,C. (1996). Road damage due to dynamic tyre forces, measured on a public road. International Journal of Heavy Vehicle Systems, vol. 3, no. 1-4, p. 346-62. [3] Cebon, D. (1987). Assessment of The Dynamic Wheel
Forces Generated by Heavy Road Vehicles. Symposium
on Heavy Vehicle Suspension Characteristics, p.
199-212.
[4] Cantieni, R., Krebs, W., Heywood, R. (1998). Dynamic Interaction between Vehicles and Infrastructure
Experiment (DIVINE), Technical Report No. DSTI/
DOT/RTR/IR6(98)1/FINAL. Organisation for Economic Co-operation and Development (OECD), Paris.
[5] Department of Transport and Regional Services - Australia. (2004). Vehicle Standards Bulletin VSB 11
Certification of Road-Friendly Suspension Systems.
Australian Department of Infrastructure, Transport, Regional Development and Local Government, Canberra.
[6] Costanzi, M., Cebon, D. (2007). An investigation of the effects of lorry suspension performance on road maintenance costs. Proceedings of the Institution of Mechanical Engineers, Part C: Journal of Mechanical
Engineering Science, vol. 221, no. 11, p. 1265-1277,
DOI:10.1243/09544062JMES639.
[7] Sweatman, P.F. (1983). A Study of Dynamic Wheel Forces in Axle Group Suspensions of Heavy Vehicles.
Australian Road Research Board, Special Report. Report No. SR27. Vermont South, Victoria.
[8] de Pont, J.J. (1997). Assessing Heavy Vehicle
Suspensions for Road Wear. Research report No 95.
Transfund New Zealand, Wellington.
[9] Potter, T.E.C., Cebon, D., Collop, A.C., Cole, D.J. (1996). Road-damaging potential of measured dynamic tyre forces in mixed traffic. Proceedings of the Institution of Mechanical Engineers, Part D: Journal of Automobile Engineering, vol. 210, no. 3, p. 215-225, DOI:10.1243/PIME_PROC_1996_210_265_02. [10] Estill & Associates Pty Ltd. (2000). Operational
Stability and Performance of Air Suspension on
Various Vehicle Configurations. Australia: Department
of Transport and Works, South Perth.
[11] Roaduser Systems Pty Ltd. (2005). Stability and On-Road Performance of Multi-Combination Vehicles
with Air Suspension Systems. Australia: National Road
Transport Commission, Canberra.
[12] Davis, L.E. (2010). Heavy Vehicle Suspensions- Testing
and Analysis. Ph.D. thessis, Queensland University of
Technology, Brisbane.
[13] Davis, L.E., Bunker, J.M. (2011). Altering heavy vehicle air suspension dynamic forces by modifying air lines. International Journal of Heavy Vehicle
Systems. vol. 18, no. 1, p. 1-17, DOI:10.1504/
IJHVS.2011.037957.
[14] Roebuck, R.L., Cebon, D., Dale, S.G. (2006). Optimal control of a semi-active tri-axle lorry suspension.
Vehicle System Dynamics, vol. 44, no. supl., p.
892-903, DOI:10.1080/00423110600907493.
[15] Papagiannakis, A.T., Zelelew, H.M, Muhunthan, B. (2007). Wavelet analysis of energy content in pavement roughness and truck dynamic axle loads. Transportation Research Record: Journal of the
Transportation Research Board, vol. 2005/2007, p.
[16] Taskin, Y., Hacioglu, Y., Yagiz, N. (2007). The use of fuzzy-logic control to improve the ride comfort of vehicles. Strojniski vestnik - Journal of Mechanical Engineering, vol. 50, no. 10, p. 462-468.
[17] Guclu, R. (2004). The fuzzy-logic control of active suspensions without suspension-gap degeneration.
Strojniski vestnik - Journal of Mechanical Engineering, vol. 53, no. 4, p. 233-240.
[18] Shi, X.M., Cai, C.S. (2009). Simulation of dynamic effects of vehicles on pavement using a 3D interaction model. Journal of Transportation Engineering - ASCE, vol. 135, no. 10, p. 736-744, DOI:10.1061/(ASCE) TE.1943-5436.0000045.
[19] ISO 8068:1995 (E) (1995). Mechanical
Vibration-Road Surface Profiles-Reporting of Measured Data.
International Organization for Standardization, Geneva. [20] Chen, J.P., Chen, W. W., Zhu, H., Zhu, M.F. (2010).
Modeling and simulation on stochastic road surface irregularity based on Matlab/Simulink. Transactions of the Chinese Society of Agricultural Machinery, vol. 41, no. 3, p. 11-15.
[21] Prabakar, R.S., Sujatha, C., Narayanan, S. (2009). Optimal semi-active preview control response of a half
car vehicle model with magnetorheological damper.
Journal of Sound and Vibration, vol. 326, no. 3-5, p.
400-420, DOI:10.1016/j.jsv.2009.05.032.
[22] Wang, J.S., Zhu ,S.H. (2009). Linearized model for dynamic stiffness of air spring with auxiliary chamber.
Journal of Vibration and Shock, vol. 28, no. 2, p. 72-76. [23] White, F.M. (2011). Fluid Mechanics. McGraw-Hill,
Columbus.
[24] Chen, S.M. (2011). Hydraulic and Pneumatic
Transmission. China Machine Press, Beijing.
[25] Davis, L.E., Bunker, J.M. (2009). Suspension Testing of 3 Heavy Vehicles - Dynamic Wheel Force Analysis
- Report. Australia: Department of Main Roads-
Queensland Government, Brisbane.
[26] Davis, L.E., Bunker, J.M. (2009). Heavy Vehicle Suspension Testing and Analysis-Dynamic Load
Sharing. Australia: Department of Main Roads -
Queensland Government, Brisbane.
[27] Chen, H.X., He, Z.Y. (2008). A study on simulation of road roughness based on international roughness index.