Desert 24-1 (2019) 133-141
Modelling of some soil physical quality indicators using hybrid
algorithm principal component analysis - artificial neural network
F. AmiriMijan
a*, H. Shirani
a, I. Esfandiarpour
a, A.A. Besalatpour
b, H. Shekofteh
ca
College of Agriculture, Vali-e-Asr University of Rafsanjan, Rafsanjan, Iran
b Inter 3 GmbH - Institut for Ressources management, Otto-Suhr-Allee 59, 10585 Berlin, Germany c
Soil Science Dept., Faculty of Agriculture, Jiroft University, Jiroft, Kerman, Iran
Received: 24 September 2018; Received in revised form: 14 December 2018; Accepted: 20 December 2018
Abstract
One of the important issues in the analysis of soils is to evaluate their features. In estimation of the hardly available properties, it seems the using of Data mining is appropriate. Therefore, the modelling of some soil quality indicators, using some of the early features of soil which have been proved by some researchers, have been considered. For this purpose, 140 disturbed and 140 undisturbed soil samples were collected from Jiroft, southern Kerman, Iran. Some physical and chemical properties of soil, for example, sand, silt and clay percentage, organic matter (OM), calcium carbonate (CaCO3), electrical conductivity at saturation (ECe), porosity (F), and bulk density (BD) were measured using standard methods. Some soil physical property indicators, including plant available water (PAW), relative field capacity (RFC), air capacity (AC) and saturated hydraulic conductivity (Ks) were also calculated. Using the hybrid algorithm of principle component analysis-artificial neural network (PCA-ANN), the calculated indicators were predicted by the easily available properties. The results showed that PCA-ANN had an acceptable accuracy in the modelling of soil physical quality. The coefficient of determination (R2) of training and testing data for PAW, RFC and AC were 0.82 and 0.81, 0.90 and 0.79, 0.99 and 0.99, respectively. The optimization of Ks did not have the desired results. In other words, the R2 values of the training and testing data for this indicator were equal to 0.25 and 0.13, respectively.
Keywords: Aeration capacity; Plant available water; Relative field capacity; Sustainable agriculture
1. Introduction
Sustainable agriculture depends on soil quality. Although soil quality is not directly measurable, the characteristics of soil that are sensitive to management changes can be used as soil quality indicators (dowu et al, 2007; Mobius et al, 2007). In fact, soil quality is one of the main pillars of agricultural economics in sustainable management. Physical properties of the soil are of particular importance in terms of soil quality, moisture content, and accessibility. Since the direct measurement of these properties require time consuming and costly laboratory work, consideration has been given to the ways in which measurement of these indicators were
Corresponding author. Tel.: +98 913 6252565 Fax: +98 34 43214757
E-mail address:[email protected]
facilitated and easy. The reasons are numerous for the importance of assessing the quality of soil. In particular, low soil quality leads to more water loss, less water retention in the soil, and reduces the water absorption capacity of the plant (Safadoust et al., 2014). Therefore, changes in physical and chemical properties of the soil have a direct effect on the water holding capacity and hydraulic conductivity (Bodhinayake and Si, 2004).
agricultural management (Hebb et al., 2017). It can affect management decisions and improve sustainable agriculture (Andrews et al., 2003). Due to the increased pressure on used land, soil quality assessment is increasing (Armenise et al, 2013).
Indicators are based on simple relationships between observations and information requirements. Some dynamic parameters, including soil structure, have long been considered in soil quality studies (Robinson et al., 2009). Soil’s inherent characteristics and soil acquisition affect the soil's physical quality (Samuel Rosa et al., 2013). Modelling and predicting soil parameters in the recent decades, with data mining methods and multiple algorithms, have been considered and have obtained acceptable results by many researchers. Most of these selected indicators are affected by various features that can be modelled using those features. The indicators can be physical, chemical, and biological.
Marzaioli et al. (2010) created a set of soil quality indicators using physical, chemical and biological indicators, including aggregate stability, bulk density (BD), particle size distribution (PSD), pH, electrical conductivity (EC), cation exchange capacity (CEC), and microbial biomass carbon (MBC). Also, other indicators such as plant available water (PAW), stability index (SI), least limiting water range (LLWR), and organic matter (OM) were used to assess soil quality. Some other indicators of soil physics that are important in agriculture are SI, FC1, BD, OC2 (Reynolds and Top, 2008). Each of these indicators are important in certain context. For example, Armenise et al. (2013) showed that physical indicators are more responsive to management practices compared to chemical indicators. Also, soil physical quality can be assessed in terms of climate availability for plant growth and microbial activity (Skopp et al., 1990). Another indicator of soil physical status is PWP. Raats et al. (2002) showed that PWP is a steady index of the lower available moisture content of the plant. PWP is the amount of water that is strongly kept by the soil, is not absorbed by the plant, and depends on the osmotic coefficient of the plant. OM is another index of the physical quality of soil evaluation. Obriot et al. (2016) showed that the use of OM compared with mineral fertilizers improved soil quality. OM is one of the important elements in
1Field Capacity
maintaining the soil physical quality. Ghosh et al. (2012) observed a significant increase in rice yield by adding organic modifiers to soil (Ghosh et al., 2012). They stated that this is due to the improvement and stability of aggregates. Willekens et al. (2014) showed that reducing agricultural practices along with the addition of organic compounds lead to an improved physical quality of soil.
One of the important issues in soil analysis is the evaluation of its derivative properties. Unsupervised methods of multivariate statistics are powerful tools for evaluating derivative properties that help soil researchers extract more information using their data (Sena et al., 2002). Therefore, a number of physical, molecular, biological, and chemical soil properties are used as predictive such features. Since measuring all soil properties is neither feasible nor cost-effective, there is an expansion in the usage of different algorithms in the modelling of hardly accessible soil parameters.
It seems that the usage of data mining methods in the estimation of hardly accessible soil properties is still under development. Rajkai et al. (2004) estimated the characteristic moisture curve using soil properties with linear and nonlinear methods. Saxton and Rawls (2006) predicted some hardly accessible soil properties using texture and organic materials.
The multivariable PCA method allows for to identification of the most effective and most important parameters and also the use of modelling of target (Sena et al., 2002). The question raised for the usage of PCA is as to which property is more effective and which property is better estimated. PCA is also used to reduce the dimensions of input data and to model and predict indicators. The main purpose of this research was therefore a modelling of soil physical indices with a developed PCA-ANN algorithm.
2. Materials and Methods
2.1. Study Area
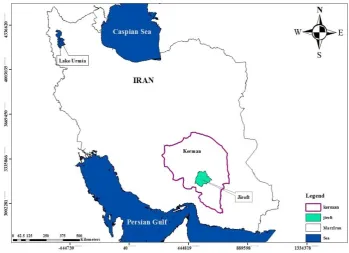
The study area includes parts of the agricultural and gardening lands of Jiroft, which is located in southeastern Iran, in the geographical latitudes of 28˚ 50' to 29˚ 00' N and longitudes of 57˚ 55' to 58˚ 10' E (Figure 1).
2Organic Carbon
Fig. 1. Location of the study area in Kerman Province
The mean elevation from sea level is about 681 meters. In a physiographic view point, this region is piedmont. The climate of this region is warm and dry. Its mean annual rainfall and temperature during a period of 28 years were 159mm and 32.9ºC, respectively. This region is one of the most important agricultural areas in Iran, and many different tropical, semi-tropical and cold products are grown here. Therefore, the assessment of physical quality is important for the sustainability of the agriculture in this area.
2.2. Sampling method
A topographic map of the region with a scale of 1: 25000 was prepared. After plotting the study area on this map, it was imported into ILWIS software 3.4 (ITC, 2007) and was geo-referenced. Then, the location of 140 points with 250 meter intervals were selected as observation points. After that, the location of each point was determined using a global positioning system (GPS). At each observation point, two samples, including one disturbed and one undisturbed sample were placed. Disturbed samples were picked up using a spade and undisturbed samples were taken using cylinders with 5.5cm height and 4.5cm diameter. Finally, all samples were transferred to the laboratory.
2.3. Laboratory Analysis
Disturbed samples were passed through a 2mm sieve after air-drying. Then, soil texture
using the hydrometric method (Bouyoucos, 1951), soil organic matter using the Walkley and Black method (Walkley and Black, 1934), calcium carbonate equivalent (CCE) using neutering with chlorohydric acid (Alison, 1965), electrical conductivity (EC) in saturated extract by the EC-meter device (Richards, 1954), and pH in saturated paste by the pH-meter device (Richards, 1954) were measured. Bulk density was calculated using the undisturbed samples (Blake and Hartge, 1986). Saturation hydraulic conductivity was calculated using the Darcy law (Equation 1):
𝑄 = 𝐾𝐴𝐻𝐿 (1)
Where H is the height of pounded water at the top of soil column (cm), L is the length of the sample (cm), and K is the saturated hydraulic conductivity (cm.min-1), A is the surface area of
the sample (cm2), and Q is the volume of
transferred water per unit time (cm3.min-1). Soil
porosity (F) was also calculated using the equation below (Equation 2):
F=1-BD/PD (2)
moisture retention curve was drawn using the measured soil moistures.
2.4. Calculation of soil physical quality indicators
In order to evaluate the physical quality of soil, some soil quality indicators were calculated as follows:
2.4.1. Plant available water (PAW)
PAW was calculated using the White et al. (2006) method as follows: (Equation 3):
𝑃AW = θFC− θPWP 0 ≤ PAWC ≤ θFC (3)
𝜃 at PWP and FC are water contents at the permanent wilting point and field capacity, respectively.
The reason for assessing this index is due to the great importance in management and its role in the control of soil quality. The accessibility of water in land and water management practices are also very important (Safadoust et al, 2014). Due to the development of computer models, the estimation of some soil indicators were taken into account.
PAW is not only an important factor in crop production and sustainable agriculture (Sys et al., 1991), but is also very important in dry and semi-arid regions. With an increase in the organic matter content, PAW also increases. In our study, we divided PAW into 4 classes based on Cockroft and Olsson (1997) and White et al. (2006), with the clasifications as: ideal, good, limited, and very poor.
PAW≥0.2m3m-3 is defined as the ideal value
for maximum root growth (Cockroft and Olsson, 1997). While in the 0.15 ˂ PAW ≤ 0.2, the root growth is good, at 0.1˂PAW˂0.15, the root growth is limited and 0.1˂ PAW is defined to be a very poor root growth (Warrick, 2002 and White et al, 2006).
2.4.2. Relative Field Capacity
The Relative Field Capacity is calculated using the equation below (Equation 4):
𝑅𝐹C = (θFC
θsat) = (1 − AC
θ) 0 ≤ 𝑅𝐹𝐶 ≤ 1 (4)
θsat is moisture at the point of saturation. It should be noted that optimum occurs at 0.6≤RFC≤0.7. The conditions are not good when moisture is above or below this range.
2.4.3. Air Capacity (AC)
The soil Air capacity was calculated using the below equation (Equation 5):
𝐴𝐶 = 𝜃𝑠𝑎𝑡− 𝜃𝐹𝐶 0 ≤ 𝐴𝐶 ≤ 𝜃𝑠𝑎𝑡 (5)
θsatand θFCare saturated water and moisture in field capacity, respectively. The minimum required ventilation to prevent plant crop losses is at AC≥0.1m3m-3.
2.5. Modelling of soil quality indicators
The modelling of indices was done in MATLAB. The mentioned indices were modelled using the PCA-ANN algorithm with some features, such as percentage of Sand, Silt, Clay, OM, CaCO3, ECe and F. The effect of the
input features on indices have been proven by many researchers in their previous studies (Karhua et al. (2011), Analof and Riehman (2012), Botula et al. (2013) and Moncada et al. (2014)). Therefore, these features were used as input data for the modelling of indices using PCA-ANN.
It should be noted that the process of modelling the indicators were at complete random, and 70% of the data was presented as training data, 15% of the data was selected as testing data, and 15% was selected as validation data.
2.6. Model Assessment Criteria
In order to compare the validity of the modelling of indices, the R2 criterion was used.
Although the values of R2 indicate the precision
of the model, Root Mean Square Error (RMSE) (Equation 6) and Geometric Mean Error Ratio (GMER) (Equation 7) were used to validation of the results.
RMSE = √1N∑ (Xp− Xo) 2 N
i=1 (6)
GMER = exp [N1∑ Ln (XP XO) N
i=1 ] (7)
2.7. Used Software
PCA-ANN hybrid algorithm coding, sensitivity analysis, and the modelling of soil physical quality indices were done by MATLAB. The statistical analysis and evaluation of models were done using Minitab software. The drawing of charts was done by Excel software.
3. Results and Discussion
Descriptive statistics of measured and calculated soil parameters (features and indices)
including maximum, minimum, mean, standard deviation (SD) and coefficient variance (CV) are shown in Table 1. The maximum and least variability range were seen in sand and RFC, respectively (Table 1). Furthermore, all of the indices were classified according to the defined standards (White el al, 2006). Then, using the PCA-ANN, soil indices were modelled and the R2 were obtained. According to the results, the
highest precision (high R2) belonged to the AC
index and the least to that of Ks (Table 2).
Table 1. Summary descriptive Statistical of soil properties and soil physical quality indicators
Feature Unit Mean max min SD CV
Sand % 54.4 88.5 17 15.6 29
Silt % 28.88 56 1.5 13.6 47
Clay % 16.66 44.5 7.5 5.73 34.4
BD Mgm-3 1.56 1.78 1.33 0.11 7.2
F % 0.41 0.5 0.33 0.042 10
OM - 0.021 0.124 0.0034 0.3 56
CaCO3 % 12.83 30 9 3.77 29
Ece dSm-1 3.597 13.73 1.105 1.75 49
PAW m3 m−3 0.2 0.35 0.094 0.044 22
AC m3 m−3 0.42 0.66 0.25 0.083 19.8
RFC m3 m−3 0.0027 0.0044 0.0013 0.0005 19.8
Ks cm.Sec-1 0.0075 0.019 0.0009 0.0045 60
CV: Coefficient Variance, SD: Standard Deviation
3.1. Plant Available Water
Plant Available Water is an important index for assessing the physical quality of the soil. Different methods have been defined for calculating PAW (Asgharzadeh et al., 2010). Generally, the difference between FC and PWP is defined as the available water for the plant (Vomocil, 1965). According to the four classes defined by White et al. (2006), the selected samples in this area were generally good (38.3%) and ideal (49.65%) (Table 2). Several researchers have shown the effect of the multiple features of soil on PAW therefore some of features were chosen for modelling of indicators. The main reason for choosing the selected 10 input features was their effect on the quality indices of soil physics, which have been proven by other
researchers. For instance, Alliaume et al. (2013) showed that FC increased when the amount of OM content increased, which also led to an increase in PAW. In this situation, the quality of the soil structure increased. Also, Khotabai et al. (2013) showed that PAW increased with organic matter.
Reichert et al. (2009) showed that available water varies with the changes in soil texture, which is mostly influenced by the amount of sand and silt to clay ratio. Also, Andrews et al. (2003) stated that with an increase of BD, the amount of PAW increased, and vice versa. These changes are correlated with water availability capacity changes. Therefore, these features were selected as input characteristics in the modelling of the PAW index.
Table 2. The values of statistical criteria for the studied indices
Index PAW Ks RFC AC
Test RMSE 0. 02 3.17 0.00017 0.0029
Train 0.001 4.67 0.0001 0.0005
Test GMER 1.02 1.14 1.001 1.0007
Train 0.99 1.156 1 1.001
Test R2 0.59 0.13 0.7 0.99
Train 0.79 0.52 0.9 0.99
In the forthcoming research, PAW was well modelled using PCA-ANN and the results showed that there was a high correlation between the predicted and calculated PAW where the
developed models had low RMSE and high R2
values (Table 2). The values of RMSE, GMER and R2 in Table 2 confirmed the accuracy of these
under-estimate was found in the training data and a small over-estimate in the testing data. Different hybrid algorithms or meta-heuristic methods have been used by various researchers. Shirani et al. (2015) for instance, modelled PAW using PSO-DT. They achieved goodness-of-fit of the proposed PSO-DT model for the prediction of PAWC with R2≥90. Yang et al. (2016) used a
combination of neural networks and wavelets to predict the soil moisture; they achieved successful results.
The sensitivity analysis using the Statsoft Method showed that the PAW had high sensitivity to silt content. In this research, based on the four classes provided for PAW (White et al., 2006), only 2% of soil samples were classified under the poor classes. Also, 10, 38.2 and 49% of soil samples belonged to the limited, good, and ideal classes, respectively.
3.2. Relative Field Capacity (RFC)
Because the White et al. (2006) air capacity was divided into classes, desired and poor, the results showed that most of the soil samples in this study was at a desired quality (84%) and 16% of them were at a poor class. Also, using input features, Table 2 shows the modelling of the RFC index using the PCA-ANN algorithm. As shown in Table 2, the value of R2 was high in both the
training and testing data (0.9 and 0.79, respectively). Based on the GMER results, a little over-fitting was observed, but the low RMSE could have indicated the suitability of the selected features for RFC modelling (Table 2). The effect of some of the input features on RFC have been studied by other researchers.
For example, Safadoust et al. (2014) showed that FC had a positive correlation with calcium carbonate, clay, and organic matter. They explained that this relationship was due to the greater surface area, which is available to keep moisture at a high suction in high density soil. The use of evolutionary algorithms for the modelling of RFC and other soil moisture parameters have been considered by researchers. In a study that was done by Shirani et al. (2015), RFC was modelled using PSO-DT with an acceptable accuracy. In the RFC modelling of PSO-DT, the R2 in training and testing data were
0.44 and 0.47, respectively (Shirani et al., 2015). In the forthcoming study, R2 of the modelling of
the RFC index in training and testing data was 0.9 and 0.79, respectively. This could indicate the accuracy of PCA-ANN compared to that of PSO-DT.
Also, yang and you (2013) predicted the parameters of the Van Genuchten model in
SWRC using artificial intelligence algorithms (Genetic Algorithm, Particle Swarm Optimization, Simulated Anneling, and Rosetta). They showed that PSO provides better results in estimating the parameters of the model algorithms. The high value of R2 in the results of
the present study, confirmed the hypothesis of the suitability of PCA-ANN in the estimation of RFC. It also indicated the suitability of the chosen input features for the modelling of this index. Therefore, it can be concluded that PCA-ANN could be an appropriate algorithm for the RFC prediction. In addition, the results of the sensitivity analysis showed that RFC is more sensitive to clay.
3.3. Air Capacity (AC)
The results of this study showed that the soils of the studied area, according to White's (2006) classification, had the highest class and they all belonged to the ideal class. In other words, all soils had an air capacity of more than 0.28. Reynolds et al. (2002, 2009) showed that the AC is less or high because of their impact on soil water retention. In spite of the over-fitting in the modelling of AC using PCA-ANN (Table 2), because of high R2 and low RMSE, prediction of
AC index had good accuracy (Table 2). The results of this study showed that using PCA-ANN with AC is better predicted than other used algorithms in the previous studies done by other researchers. Shirani et al. (2015) predicted the AC value using PSO-DT and measured the R2
value in testing data.
The influence of some input features on the quality of soil, especially AC, has been considered. For example, Reynolds et al. (2002) showed that AC was affected by clay. FC decreased by the flocculation of clay, which directly affected AC. The clay content affected the soil structure formation and porosity. If clay is optimal, the soil structure is well formed. The good structure result in optimal AC. Because, water holding capacity in the soil, the amount of saturated, drained water, and thus the AC were affected by the percentage of clay. Archer and Smith (1972) also showed that an increase in BD caused a linear increase in the amount of AC. Also, the result of the sensitivity analysis, using the Statsoft Method, showed that AC had high sensitivity to porosity (F).
3.4. Hydraulic Conductivity at saturation (Ks)
(permeable, semi-permeable, and impermeable). he Ks results of this study showed that 99% of soil samples were permeable and only 1% belonged to the semi-permeable class. It is obvious that Ks measurement is time and cost consuming. Therefore, choosing a method that could model and predict Ks with an acceptable accuracy was necessary. For this purpose, Ks was predicted and modelled using PCA-ANN. The results showed that the prediction of Ks had a low precision. Applying PCA-ANN for prediction of Ks, was less reliable than the other indices. Therefore, because of low R2, high RMSE, and
over-fitting of results, using PCA-ANN algorithm to modelling of Ks must be taken care (Table 2). In recent years, the use of various algorithms has been considered in modelling and optimizing the saturated hydraulic conductivity, which in some cases has yielded acceptable results. Ghanbarian-Alavijeh et al. (2010) showed that the use of ANN leads to an accurate estimation of Ks. Although hydraulic conductivity at an unsaturated condition was correctly predicted using ANN by Al-Sulaiman and Aboukarima (2016), good results were not achieved in the modelling of Ks using artificial neural networks.
The results of this study showed a high inefficiency of PCA-ANN for the modelling of Ks. Many factors may lead to low R2 which
would not be considered in this research. For example unjust features or algorithm.
Therefore, it seems that it would have been better to use other features or other algorithms in the predicting and modelling of Ks. Overall, the results showed that PCA-ANN was an appropriate algorithm for modelling the studied indices. This algorithm has been used in many modelling parameters. Among them, Nouri et al. (2011) showed that the results of modelling are good. The correlation between estimated and measured of indices, both training and testing data, were good (0.92 and 0.88, respectively). Although they stated that the accuracy of PCA-ANN was higher than PCA-SVM. They showed that the correlation coefficients in training and testing data were high (0.93 and 0.85, respectively). The results of the sensitivity analysis using the Statsoft Method showed that Ks was more sensitive to bulk density.
4. Conclusion
Our results showed that the developed PCA-ANN method could be an appropriate algorithm for the modelling of different indices. It was observed that indicators could be estimated by many algorithms, preferably PCA. Also they are
affected by features. However, it should be noted that the results of the modelling of Ks, using the PCA-ANN method, was improper and thus a more suitable algorithm or a more perfect method should be developed for this prediction.
References
Alliaume, F., W.A.H. Rossing, M. García, K.E. Giller, S. Dogliotti, 2013. Changes in soil quality and plant available water capacity following systems redesign on commercial vegetable farms. European Journal of Agronomy, 46; 10– 19.
Alison, L. E., C.D. Modie, 1965. Carbonate. In: C. A. Black, (Ed.), Methods of soil analysis. Part II, Am. Soc. Agron., Madison, WI. P. 1379-1396. Al-Sulaiman, M. A., A. M. Aboukarima, 2016. Prediction of Unsaturated Hydraulic Conductivity of Agricultural Soils Using Artificial Neural Network and c#. Journal of Agriculture and Ecology Research International, 5; 1-15.
Anlauf, R., P. Rehrmann, 2012. Effect of compaction on soil hydraulic parameters of vegetative landfill covers. Geomaterials, 2; 29–36.
Andrewsa, S.S., C.B. Florab, J.P. Mitchellc, D.L. Karlen, 2003. Growers’ perceptions and acceptance of soil quality indices. Geoderma, 114; 187– 213.
Andrews, S S., D. L. Karlen, C.A. Cambardella, 2004. The soil management assessment framework: A quantitative soil quality evaluation method. Soil Science Society American Journal, 68; 1945-1962. Archer, J.R., P.D. Smith, 1972. The relation between bulk density, available water capacity, and air capacity of soils. Journal of Soil Science, 23; 475-480.
Armenise, E., M.A. Redmile-Gordon, A.M. Stellacci, A. Ciccarese, P. Rubino, 2013. Developing a soil quality index to compare soil fitness for agricultural use under different managements in the Mediterranean environment. Soil Tillage Res., 130; 91–98.
Asgharzadeh, H., M.R. Mosaddeghi, A.A. Mahboubi, A. Nosrati, A.R. Dexter, 2010. Soil water availability for plants as quantified by conventional available water, least limiting water range and integral water capacity. Plant Soil, 335; 229-244.
Blake, G. R., Hartge, K. H., 1986. Particle Density, in: Klute, A. (eds), Methods Of Soil Analysis, Part 1(Physical and Mineralogical Methods), Second Edition, Madison, Wisconsin USA, pp. 363-382. Bodhinayake, W., B.C. Si, 2004. Near-saturated surface soil hydraulic properties under different land uses in the St Denis National Wildlife Area Saskatchewan, Canada. Hydrol. Process, 18; 2835–2850.
Botula, Y.D., A. Nemes, P. Mafuka, E. Van Ranst, W.M. Cornelis, 2013. Prediction of water retention of soils from the humid tropics by the nonparametric k-nearest neighbor approach. Vadose Zone J, 12; http://dx.doi.org /10.2136/vzj2012.0123.
Bouyoucos, G. J., 1951. A recalibration of hydrometer method for making mechanical analysis of soil. Agronomy Journal, 43; 434-438.
Cockroft, B., K.A. Olsson, 1997. Case study of soil quality in south eastern Australian management of structure for roots in duplex soils. In: Gregorich, E.G., Carter, M.R. (Eds.), Soil Quality for Crop Production and Ecosystem Health. In: Developments in Soil Science, vol. 25. Elsevier, New York, NY. Pp. 339–
Idowu, O.J., H.M. van Es, G.S. Abawi, D.W. Wolfe, J.I. Ball, B.K. Gugino, B.N. Moebius, R.R. Schindelbeck, A.V. Bilgili, 2007. Farmer-Oriented Assessment of Soil Quality using Field, Laboratory, and VNIR Spectroscopy Methods Plant and Soil. In review. Ghanbarian-Alavijeh, B., A.M. Liaghat, S. Sohrabi, 2010. Estimating Saturated Hydraulic Conductivity from Soil Physical Properties using Neural Networks Model. International Scholarly and Scientific Research and Innovation, 4; 58-63.
Ghosh, S., B. Wilson, S. Ghoshald, N. Senapati, B. Mandal, 2012. Organic amendments influence soil quality and carbon sequestration in the Indo-Gangetic plains of India. Agriculture, Ecosystems and Environment, 156; 134– 141.
Hebb, Ch., D. Schoderbek, G. Hernandez-Ramirez, D. Hewinsd, C.N. Carlyle, E. Bork, 2017. Soil physical quality varies among contrasting land uses in Northern Prairie regions. Agriculture, Ecosystems and Environment, 240; 14–23.
Karlen, DL., S.S. Andrews, JW. Doran, 2001. Soil quality: Current concepts and applications. Advances in Agronomy, 74; 1-40.
Karlen, D.L., C.A. Ditzler, S.S. Andrews, 2003. Soil quality: why and how? Geoderma, 114; 145–156. Karhua, K., T. Mattilab, I. Bergstr, M.K. Regina, 2011. Biochar addition to agricultural soil increased CH4 uptake and water holding capacity - Results from a short-term pilot field study. Agriculture, Ecosystems and Environment, 140; 309–313.
Khotabaeia, M., H. Emami, A.R. Astaraei, A. Fotovat, 2013. Improving Soil hysical Indicators by Soil Amendment to a Saline-Sodic Soil. Desert, 18; 73- 78.
Marquez, C.O., V.J. Garcia, C.A. Cambardella, R.C. Schultz, T.M. Isenhart, 2004. Aggregate size stability distribution and soil stability. Soil Science Society American Joiurnal, 68; 725-735.
Marzaioli, R., Ascoli, R.D., De Pascale, R.A., Rutigliano, F.A., 2010. Soil quzwartality in a Mediterranean area of Southern Italy as related to different land use types. Applied Soil Ecology, 44; 205–212.
Moebius, B.N., H.M. van Es, R.R. Schindelbeck, O.J. Idowu, D.J. Clune, J.E. Thies, 2007. Evaluation of laboratory-measured soil physical properties as indicators of soil physical quality. Soil Sci., 172; 895- 912.
Moncada, M.P., D. Gabriels, W.M. Cornelis, 2014. Data- driven analysis of soil quality indicators using limited data. Geoderma, 235–236; 271–278.
Mueller, L., B.D. Kay, B. Been, C. Hu, Y. Zhang, M. Wolff, F. Eulenstein, U. Schindler, 2008. Visual assessment of soil structure: Part II. Implications of tillage, rotation and traffic on sites in Canada, China and Germany. Soil Tillage. Research, 103; 188–196. Noori, R., A. R. Karbassi, A. Moghaddamnia, D. Han, M. H. Zokaei-Ashtiani, A. Farokhnia, M. Ghafari Gousheh, 2011. Assessment of input variables determination on the SVM model performance using PCA, Gamma test, and forward selection techniques for monthly stream flow prediction. Journal of Hydrology, 401; 177-189.
Oliveira, T.C., L.F.S. da Silva, M. Cooper, 2014. Evaluation of Physical Quality Indices of a Soil under a Seasonal Semideciduous Forest. R. Bras. Ci. Solo, 38; 444-453.
Obe, O.O., D.K. Shangodoyin, 2010. Artificial Neural Network Based Model for Forecasting Sugar Cane Production. Journal of Computer Science, 6; 439-445. Obriot, F., M. Stauffer, Y. Goubard, N. Cheviron, G. Peres, M. Eden, A. Revallier, L. Vieublé-Gonod, S. Houot, 2016. Multi-criteria indices to evaluate the effects of repeated organic amendment applications on soil and crop quality. Agriculture, Ecosystems and Environment, 232; 165–178
Rajkai, K.L., S.N. Kabos, M.Th. van Genuchten, 2004. Estimating the water retention curve from soil properties: comparison of linear, nonlinear and concomitant variable methods. Soil and Tillage Research, 79; 145–152.
Raats, P.A.C., D.E. Smiles, A.W. Warrick, 2002. Contributions to environmental mechanics: Introduction. In Environmental Mechanics: Water, Mass and Energy Transfer in the Biosphere (Raats, P.A.C., Smiles, D.E., Warrick, A.W., Eds.), pp. 1–28. Geophys. Monogr 129. American Geophysical Union: Washington, DC.
Reynolds, WD., BT. Bowman, CF. Drury, C.S. Tan, X. L u., 2002. Indicators of good soil physical quality, density and storage parameters. Geoderma, 110; 131- 146.
Reynolds, W.D., G.C. Topp, 2008. Soil water desorption and imbibition: tension and pressure techniques. In: Carter MR, Gregorich EG. (Eds.), Soil Sampling and Methods of Analysis, 2nd edition. Canadian Society of Soil Science. Taylor and Francis, LLC, Boca Raton, FL. Pp. 981-997.
Reynolds W.D., C.F. Drury, C.S. Tan, C.A. Fox, X.M. Yang, 2009. Use of indicators and pore volumefunction characteristics to quantify soil physical quality. Geoderma, 152; 252-263.
Reichert; J.M., J.A. Albuquerque, D.R. Kaiser, D.J. Reinert, F.L. Urach, R. Carlesso, 2009. Estimation of water retention and availability in soils of Rio Grande do Sul. Revista Brasileira de Ciência do Solo. Rev. Bras. Ciênc. Solo, 33; 1547-1560.
Richards, L. A., 1954. Diagnosis and Improvement of Saline and Alkali Soils. Soil Science, 78; 7-33. Robinson, D.A., I. Lebron, H. Vereecken, 2009. On the definition of the natural capital of soils: a framework for description evaluation, and monitoring. Soil Science Society American Joiurnal, 73; 1904–1911. Safadoust, A., P. Feizee, A.A. Mahboubi, B. Gharabaghi, M.R. Mosaddeghi, B. Ahrens, 2014. Least limiting water range as affected by soil texture and cropping system. Agricultural Water Management, 136; 34– 41 Samuel-Rosa; A., R.S. Diniz Dalmolin, P. Miguel, 2013. Building predictive models of soil particle-size distribution. R. Bras. Ci. Solo, 37; 422-430.
Saxton, K. E., W. J. Rawls, 2006. Soil Water Characteristic Estimates by Texture and Organic Matter for Hydrologic Solutions. Soil Science Society American Joiurnal, 70; 1569–1578.
Sena, M.M., R.T.S. Frighetto, P.J. Valarini, H. Tokeshi, R.J. Poppi, 2002. Discrimination of management effects on soil parameters by using principal component analysis: a multivariate analysis case study. Soil and Tillage Research, 67; 171–181. Shahab, H., H. Emami, G.H. Haghnia, A. Karimi, 2013. Pore size distribution as a soil physical quality index for agricultural and pasture soils in Northeastern Iran. Pedosphere, 23; 312–320.
influencing physical quality of calcareous soils in a semiarid region of Iran using a hybrid PSO-DT algorithm. Geoderma, 259–260; 1–11.
Skopp, J., M.D. Jawson, J.W. Doran, 1990. Steady-state aerobic microbial activity as a function of soil water content. Soil Science Society American Joiurnal, 54; 1619–1625.
Sys, C., E. Van Ranst, J. Debaveye, 1991. Land Evaluation. Part I, General Administration for Development Cooperation Eds., Brussels, Belgium, van den Akker, J.J.H., B. Soane, 2005. Encyclopedia of Soils in the Environment. pp. 285-293
Vomocil, J.A., 1965. Porosity. In: Black, C.A. (Ed.), Methods of Soil Analysis. Part 1. Agron. Monogr. 9. ASA, Madison, WI. pp. 299–314.
Warrick, A.W., 2002. Soil Physics Companion. CRC Press LLC, Boca Raton, USA.
White, R.E., 2006. Principles and Practice of Soil Science, 4th edition. Blackwell Publishing, Oxford, UK.
Walkley, A., I.A. Black, 1934. An examination of the
degtjareff method for determining soil organic matter, and a proposed modification of the chromic acid titration method. Soil Science Society American Joiurnal, 37; 29–38.
Willekens, K., B. Vandecasteele, A. De Vliegher, 2014. Soil quality and crop productivity as affected by different soil management systems in organic agriculture. Building Organic Bridges’, at the Organic World Congress. 13-15 Oct., Istanbul, Turkey. White, R. E., 2006. Principles and Practice of Soil Science. 4th Edition, Blackwell Publishing, Oxford, UK. P. 363.
Yan, Xu., X. You, 2013. Estimating Parameters of Van Genuchten Model for Soil Water Retention Curve by Intelligent Algorithms. Applied Mathematics & Information Sciences, 7; 1977-1983.