DEMOGRAPHIC RESEARCH
VOLUME 30, ARTICLE 12, PAGES 361-376
PUBLISHED 5 FEBRUARY 2014
http://www.demographic-research.org/Volumes/Vol30/12/ DOI: 10.4054/DemRes.2013.30.12
Descriptive Finding
Estimating the contribution of mothers of
foreign origin to total fertility: The recent
recovery of period fertility in the Belgian region
of Flanders
Lisa Van Landschoot
Jan Van Bavel
Helga A.G. de Valk
© 2014 Lisa Van Landschoot et. al.
This open-access work is published under the terms of the Creative Commons Attribution NonCommercial License 2.0 Germany, which permits use, reproduction & distribution in any medium for non-commercial purposes, provided the original author(s) and source are given credit.
1 Introduction 362
2 Migration context and migrant fertility 363
3 Data and methods 365
4 Results 366
5 Summary and discussion 372
Estimating the contribution of mothers of foreign origin to total
fertility: The recent recovery of period fertility in the Belgian region
of Flanders
Lisa Van Landschoot1
Jan Van Bavel2
Helga A.G. de Valk3
Abstract
BACKGROUND
Since the early 21st century, period total fertility has been recovering from (very) low levels in many European countries. This trend is partly attributable to the end of the postponement of childbearing. The question has risen, however, to what extent this recovery is also related to the changing ethnic composition of European populations.
OBJECTIVE
In this paper, we investigate to what extent the population of foreign origin contributed to the recent (2001/2008) recovery of period fertility in the Belgian region of Flanders.
METHODS
We use data from the Flemish Family and Child Care Agency for calculating time trends in the share of births to foreign origin groups. We furthermore propose a counterfactual method that allows us to assess indirectly the role played by births to women of foreign origin in the recent recovery of fertility.
RESULTS AND CONCLUSION
Overall, we find that births to women of foreign origin have made increasingly important contributions to the number of children born in the Flemish region: between 2001 and 2008, the share of births to women of foreign origin grew from 16% to 20%. Nevertheless, the results from our counterfactual fertility analysis indicate that the recovery of fertility in Flanders would have occurred even in the absence of any births
1
Vrije Universiteit Brussel, Interface Demography; Pleinlaan 2, 1030 Brussels (Belgium). Phone: +322 614 81 36. E-Mail: [email protected].
2 Vrije Universiteit Brussel, Interface Demography. University of Leuven, Centre for Sociological Research:
E-Mail: [email protected].
3
to women of foreign origin. The recovery can in large part be attributed to births among the native Belgian population.
1. Introduction
Following the baby boom and the subsequent baby bust, period fertility had dipped to all-time low levels in Europe by the 1990s. In a number of Southern European as well as Central and Eastern European countries, period total fertility rates (PTFR) fell below 1.3 (Kohler, Billari, and Ortega 2002). In many Western European countries, fertility levels remained slightly higher, but a number of these countries also experienced all-time lows (Coleman 2006, Sobotka 2004). In the beginning of the 21th century, however, the PTFR recovered in most European countries (Goldstein, Sobotka, and Jasilioniene 2009).
In the literature, three main explanations for this fertility recovery have been proposed. First, scholars have noted that the process of the postponement of childbearing has come to an end in a number of countries. This development was analyzed in detail in a paper by Goldstein, Sobotka, and Jasilioniene (2009). A second possible explanation was suggested by Toulemon, Pailhé, and Rossier (2008). In their paper, they attributed the relatively high and stable fertility in France to the active family policies the country implemented after World War II. To the extent that similar policies have been adopted in other countries, these policies may have contributed to the recovery of fertility. Third, some studies have linked the resurgence of fertility to the recent increase in the share of non-European migrants among European populations (Goldstein, Sobotka, and Jasilioniene 2009, Sobotka 2008). These scholars have argued that migration has become an important factor in demographic change, and has been the main source of recent population growth in many European countries (Coleman 2006). As migrant women from certain non-Western countries typically have higher fertility levels than native European women, their childbearing patterns may have an impact on period fertility in Europe (Fokkema et al. 2008, Sobotka 2008).
indirectly the impact of births to women of foreign origin in a context in which statistics are based on nationality rather than origin, and the data needed to calculate conventional fertility rates for groups by descent are lacking. Our suggested counterfactual approach enables us to estimate how fertility rates would have evolved in the absence of births to women of foreign origin (including women both with and without Belgian nationality).
2. Migration context and migrant fertility
The history of migration to Belgium is varied, as the migrants entering Belgium have come from different countries and have had a wide range of reasons for migration. Like a number of other Western European countries, Belgium recruited guest workers to fill industrial jobs after World War II. Many of these migrants came from Southern Europe and the Mediterranean region. Most were men who were later joined by their families. Family formation remains important for these groups even today (Timmerman, Vanderwaeren, and Crul 2003). In addition, a substantial share of migrants to Belgium come from the former Belgian colony of Congo. Still others entered the country as refugees. Belgium has also been experiencing a large and stable inflow of European migrants. In general, Belgium has had a positive migration balance (of foreigners), with yearly net migration rising from 23,427 in 1990 to 64,489 in 2007 (FOD Economie K.M.O., Middenstand en Energie 2013a).
This migration history is reflected in the migrant population currently residing in the country. In the Flemish (northern) region of Belgium, we find a large share of European migrants among the foreign population, particularly migrants from France, Italy, and the Netherlands. Migrants from Turkey and Morocco are the largest non-Western group in the Flemish region (Centrum voor gelijkheid van kansen en voor racismebestrijding 2012).
Table 1: Female population in the Flemish region by nationality, 2001-2008
Nationality Year
2001 2002 2003 2004 2005 2006 2007 2008
Total female population 3,017,612 3,027,715 3,038,995 3,049,384 3,063,336 3,081,104 3,100,377 3,121,644
Belgian nationality 2,844,206 2,897,253 2,905,912 2,911,702 2,920,466 2,929,478 2,940,000 2,950,805
Foreign nationality
133,406 130,462 133,083 137,682 142,870 151,626 160,377 170,839
% Foreign population in
total female population 4.4% 4.3% 4.4% 4.5% 4.7% 4.9% 5.2% 5.5%
Foreign nationality: main countries of origin
France
8,367 8,468 8,547 8,593 8,743 8,872 .* 9,334
Italy 10,193 10,071 10,009 9,809 9,722 9,623 .* 9,498
The Netherlands 34,685 36,329 38,193 40,059 41,949 44,404 .* 50,181
Total
53,245 54,868 56,749 58,461 60,414 62,899 .* 69,013
% within foreign
population 39.9% 42.1% 42.6% 42.5% 42.3% 41.5% 40.4%
Turkey
14,133 11,009 10,286 10,038 9,708 9,657 .* 9,741
Morocco 17,099 13,640 12,608 12,650 12,795 12,839 .* 13,195
Total 31,232 24,649 22,894 22,688 22,503 22,496 .* 22,936
% within foreign
population 23.4% 18.9% 17.2% 16.5% 15.8% 14.8% 13.4%
Source: Nationaal Instituut voor de Statistiek (2000, 2003a, 2003b), Algemene Directie Statistiek en Economische Informatie (2004), FOD Economie Algemene Directie Statistiek en Economische Informatie (2007, 2008, 2009), FOD Economie K.M.O., Middenstand en Energie (2013b).
* Data not available.
Belgium for at least seven years and are legally entitled to permanent residence. People who have had their main residence in Belgium for at least three years may be granted Belgian nationality by naturalization as well. Finally, an individual may acquire nationality through marriage to a Belgian citizen after living with the partner between six months and three years, depending on specific conditions. Unlike in many other European countries, all these procedures for acquiring nationality are available free of charge (see Belgische Federale Overheidsdiensten 2012 for all legal details).
Key to our study is the fact that Belgian residents of foreign origin (those who were born outside of Belgium are called the first generation, while those who were born in Belgium to foreign-born parents are called the second generation) who have obtained the Belgian nationality are not visible in the statistics. Since the statistics are based on nationality only, those who have acquired Belgian nationality are simply counted as Belgian nationals.
Previous work on the impact of migration on fertility and the ways in which migrants contribute to the aggregate fertility rates across Europe has shown that fertility is generally higher among migrants than among the native population. Nevertheless, although the share in the total number of births attributable to migrants has increased, the net effect of their higher fertility on period fertility has been found to be small (Sobotka 2008). The results of these studies indicated that period total fertility in the country of residence would have been between 0.05 and 0.10 lower in the absence of births to the migrant population (see also Héran and Pison 2007, Toulemon, Pailhé, and Rossier 2008).
3. Data and methods
For the numerators of age-specific fertility rates, we took the number of births by the original nationality of the mother from the Ikaros database compiled by Kind & Gezin, the official Flemish Family and Child Care Agency. This agency registers key information on all births, linking their records to the births in the national population register, and thus covers all of the births in the Flemish region (Van Bavel and Bastiaenssen 2006).
For the denominators, we lack information on original nationality. To analyze the contribution to period fertility of births to women who acquired Belgian nationality, we calculated the actual fertility rates (equation 1) and compared these rates with virtual fertility rates (equation 2). The latter are the counterfactual fertility rates we would have observed if women who acquired Belgian nationality had been included in the population at risk, but had not given birth in the period under study. To the extent that the trend in the virtual fertility rates resembles the actual fertility rates, we may conclude that fertility would have recovered even without the births to women who acquired Belgian nationality.
Actual age-specific fertility of Belgian women =
+ (1)
On the right hand side of the first equation, the numerator of the left term includes births to women who were lifelong Belgian nationals (native Belgian women). The numerator of the right term includes births to women who were of foreign origin, but who later acquired Belgian nationality. For the denominator, we lack this information. We will therefore calculated virtual fertility rates by leaving out the numbers of births to women who acquired Belgian nationality; i.e., setting the numerator of the last term in equation (1) equal to zero (see equation 2), and comparing these rates with the observed rates for Belgian women. The virtual fertility rates for native Belgian women were calculated as follows:
Virtual age-specific fertility of Belgian women=
+ (2)
4. Results
population increased by 0.29 children between 2001 (1.52) and 2008 (1.81), indicating a revival of fertility4.
Table 2: Period total fertility rates in the Flemish region by nationality, 2001-20085,6
Nationality Year Differences
2008-2001
2001 2002 2003 2004 2005 2006 2007 2008
(1) Belgian7 1.43 1.45 1.47 1.54 1.59 1.62 1.65 1.71 +0.28
(2) Foreign 2.93 2.95 2.99 3.12 3.00 3.02 3.02 2.92 -0.01
(3) Total population 1.52 1.54 1.56 1.64 1.68 1.72 1.75 1.81 +0.29
PTFR* 1.56 1.56 1.58 1.65 1.70 1.74 1.77 1.82 +0.26
(3) – (1) 0.09 0.09 0.09 0.10 0.09 0.10 0.10 0.10 +0.01
Source: Kind & Gezin, Ikaros and Statistics Belgium. Authors’ calculations. * PTFR calculated by Statistics Belgium.
We also found a difference between the women of Belgian nationality and the women of foreign nationality (Table 2): the latter group had higher overall fertility rates and started their childbearing earlier in all of the years (shown by the age-specific fertility rates in Figure 1). Over time, the PTFR among Belgian women increased constantly, by 0.28 children overall; while it declined by 0.01 children among women of foreign nationality. Among this latter group, a decrease of 0.10 children between 2007 and 2008 was preceded by an increase of 0.19 children from 2.93 in 2001 to 3.12 in 2004. Nevertheless, the impact of births among women of foreign nationality on the PTFR was rather limited, as the rate would have been about one-tenth of a child lower without women of foreign nationality (last row and column Table 2).
4
Table 2 indicates that even though we used two different data sources for calculating the fertility rates, our results differ negligibly from the calculations of Statistics Belgium.
5 Stillborn babies and adopted children were not included in the analyses.
6 Births to women who had been Belgian nationals, but who acquired another nationality before giving birth,
Figure 1: Age-specific fertility rates in the Flemish region, 2001-2008
a) Belgian nationality
b) Foreign nationality
Source: Kind & Gezin, Ikaros and Statistics Belgium. Authors’ calculations.
0 0.02 0.04 0.06 0.08 0.1 0.12 0.14 0.16 0.18 0.2
15-19 20-24 25-29 30-34 35-39 40-44 45-49
Fe
rtil
ity
rat
e
Age mother
2001 2003 2005 2007 2008
0 0.02 0.04 0.06 0.08 0.1 0.12 0.14 0.16 0.18 0.2
15-19 20-24 25-29 30-34 35-39 40-44 45-49
Fer
til
ity
rate
Age mother
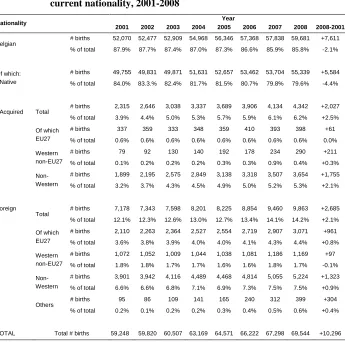
An overview of the evolution of the absolute numbers and proportions of births among the three groups distinguished in our study (native Belgian women, women who acquired Belgian nationality, and women of foreign nationality) by region of origin (EU278, Western non-EU279 and non-Western10) is provided in Table 3. Whereas the relative share of births to native Belgian women declined between 2001 and 2008 (from 84% to 80%), the relative contribution of births to women of foreign origin increased by 2.5% among women who acquired Belgian nationality, and by 2.1% among women of foreign nationality. The distinction by region by the (original) nationalities of the mothers shows the particular importance of women of a non-Western (original or current) nationality in the observed increase. The absolute number of babies increased by 1,755 among the non-Western women who had acquired Belgian nationality. Among the non-Western foreigners, there were 1,323 more births in 2008 than in first year of the observation period. Together, they accounted for an increase of three percentage points. The increase in the relative weight in the total number of births among the women of foreign origin suggests that their childbearing activity may have indeed contributed to the recovery in fertility rates in the studied period.
8
EU27: Bulgaria, Cyprus, Denmark, Germany, Estonia, Finland, France, Greece, Hungary, Ireland, Italy, Latvia, Lithuania, Luxembourg, Malta, the Netherlands, Austria, Poland, Portugal, Romania, Slovakia, Slovenia, Spain, Czech Republic, the United Kingdom, Sweden.
9
Western non-EU27: Albania, Australia, Bosnia-Herzegovina, Canada, the United States of America, Gibraltar, Iceland, Japan, Yugoslavia, Kosovo, Croatia, Macedonia, Moldova, Monaco, New Zealand, Norway, Ukraine, Russia, Son Marino, Serbia/Montenegro, Belarus, Switzerland.
Table 3: Absolute number and proportion of births in the Flemish region by current nationality, 2001-2008
Nationality Year
2001 2002 2003 2004 2005 2006 2007 2008 2008-2001
Belgian
# births 52,070 52,477 52,909 54,968 56,346 57,368 57,838 59,681 +7,611
% of total 87.9% 87.7% 87.4% 87.0% 87.3% 86.6% 85.9% 85.8% -2.1%
Of which: - Native
# births 49,755 49,831 49,871 51,631 52,657 53,462 53,704 55,339 +5,584
% of total 84.0% 83.3.% 82.4% 81.7% 81.5% 80.7% 79.8% 79.6% -4.4%
- Acquired Total
# births 2,315 2,646 3,038 3,337 3,689 3,906 4,134 4,342 +2,027
% of total 3.9% 4.4% 5.0% 5.3% 5.7% 5.9% 6.1% 6.2% +2.5%
Of which EU27
# births 337 359 333 348 359 410 393 398 +61
% of total 0.6% 0.6% 0.6% 0.6% 0.6% 0.6% 0.6% 0.6% 0.0%
Western non-EU27
# births 79 92 130 140 192 178 234 290 +211
% of total 0.1% 0.2% 0.2% 0.2% 0.3% 0.3% 0.9% 0.4% +0.3%
Non-Western
# births 1,899 2,195 2,575 2,849 3,138 3,318 3,507 3,654 +1,755
% of total 3.2% 3.7% 4.3% 4.5% 4.9% 5.0% 5.2% 5.3% +2.1%
Foreign
Total
# births 7,178 7,343 7,598 8,201 8,225 8,854 9,460 9,863 +2,685
% of total 12.1% 12.3% 12.6% 13.0% 12.7% 13.4% 14.1% 14.2% +2.1%
Of which EU27
# births 2,110 2,263 2,364 2,527 2,554 2,719 2,907 3,071 +961
% of total 3.6% 3.8% 3.9% 4.0% 4.0% 4.1% 4.3% 4.4% +0.8%
Western non-EU27
# births 1,072 1,052 1,009 1,044 1,038 1,081 1,186 1,169 +97
% of total 1.8% 1.8% 1.7% 1.7% 1.6% 1.6% 1.8% 1.7% -0.1%
Non-Western
# births 3,901 3,942 4,116 4,489 4,468 4,814 5,055 5,224 +1,323
% of total 6.6% 6.6% 6.8% 7.1% 6.9% 7.3% 7.5% 7.5% +0.9%
Others # births 95 86 109 141 165 240 312 399 +304
% of total 0.2% 0.1% 0.2% 0.2% 0.3% 0.4% 0.5% 0.6% +0.4%
TOTAL Total # births 59,248 59,820 60,507 63,169 64,571 66,222 67,298 69,544 +10,296
Given the challenges we face in calculating fertility rates for the relevant subgroups, we reported virtual fertility rates in Figure 2 in order to examine whether the same recovery could be observed in these rates as was found in the actual data. In the counterfactual case, in which women of foreign origin who acquired Belgian nationality had no children in the research period, fertility would still have recovered as observed in the actual fertility rates. The virtual fertility rates (Figure 2), including only the births to native Belgian women, showed a recovery of almost the same magnitude as the actual fertility rates. As was mentioned above, the period fertility for all women of Belgian nationality increased from 1.43 in 2001 to 1.71 in 2008, or 19.6%. Meanwhile, the virtual total fertility rate increased from 1.36 in 2001 to 1.60 in 2008, or 17.6%. Moreover, virtual fertility rose in the 25-29 age group, and increased to an even greater extent in the 30-34 age group. These findings therefore indicate that the revival of total period fertility is not entirely attributable to the contribution of births among women of foreign origin, since fertility also increased markedly among native Belgian women, and especially among women aged 30 or older.
Figure 2: Contribution of native Belgian women to the age-specific fertility rates of all Belgian nationals in the Flemish region, 2001-2008
Source: Kind & Gezin, Ikaros and Statistics Belgium. Authors’ calculations.
0 0.05 0.1 0.15 0.2
15-19 20-24 25-29 30-34 35-39 40-44 45-49
Con
tr
ib
u
ti
on
n
ati
ve
wo
m
en
Age mother
5. Summary and discussion
In this paper, we analyzed the extent to which births to women of foreign origin were responsible for the recent recovery of period total fertility in the Belgian region of Flanders. We did so by expanding our investigation of this issue to include all women of foreign origin, regardless of whether they had a foreign nationality or acquired Belgian nationality. Previous studies have often assigned the latter group to the native population, which may have led to an underestimation of the contribution to total fertility of births to migrant women. Because of the limitations of the Belgian data, it was only possible to distinguish between the original and the current nationality of each mother for the numerators of fertility rates. We therefore applied two additional complementary analytical strategies. First, we analyzed how the relative weight in the total number of births evolved for the different nationality groups between 2001 and 2008. Second, we calculated counterfactual fertility rates in order to analyze whether fertility would have recovered even without the births to women who had acquired Belgian nationality.
In line with data from Statistics Belgium, our analyses indeed showed an increase in fertility between 2001 and 2008 in the Flemish region. The PTFR among the total female population increased from 1.52 in 2001 to 1.81 in 2008. A distinction between women of Belgian and of foreign nationality clearly showed a recovery of the PTFR among women of Belgian nationality, despite the higher overall PTFR among women of foreign nationality. The PTFR would have been only about one-tenth of a child lower if women of foreign nationality had been excluded.
Furthermore, our findings indicated that the share of births to native women decreased by around 4% in the period studied. Births to women who had acquired Belgian nationality and births to women of foreign nationality equally contributed to the increase. The results also showed, however, that births to women from non-Western countries (as indicated by their current or original nationality) accounted for much of this growth.
Second, we used an approach that enabled us to assess indirectly the impact of births to women of foreign origin by calculating virtual fertility rates that simulate the fertility rates that would have been observed if the women who acquired Belgian nationality had not given birth. Our analyses showed that fertility would also have recovered without the births to women who acquired Belgian nationality. Thus, to a large extent the recovery of period fertility in the Flemish region can be explained by increased fertility among native Belgian women, and in particular by increased fertility among those who were aged 30 or older.
averages for the entire region of Flanders. Given the fact that migrants are typically concentrated in cities, we may assume that there are differences between urban and rural areas in terms of the relative contributions of births to women of foreign origin. We were also unable to distinguish between members of different nationality groups, or between women of the first and second generations. Future research should examine differences in fertility rates between geographic areas, generations of migrants, and migrant origin groups.
References
Algemene Directie Statistiek en Economische Informatie (2004). Bevolking en huishoudens: Buitenlandse bevolking op 1.1.2004. Brussels: Algemene Directie Statistiek en Economische Informatie.
Algemene Directie Statistiek en Economische Informatie (2007). Bevolking en huishoudens: Buitenlandse bevolking op 1.1.2005. Brussels: Algemene Directie Statistiek en Economische Informatie.
Algemene Directie Statistiek en Economische Informatie (2008). Bevolking en huishoudens: Buitenlandse bevolking op 1.1.2006. Brussels: Algemene Directie Statistiek en Economische Informatie.
Algemene Directie Statistiek en Economische Informatie (2009). Bevolking en huishoudens: Totale en Belgische bevolking op 1.1.2007. Brussels: Algemene Directie Statistiek en Economische Informatie.
Belgische Federale Overheidsdiensten (2012). Hoe kunt u de Belgische nationaliteit
verkrijgen? [electronic resource]. Brussels: Belgische Federale
Overheidsdiensten. http://www.belgium.be/nl/familie/identiteit/nationaliteit/
Centrum voor gelijkheid van kansen en voor racismebestrijding (2009). Migratie: Jaarverslag 2008. Brussels: Centrum voor gelijkheid van kansen en voor racismebestrijding.
Centrum voor gelijkheid van kansen en voor racismebestrijding (2012). Migratie en migrantenpopulaties in België [electronic resource]. Brussels: Centrum voor
gelijkheid van kansen en voor racismebestrijding.
http://www.diversiteit.be/?action=publicatie_detail&id=157&thema=4
Coleman, D. (2006). Immigration and Ethnic Change in Low-Fertility Countries: A third Demographic Transition. Population and Development Review 32(3): 401-446. doi:10.1111/j.1728-4457.2006.00131.x
de Hart, B., and van Oers, R. (2001). European trends in nationality law. In: Bauböck, R., Ersbøll, E., Groenendijk, K., and Waldrauch, H. (eds.). Acquisition and Loss
of Nationality, Volume 1: Comparative Analyses. Amsterdam: Amsterdam
University Press: 317 – 357.
Foblets, M.-C., and Loones, S. (2006). Belgium. In: Bauböck, R., Ersbøll, E., Groenendijk, K., and Waldrauch, H. (eds.). Acquisition and Loss of Nationality,
Volume 2: Policies and Trends in 15 European Countries: Country Analyses.
FOD Economie K.M.O., Middenstand en Engergie (2012). Bevolking – Internationale migraties van Belgen en vreemdelingen (1948-2010) [electronic resource].
Brusselss: Belgian Federal Government. http://statbel.fgov.be/nl
/modules/publications/statistiques/bevolking/downloads/bevolking_-_internationale_migratie.jsp
FOD Economie K.M.O., Middenstand en Energie (2013a). Bevolking per nationaliteit, geslacht, leeftijdsgroepen op 1/1/2008 [electronic resource]. Brusselss: Belgian Federal Government. http://statbel.fgov.be/nl/modules/publications/statistiques/ bevolking/Bevolking_nat_geslacht_leeftijdsgroepen.jsp
FOD economie K.M.O., Middenstand en Energie (2013b). Bevolking – Loop van de bevolking (1988-2007) [electronic resource]. Brusselss: Belgian Federal Government. http://economie.fgov.be/nl/modules/publications/statistiques/ bevolking/Loop_bevolking_1988-2007.jsp
Fokkema, T., de Valk, H.A.G., de Beer, J., and van Duin, C. (2008). The Netherlands: Childbearing within the context of a “Poldermodel” society. Demographic
Research 19(21): 743–794. doi:10.4054/DemRes.2008.19.21
Goldstein, J.R., Sobotka, T., and Jasilioniene, A. (2009). The End of “Lowest-Low” Fertility? Population and Development Review 35(4): 663–699. doi:10.1111/ j.1728-4457.2009.00304.x
Héran, F., and Pison, G. (2007). Two children per woman in France in 2006: are immigrants to blame? Population & Societies March 2007 (432): 2–5.
http://www.ined.fr/fichier/t_publication/1242/publi_pdf2_pesa432.2.pdf
Kohler, H.-P., Billari, F.C., and Ortega, J.A. (2002). The Emergence of Lowest-Low Fertility in Europe During the 1990s. Population and Development Review 28(4): 641–680. doi:10.1111/j.1728-4457.2002.00641.x
Nationaal Instituut voor de Statistiek (2001). Bevolking en huishoudens: Buitenlandse bevolking op 1.1.2001. Brusselss: Nationaal Instituut voor de Statistiek.
Nationaal Instituut voor de Statistiek (2003a). Bevolking en huishoudens: Buitenlandse bevolking op 1.1.2002. Brusselss: Nationaal Instituut voor de Statistiek.
Nationaal Instituut voor de Statistiek (2003b). Bevolking en huishoudens: Buitenlandse bevolking op 1.1.2003. Brusselss: Nationaal Instituut voor de Statistiek.
Sobotka, T. (2008). Overview Chapter 7: The rising importance of migrants for childbearing in Europe. Demographic Research 19(9): 225–248. doi:10.4054/ DemRes.2008.19.9
Timmerman, C., Vanderwaeren, E., and Crul, M. (2003). The Second Generation in Belgium. International Migration Review 37(4): 1065–1090. doi:10.2307/ 30037786
Toulemon, L., Pailhé, A., and Rossier, C. (2008). France : High and stable fertility.
Demographic Research 19(16): 503–556. doi:10.4054/DemRes.2008.19.16