in the population sciences published by the Max Planck Institute for Demographic Research Doberaner Strasse 114 · D-18057 Rostock · GERMANY www.demographic-research.org
DEMOGRAPHIC RESEARCH
VOLUME 6, ARTICLE 10, PAGES 263-294
PUBLISHED 05 APRIL 2002
www.demographic-research.org/Volumes/Vol6/10/
DOI: 10.4054/DemRes.2002.6.10
The Impact of Individual and Aggregate
Unemployment on Fertility in Norway
Øystein Kravdal
1 Introduction 264
2 The Norwegian Setting 265
2.1 Trends in Fertility and Unemployment 265
2.2 Economic Consequences of Unemployment 268
3 Theoretical Considerations 269
3.1 The Demand for Children within a Union: Economic Arguments
269
3.2 Other Factors of Relevance 271
4 Methods and Data 272
4.1 Data 272
4.2 Statistical Approach 273
4.3 Regressors 274
4.4 Simulations 277
5 Results 278
5.1 Estimated Effects 278
5.2 Simulations 283
5.3 An Unresolved Puzzle 285
6 Conclusion 288
7 Acknowledgements 290
The Impact of Individual and Aggregate
Unemployment on Fertility in Norway
Øystein Kravdal 1
Abstract
Continuous-time hazard models are estimated from register-based birth, migration, education and unemployment histories for the complete Norwegian population, linked with aggregate data for municipalities. The analysis covers the period 1992-98. First-birth rates are slightly higher among women who had been unemployed twelve months before than among others, whereas higher-order birth rates are slightly lower. Although men’s unemployment has a more pronounced negative effect, according to paternity rate models, the overall conclusion is that unemployment in Norway has had a negligible impact on fertility through individual-level effects. Aggregate-level effects are more important. Higher-order birth rates are lower in municipalities where men’s or women’s unemployment is high than elsewhere. All in all, the peak unemployment level of 6% experienced in 1993 is found to be associated with a reduction of about 0.08 in total fertility. The results accord well with economic theories for first and higher-order births that are based on the assumption that women are still the primary caretakers.
1
1. Introduction
Unemployment may lead to a substantially reduced income, depending on the country’s compensation system, and may also trigger emotional reactions. Besides, it may create expectations, also among those who have not lost their job, about a relatively poor economic situation in the future. It is therefore not unlikely that the currently high unemployment rates in many European countries may be partly responsible for their below-replacement fertility.
Looking further back, fertility reached a low in many countries during the 1930s, when unemployment was high and more detrimental to the families’ well-being than it currently is. At that time, birth rates had already fallen sharply for some decades, but it may well be that the economically hard times strengthened the decline.
Some time-series analyses suggest a relationship between fertility and unemployment. For example, Macunovich (1996) reported a negative effect of young American women’s unemployment on their birth rate. In an earlier study, where no other variables were included, both men’s and women’s unemployment were found to reduce fertility, and more clearly so for higher-order birth rates than for first-birth rates (Macunovich and Easterlin 1988). In an American study of first births, Rindfuss et al. (1988) found an inhibiting effect of unemployment during recent decades as well as during the Depression, without distinguishing between men’s and women’s unemployment. A similar effect of men’s unemployment on first births in the post-war period was reported from Great Britain (De Cooman et al. 1987; Ermisch 1988), where unemployment otherwise was found to leave little imprint on fertility. On the basis of data back to the mid-19th century, Tzannatos and Symons (1989) concluded that unemployment to a large extent was responsible for the low British fertility during the Depression.
Few researchers have had access to individual data on unemployment and fertility, and the results from these studies are diverse. Rindfuss et al (1988) showed that women’s unemployment in the United States had no impact on first births, whereas men’s unemployment seemed to discourage early parenthood. A Belgian analysis (Impens 1989) suggested a negative effect of women’s unemployment, and a British study (Sullivan and Falkingham 1991) showed that men who had experienced unemployment during young adult years relatively often had become fathers by age 23. On the other hand, Kreyenfeld (2000) found women’s unemployment to increase first-birth rates among Germans with low education, and Hoem (2000) showed such a pattern more generally for Swedish first births.
force, because of, for example, school enrollment), relative to the corresponding proportion in 1985. This measure should pick up the effect of a local unemployment in excess of the very low level experienced in Sweden during most of the post-war period, combined with the expansion of school enrollment following in the wake of this. In accordance with these results, Santow and Bracher (2001) found first-birth rates in Sweden to be negatively related to national-level unemployment rates for women of the same age as the individuals under investigation.
In this study, register data for the complete Norwegian population are used to assess both individual- and aggregate-level effects of unemployment on first- and higher-order birth rates during 1992-98. A woman’s perspective is taken, in conformity with traditions. It is estimated how a woman’s birth rate is influenced by her own unemployment, that of other women in the community, and that of men. The latter will partly reflect that women in areas with many unemployed men more often than others have a partner who is unemployed, or no partner at all. Unfortunately, the data did not include partnership histories, with information on partner’s unemployment, only the formal marital status shortly before the period of analysis. However, to get at least an impression of the importance of partner’s unemployment, paternity rate models for men are estimated. All models include controls for a few factors that are thought to be strong determinants of unemployment as well as fertility. Simulation is used to find out how the changes in unemployment levels that have been experienced in Norway may have influenced total fertility, according to the model estimates.
2. The Norwegian Setting
2.1 Trends in Fertility and Unemployment
Total fertility is quite high in Norway by European standards. During the period 1995-99, a level above 1.8 was only attained at least one year in Ireland, a few Balkan countries and the Nordic countries, except Sweden, where very high levels had been experienced in the earlier part of the decade (see e.g. Sardon 2000).
Figure 1: Total fertility rate and percent of labour force who are unemployed in Norway 1972-99
Source: Statistics Norway
To illustrate the parity-specific trends, some simple hazard models are estimated for each parity transition separately. These models include age, duration since last previous birth (when relevant) and year, the latter with 1977 as a reference category. These net period effects are plotted in Figure 2. (According to Kravdal (2002), the pattern is not markedly different when first, second, third and fourth births are modelled simultaneously with a common unobserved factor included.)
Trajectories of second- and higher-order birth rates are very similar: A decline started about 1965, was brought to an end in the mid-1970s, and was succeeded by a constant level or slight upturn. A different pattern is seen for first-birth rates below age 30, which dropped from 1972 until the mid-1980s, with a somewhat less marked decline afterwards (whereas an increase appeared at higher ages; not shown). The 1990s have witnessed very moderate changes. A weak and smooth downward trend is seen for first-birth rates, whereas higher-order first-birth rates have been more stable, except for a minor dip for second and third births around 1993.
1 1.2 1.4 1.6 1.82 2.2 2.4
1972 1975 1978 1981 1984 1987 1990 1993 1996 1999
Year TFR
0 2 4 6 8
Total fertility rate
Unemployment (percent of labour force who are unemployed)
Figure 2: Standardized period effects in Norwegian birth rates 1960-97
Generally, there has been little unemployment in Norway compared to most other European countries (and the timing of the ups and downs has often been different, not least because of the country’s oil-dependent economy; see e.g. Rødseth 1994). For example, the level of 5% in 1995, which is high for Norway, was exceeded by the other Nordic countries: Denmark and Sweden had levels of 7% and 9%, respectively, that year, whereas Finland reached as high as 16% (while nevertheless displaying a total fertility of 1.8). The EU average was 11%, with some member countries much higher. In comparison, the unemployment rates were only 4-5% in Japan and the United States (see e.g. OECD 1999).
The development of Norwegian unemployment over the last three decades is shown in Figure 1. The rates are defined as the number of fully unemployed divided by the number of people in the labour force. Both numerator and denominator are based on the quarterly Labour Force Surveys, where people are asked about their employment status, and are for the age group 16-74.
0 0.5 1 1.5 2 2.5 3 3.5 4
1960 1965 1970 1975 1980 1985 1990 1995
Year of exposure
Rate relative to 1977
A slight increase up to 3.4% and a subsequent return to the post-war normal of about 2% was experienced in the first half of the 1980s, whereas the 1990s saw a more pronounced rise and fall. The rate reached 6%, and subsequently dropped to 3%.
2.2 Economic Consequences of Unemployment
This study is based on unemployment data from the Labour Directorate. People who register at the local Employment Offices as seeking work, and who have no labour income, are reckoned as ‘registered fully unemployed’ in statistics from the Labour Directorate. (See below for a brief description of the differences in unemployment levels between this statistics and that based on the Labour Force Surveys.) In order to be considered as seeking employment, one must be willing to take any work that is offered or take part in employment training courses. One must also report as unemployed every fortnight. This excludes the possibility for educational activities that are scheduled for normal working hours (but very short courses are permitted).
The unemployed are entitled to a compensation if they have had a labour income of at least about 45000 NOK the previous year (or as a three-year average), or if they have been in compulsory military service (see e.g. Kjønstad 1998). (1 NOK is about 0.13 Euro.)
This compensation is about 60% of the income earned the previous year. During the study period, compensation could be received for at least 1.5 years. In 1996, the compensation period was increased to 3 years for people with previous income above about 90000 NOK.
Regulations about compensation for spells of unemployment beyond these limits have changed markedly during the 1990s. Up to May 1991, no support was provided for the next 0.5 year, after which a new compensation period could start. This blocking of transfers was gradually weakened, and after 1996, a second 3-year compensation period could be started immediately (with a lower amount of support, of course, due to the lower income in the past). These changes are not important for many people, because few are unemployed more than one year. (Only about 1/3 of the unemployed in the 1990s had been unemployed for 6 months or more according to Table 4.)
3. Theoretical Considerations
3.1 The Demand for Children within a Union: Economic Arguments
A person who is unemployed, or who observes a high unemployment rate in the neighbourhood, may consider the risk of experiencing unemployment in the future as relatively high. Such an outcome would lead to a substantially lower income than the person has been used to, and for many also a lower level than the average in society. Whereas a persistently or normally low income not necessarily produces a low fertility, because material aspirations and child ‘quality’ requirement are correspondingly weakened, a low relative income is more likely to do so. Thus, unemployment at the individual as well as aggregate level may strengthen people’s doubts about whether to have another child at all, with the result that fertility is reduced.
One should expect such effects of both men’s and women’s unemployment, although perhaps weakest for the latter, because men’s contribution to the family income still is the dominant one.
Moreover, even in the absence of such an effect, fertility rates may be low during unemployment because people decide not to have the child yet, but wait for a higher family income (see the consumption smoothing argument suggested by Happel et al. 1984). Under the assumption that men are the main breadwinners, one might expect particularly strong effects of the male partner’s unemployment.
On the other hand, it might also be economically advantageous for a couple to have their child while one of them is unemployed. More precisely, they may try to synchronize the period with very intensive child care needs (i.e. the first few years after paid maternity or paternity leave, which was 32-48 weeks with full compensation during the study period) with a period when one of the parents would not work anyway because of unemployment.
The last two arguments, which are about timing or spacing (i.e. a couple’s decision about whether to have a child ‘now or later’), will probably be particularly important for first births. The first-mentioned argument, however, is of less relevance at that stage, as very few couples want to remain childless (see discussion in Kravdal (1994) and references therein). By contrast, higher-order birth rates will reflect both spacing and quantum concerns. For example, it might be better, in some situations, to have a child immediately than to wait, but the higher-order birth rates might nevertheless be low at that time because the parents hesitate to have another child at all.
subsequent period), and therefore try to conceive soon to ‘make use of’ the unemployment period. Assuming once again a traditional gender system, such effects should be seen for women’s unemployment in particular.
However, it is not obvious that the unemployed have such expectations. A spell of unemployment rarely lasts another year (according to statistics that may not be widely known), and although the currently unemployed may realize that they have a higher chance of a later spell of unemployment than others, they do not necessarily have any ideas about its timing.
It is perhaps more likely that the currently unemployed expect to quite soon be offered a job, but a poorly paid one, partly because recent unemployment experience may be taken by the employer as a signal of low productivity. In that case, the opportunity costs would be relatively low compared to those perhaps expected at a higher age, when wages may have reached a higher level. This would tend to make rapid childbearing favourable. However, there is also a punishment for being too rapid, because the woman would need some time in a job to build up the rights to a higher maternity benefit.
A similar opportunity cost argument could be relevant at the aggregate level (especially in countries where wages to a larger extent than in Norway reflect local labour market conditions): High local unemployment rates may depress wages generally, with women’s unemployment perhaps being particularly important for women’s wages. If women currently have low earnings because of this, and they assume it to be a temporary situation (although not ended within a year), they would have a good reason to conceive as soon as possible.
To make this even more complex, the opposite effect of women’s own unemployment on birth timing is also plausible. It has been tacitly assumed above that the timing is adapted to given employment prospects (as they are perceived by the persons involved). This may well be too simplistic. The women may believe that it will be particularly difficult to get a job again, and especially a well paid one, if they not only have lost some of their experience and value in the labour market because of unemployment, but perhaps also have added a maternity leave period to this, in addition to having responsibility for a young child.
In conclusion, unemployment is likely to push fertility down, and probably more so when men are unemployed than when women are unemployed. However, one cannot rule out a stimulating influence, especially of women’s unemployment and for first births.
unemployment compensation depends on the number of children (Kjønstad 1998), but the differences are so small that they cannot possibly be of any importance.
The length of the spell of unemployment may also have an impact. For example, those who have already been unemployed for many months may be more conscious than the short-term unemployed about the possibility that they may experience unemployment in the future, and they will tend to have the poorest economy currently. Moreover, if women in long-term unemployment consider the chance of remaining unemployed yet another year as relatively low, the high first-birth rates suggested above are particularly unlikely to show up. However, the opposite view about the near future is perhaps just as plausible in this situation.
3.2 Other Factors of Relevance
Also other causal pathways may be important. Above all, the couple’s preferences, given income and childbearing costs, is a possible intervening factor. People who have a job, which perhaps makes them feel meaningful and also provides various other socio-psychological benefits, may well differ from the unemployed, one way or the other, in the value they place on childbearing compared to other sources of satisfaction.
Besides, partnership is a crucial factor. To facilitate the discussion, let us distinguish between three groups of women: The first are those who live in some sort of ‘stable’ relationship where both partners can count on each other for some time ahead, such as marriages and many consensual unions. This group has a relatively high fertility, although the direction of causality is by no means clear. (When people who, at a certain age, live in a marriage-like relationship have the highest subsequent birth rates, it partly reflects the confounding influence of childbearing decisions taken some time before.) The effects of unemployment discussed above are meant to be relevant primarily for these ‘stable’ couples, whereas unemployment is likely to be implicated in a different way for others.
The second group consists of those in a dating relationship involving sexual activity, or in a consensual union with a relatively weak mutual commitment. Among these women, birth rates are lower, pregnancies probably more often unintended, and fertility desires are likely to reflect to a large extent their own unemployment and its short-term consequences, rather than their partners’ situation. This is because these women would tend to face great uncertainty: The current partner may not be around a few years later, and if they have another partner at that time, they would not know which economic contribution to expect from him.
Because most births, even in Norway, still occur in the ‘stable’ relationships referred to above (e.g. Kravdal 1997), the overall differences in total fertility between the unemployed and employed must primarily be due to differences in the proportion who are in such relationships and the association between unemployment and fertility among these couples. The latter has already been dealt with, whereas a short discussion of unemployment effects on union formation and stability remains (leaving aside, for simplicity, the possibility that effects operate through planned births).
According to the view that specialization between spouses is a major source of utility from a union (in the long run), a low current or expected income for a woman, which is signalled by her own unemployment and that of other women, would stimulate rather than undermine union formation and stability. The opposite would be the case for men: A woman living in a municipality with many unemployed men would relatively often not live in a marriage-like relationship. In other words, fertility would be low partly because of a lack of men worthy of the strong commitment often considered a prerequisite for procreation. This is an additional reason why one would expect to see sharper negative effects of unemployment in models for men than in models for women. Moreover, there are certain short-term costs associated with union formation itself, especially a wedding (Kravdal 1999), that may inhibit entry into a union in economically difficult times for men or women.
The ‘pooling-of-resources’ model (Oppenheimer 1994), which claims that also high earnings for women enhance the utility of a union, would give a slightly different picture: The effect of women’s unemployment would be more equal to that of men.
In spite of the causality problem mentioned above, one might have wanted to enter relationship status as a continuously updated variable into the models, to get an impression of its importance as a mediating and conditional factor. However, the data only include the formal marital status in 1990, which is not sufficiently informative to be taken into account.
4. Methods and Data
4.1 Data
The data include all women and men born 1950-1982 who have lived in Norway for some time between January 1992 and December 1998. Thus, men and women of age 16-41 can be studied throughout the observation period.
histories include date of birth for all children born alive to (or fathered by) the women and men in the 1950-1982 cohorts. The migration histories allow identification of the municipality in which a person has lived any month of the study period. Data on unemployment levels and population sizes of these municipalities have been taken from the Municipality Data Base operated by the Norwegian Social Science Data Services.
Educational histories, which include the highest educational level as of 1 October every year and the enrollment status at that time, have been taken from the Annual Educational Statistics Files produced by Statistics Norway.
Data on spells of registered full unemployment from January 1991 to December 1998 have been taken from the register on job searchers (the so-called SOFA register) owned by the Labour Directorate. It is the lack of older data in this register that has dictated the choice of study period.
4.2 Statistical Approach
As explained above, there may be substantial differences in unemployment effects between first and higher-order births. This study is therefore based on continuous-time hazard models estimated separately for childless women and mothers. In the former, individuals are followed from age 16 or January 1992, whichever is the last, and censored at time of death or emigration, age 41, or the end of 1998, with the exception that they are excluded from the analysis during periods when they lived in another country. (Censoring at age 30 gave almost the same results.) Similar models are estimated for higher-order births, with parity as a covariate.
All covariates are categorical, and the hazard is assumed to be constant within 2-year age intervals and duration intervals of 1.5 - 3 2-years. Introductory checks revealed that this is a sufficient control for age and duration.
The models are estimated in the Amfit Poisson regression module in the Epicure software (Preston et al. 1993). Poisson regression is the same as hazard regression when the rate is assumed to be piecewise constant and the covariates are categorical, as here (Agresti 1990). A self-made computer program was used to compute the multi-dimensional tables of births and exposures that were fed into Amfit.
All unemployment and education variables, which are most likely to be influenced by an impending birth, are lagged. A twelve-month lag is used, to reflect that many childbearing decisions are taken well before conception, but a nine-month lag gave very similar results.
areas where many men are unemployed are less likely to live in a ‘stable’ relationship (according to the assumptions above), and those who do are likely to have a different (and supposedly lower) fertility because their partner more often is unemployed. To get an impression of the latter individual-level contribution, models are also estimated for men. In these models, the effects of individual unemployment reflect differences in union formation and dissolution between unemployed and employed, as well as the importance of male partner’s unemployment for fertility among couples.
The woman's chance of unemployment may well be correlated with that of her partner. This means that the individual effect of woman’s unemployment according to a model such as that described above (reflecting to a large extent, but not exclusively, the impact of the female partner’s unemployment on a couple’s fertility), will capture also part of the effect of the male partner’s unemployment. Given the signs of the effects that appear in the tables below, and a positive correlation, the true effect of a woman’s own unemployment will be less negative or more positive than the estimated effect. Similarly, the effect of a man’s own unemployment, according to a similar paternity rate model, will capture part of the effect of the woman’s unemployment. The direction of this bias is less clear.
Individuals who live in the same municipality may share some unobserved characteristics, which means that standard assumptions in regression analysis about independent observations are not reasonable. So-called multilevel models have been developed to handle these problems, and are now quite frequently applied in demographic research. Such modelling generally yields larger standard errors, but the differences are often small (see e.g. Kravdal 2001a). In this large-scale study, all interesting effect estimates would probably be strongly significant anyway.
4.3 Regressors
The following are the main possible activities for these relatively young people:
enrolled in school and
- registered as unemployed at the Employment Offices (with or without right to compensation)
- applying for jobs but not registered as unemployed - employed
not enrolled and
- registered as unemployed at the Employment Offices (with or without right to compensation)
- applying for jobs but not registered as unemployed - employed
- homemaker - military service
Relatively few of the persons enrolled in school are registered as unemployed at the Employment Offices. To be registered as unemployed, they need to be active job searchers, which is usually not compatible with studies (see above). Besides, many students will not be eligible for compensation, because they have also been enrolled the last few months and therefore have had a low income, and thus have little to win by being registered. Finally, a large group will simply not be interested in work, because they are involved in demanding full-time studies.
The data do not allow a detailed categorization of activities. It is merely distinguished between unemployed and not unemployed, and between enrolled and not enrolled. The main interest lies in the response to unemployment among those who are not enrolled, who are the largest group, and who would otherwise largely have been employed, if not homemakers (at parities above one, and generally more relevant for women than men) or in military service (only relevant for the youngest men).
The difference in fertility between the unemployed and such a combined category of employed and a relatively small number of homemakers, plus some others, is not necessarily the same as that between the unemployed and the employed, which is in focus of the study. The direction of this bias is far from clear. One may well expect homemakers to have a relatively high fertility, as some of them may simply not consider employment an alternative, and therefore would have low childbearing costs. In these days, however, when mothers’ employment is widely accepted, it is more likely that women are homemakers because of inadequate access to high-quality child care, and otherwise would have preferred to work. If they expect such problems also after subsequent births, they will face high opportunity costs and thus display low fertility (see Kravdal 1992).
may be different from those when a substantial cyclical component is added (Røed 2001). There may also be differences between countries. In this study, only the determinants in Norway during the 1990s are of interest. According to Røed and Zhang (2000), Nielsen et al. (2000) and Nordberg (2000), education was strongly linked with unemployment both during the recession in the early 1990s and during the later recovery period. Educational level is therefore included as a control variable. The quite few individuals whose educational level is unknown are excluded from the analysis, but the results would not have been markedly different if they instead were included as a separate category.
The studies referred above conclude that there also is considerable variation in unemployment at a given the educational level. Above all, the unemployed tend to have short work experience, poor health, or low wages, or be immigrants from poor countries. Unfortunately, such variables are not available in the data.
School enrollment is not measured as accurately as unemployment. It has been assumed that people who are registered as enrolled 1 October a given year went to school all months from July that year through June the next. (Schools are, of course, usually closed mid-summer, but most people know in July whether they will go to school in September and later, and behave accordingly.). This means that some young adults who take short courses around 1 October are wrongly classified as enrolled also during the remaining parts of the school year. Conversely, educational activities finished before 1 October or started afterwards will be completely neglected. As explained below, this misclassification of enrollment cannot be critical.
Aggregate unemployment is assumed to be constant during a calendar year. It is defined as the weighted average of the unemployment levels in all municipalities the woman lived in during this calendar year, with weights reflecting duration of residence in each municipality. The unemployment level in a municipality is defined as the total number of men or women aged 16-39 who are registered (in the Employment Offices) as fully unemployed, as an average over the calendar year, divided by the total population in this age group. No distinction could be made between short-term and long-term unemployment on the basis of these data from the Social Science Data Services.
The use of aggregate data for the age group 16-39 is not an obvious choice. Fortunately, very similar results appeared when unemployment rates for ages 16-24 or 25-39 were included as alternatives.
The unemployment level varies considerably across the country, for different reasons. For example, it is usually thought that communities where many people work in the public sector or in other industries that are not strongly challenged by international competition, have low unemployment rates. A varied labour market may also inhibit unemployment. In this study, an East / South+West / Central+North indicator is included as a control variable in combination with occupational structure (according to a classification developed by Statistics Norway 1985). One might perhaps expect also a central/peripheral dichotomy to be important as a control variable, but that turned out not to be the case.
To remove the influence of unobserved factors with a persistent influence on aggregate unemployment and fertility, one might have included in the models a measure of the level relative to that in a basis year, rather than the absolute level. Hoem (2000) based most of her analysis on such a ratio for the (almost) complementary variable, women’s employment, and found (without inclusion of other aggregate variables) that it gave slightly weaker effects. This alternative specification has not been tried in the present study, but it would probably be less important, as a few aggregate-level control variables have been included. Moreover, even if relative rather than absolute levels were considered, the problem would not be fully solved. In principle, the differences in unemployment over time in a given municipality might stem from factors other than those with a more general influence, and these factors might also be of importance for fertility.
Finally, the estimated aggregate effect may reflect not only the impact that an elevated general level of unemployment would have on fertility, but that, for example, some people who plan to soon have a child move to an area with low unemployment. A simultaneous modelling of fertility and migration, which would have been helpful in this respect, has not been attempted in this study.
4.4 Simulations
woman within the interval if a random number with a uniform distribution over [0,1] is less than the calculated probability. Birth probabilities beyond parity four are assumed to be 0. The average number of births in this sample is the simulated total fertility.
A ‘reference model’ for women is first estimated. It includes only age, duration since last previous birth (when relevant), and parity (when relevant). The corresponding ‘reference simulation’ gives a total fertility of 1.85.
The next step, reported below, is to find out how total fertility would be for unemployed and not unemployed women who are subject to these ‘reference’ rates for first- and higher-order births except for a proportional change in the rates corresponding to the estimated net effects of own or other people’s unemployment. An average fertility is calculated by taking the proportion of women in unemployment into account.
Such a simulation based on the static models that are estimated illustrates the differences in total fertility between areas with different unemployment levels. However, the simulation results should be considered only as indications of how corresponding changes in unemployment from one year to another would influence fertility. For example, a general rise in unemployment in a country may trigger political initiatives at the national level that will have an impact on birth rates, and that have no counterpart at the local level that might explain the observed cross-sectional intra-national differences.
5. Results
5.1 Estimated Effects
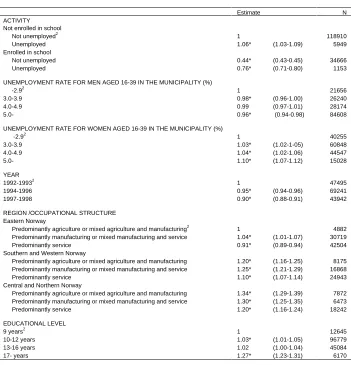
Table 1: Effect estimates (with 95% confidence interval) in continuous-time hazard models for first births among women, based on Norwegian register data for 1992-1998.1
Estimate N
ACTIVITY Not enrolled in school
Not unemployed2 1 118910
Unemployed 1.06* (1.03-1.09) 5949
Enrolled in school
Not unemployed 0.44* (0.43-0.45) 34666
Unemployed 0.76* (0.71-0.80) 1153
UNEMPLOYMENT RATE FOR MEN AGED 16-39 IN THE MUNICIPALITY (%) -2.92
1 21656
3.0-3.9 0.98* (0.96-1.00) 26240
4.0-4.9 0.99 (0.97-1.01) 28174
5.0- 0.96* (0.94-0.98) 84608
UNEMPLOYMENT RATE FOR WOMEN AGED 16-39 IN THE MUNICIPALITY (%) -2.92
1 40255
3.0-3.9 1.03* (1.02-1-05) 60848
4.0-4.9 1.04* (1.02-1.06) 44547
5.0- 1.10* (1.07-1.12) 15028
YEAR
1992-19932 1 47495
1994-1996 0.95* (0.94-0.96) 69241
1997-1998 0.90* (0.88-0.91) 43942
REGION /OCCUPATIONAL STRUCTURE Eastern Norway
Predominantly agriculture or mixed agriculture and manufacturing2 1 4882 Predominantly manufacturing or mixed manufacturing and service 1.04* (1.01-1.07) 30719 Predominantly service 0.91* (0.89-0.94) 42504 Southern and Western Norway
Predominantly agriculture or mixed agriculture and manufacturing 1.20* (1.16-1.25) 8175 Predominantly manufacturing or mixed manufacturing and service 1.25* (1.21-1.29) 16868 Predominantly service 1.10* (1.07-1.14) 24943 Central and Northern Norway
Predominantly agriculture or mixed agriculture and manufacturing 1.34* (1.29-1.39) 7872 Predominantly manufacturing or mixed manufacturing and service 1.30* (1.25-1.35) 6473 Predominantly service 1.20* (1.16-1.24) 18242
EDUCATIONAL LEVEL
9 years2 1 12645
10-12 years 1.03* (1.01-1.05) 96779
13-16 years 1.02 (1.00-1.04) 45084
17- years 1.27* (1.23-1.31) 6170
1
Also age (14 categories) is included. The effects are as usually seen: The birth rate first increases sharply with age and then decreases to very low levels as the 40s are approached.
2
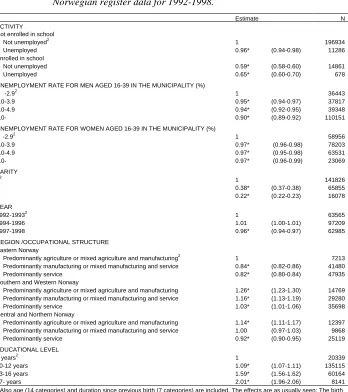
Table 2: Effect estimates (with 95% confidence interval) in continuous-time hazard models for higher-order births among women, based on Norwegian register data for 1992-1998.1
Estimate N
ACTIVITY Not enrolled in school
Not unemployed2 1 196934
Unemployed 0.96* (0.94-0.98) 11286
Enrolled in school
Not unemployed 0.59* (0.58-0.60) 14861
Unemployed 0.65* (0.60-0.70) 678
UNEMPLOYMENT RATE FOR MEN AGED 16-39 IN THE MUNICIPALITY (%)
-2.92 1 36443
3.0-3.9 0.95* (0.94-0.97) 37817
4.0-4.9 0.94* (0.92-0.95) 39348
5.0- 0.90* (0.89-0.92) 110151
UNEMPLOYMENT RATE FOR WOMEN AGED 16-39 IN THE MUNICIPALITY (%) -2.92
1 58956
3.0-3.9 0.97* (0.96-0.98) 78203
4.0-4.9 0.97* (0.95-0.98) 63531
5.0- 0.97* (0.96-0.99) 23069
PARITY 12
1 141826
2 0.38* (0.37-0.38) 65855
3 0.22* (0.22-0.23) 16078
YEAR
1992-19932 1 63565
1994-1996 1.01 (1.00-1.01) 97209
1997-1998 0.96* (0.94-0.97) 62985
REGION /OCCUPATIONAL STRUCTURE Eastern Norway
Predominantly agriculture or mixed agriculture and manufacturing2 1 7213 Predominantly manufacturing or mixed manufacturing and service 0.84* (0.82-0.86) 41480
Predominantly service 0.82* (0.80-0.84) 47935
Southern and Western Norway
Predominantly agriculture or mixed agriculture and manufacturing 1.26* (1.23-1.30) 14769 Predominantly manufacturing or mixed manufacturing and service 1.16* (1.13-1.19) 29280
Predominantly service 1.03* (1.01-1.06) 35698
Central and Northern Norway
Predominantly agriculture or mixed agriculture and manufacturing 1.14* (1.11-1.17) 12397 Predominantly manufacturing or mixed manufacturing and service 1.00 (0.97-1.03) 9868
Predominantly service 0.92* (0.90-0.95) 25119
EDUCATIONAL LEVEL
9 years2 1 20339
10-12 years 1.09* (1.07-1.11) 135115
13-16 years 1.59* (1.56-1.62) 60164
17- years 2.01* (1.96-2.06) 8141
1
Also age (14 categories) and duration since previous birth (7 categories) are included. The effects are as usually seen: The birth rate first increases sharply with duration for about three years and then declines more slowly. It also increases moderately with age up to about 28 years and then falls to very low levels as the 40s are approached.
2
As shown in Table 1, women who are unemployed display higher first-birth rates twelve months later than do other women. This accords with the idea that they expect unemployment to stick with them for some time (but not many years), or expect to be offered relatively low wages for a while, and try to exploit this opportunity to incur low childbearing costs. The difference is 6%, when comparing among those who are not enrolled in school. On the other hand, higher-order birth rates are reduced by women’s unemployment, but only by 4% (Table 2). Such small differences might perhaps be due entirely to unobserved differences between women who are unemployed and those who are not, as further discussed below.
As explained above, enrollment status is not fully known. Fortunately, even if the models are estimated without any consideration of enrollment, the main conclusions are not changed. The same effects appear for higher-order births (and in paternity-rate models), but the impact of unemployment on first births becomes twice as strong.
Also the effects of aggregate unemployment fit reasonably well with the theoretical arguments above. Women’s first-birth rates are weakly reduced by men’s unemployment and raised by women’s unemployment, whereas higher-order birth rates are negatively influenced by both men’s and women’s aggregate unemployment. The latter effect is sharpest for men’s unemployment.
Only four categories are used for aggregate unemployment, with the fourth covering all levels above 5%. Other models revealed that there were no substantial differences in fertility within this category.
For any municipality and year, there is, of course, a positive correlation between men’s and women’s unemployment rates, but the correlation factor is only about 0.65 (not shown), and with such a large number of observations (about 400 regional units and 7 years) multicollinearity does apparently not pose a problem. When only one of the variables was included, effect estimates were only slightly different, in the expected direction. Besides, the estimates were only marginally sensitive to alternative specifications of other regressors.
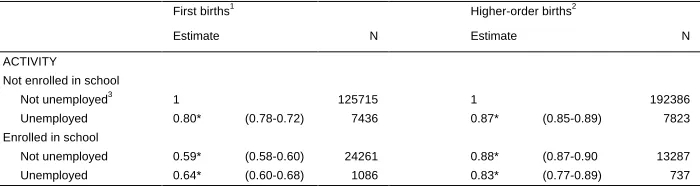
As explained above, a woman who lives in areas where men’s unemployment is high has a fertility different from others partly because she has an unemployed partner, if any. The estimates from a paternity model give an impression of this contribution. As opposed to the stimulating effect of women’s unemployment on first-birth rates, the effect of men’s unemployment at the individual level is negative and quite large (Table 3). Also men’s higher-order birth rates are clearly reduced (by 13%) by men’s individual unemployment. The effect is markedly stronger than the corresponding effect for women. This also fits well with the theoretical arguments.
Table 3: Effect estimates (with 95% confidence interval) in continuous-time hazard models for parity transitions among men, based on Norwegian register data for 1992-1998.
First births1
Higher-order births2
Estimate N Estimate N
ACTIVITY Not enrolled in school
Not unemployed3 1 125715 1 192386
Unemployed 0.80* (0.78-0.72) 7436 0.87* (0.85-0.89) 7823 Enrolled in school
Not unemployed 0.59* (0.58-0.60) 24261 0.88* (0.87-0.90 13287 Unemployed 0.64* (0.60-0.68) 1086 0.83* (0.77-0.89) 737
1
Also age (14 categories), educational level (4 categories), year (3 categories), local unemployment level (4+4 categories), and region of residence (East/ South+West / Central+North combined with 3 categories for occupational structure) are included.
2
Also age (14 categories), duration since previous birth (7 categories), parity (1,2,3), educational level (4 categories), year (3 categories), local unemployment level (4+4 categories), and region of residence (East/ South+West / Central+North combined with 3 categories for occupational structure) are included.
3
Arbitrarily chosen baseline category * significant at the 0.05 level. N Number of births
Table 4: Effect estimates (with 95% confidence interval) in continuous-time hazard models for parity transitions among women and men who are not enrolled in school, based on Norwegian register data for 1992-1998.
MEN WOMEN
First births1 Higher-order births2 First births1 Higher-order births2 Estimate N Estimate N Estimate N Estimate N ACTIVITY
Not unemployed 1 125715 1 192386 1 118910 1 196934 Unemployed
< 6 months 0.85* (0.82-0.87) 6130 0.87* (0.85-0.89) 6144 1.10* (1.06-1.13) 5121 0.95* (0.93-0.97) 8273
6-12 months 0.67* (0.63-0.72) 983 0.87* (0.82-0.92) 1237 0.92* (0.84-1.00) 644 0.99 (0.95-1.03) 2201
> 12 months 0.57* (0.52-0.64) 323 0.82* (0.75-0.90) 472 0.84* (0.72-0.97) 184 1.00 (0.94-1.07) 812 1
Also local unemployment level (4+4 categories), age (14 categories), educational level (4 categories), year (3 categories), and region of residence (East/ South+West / Central+North combined with 3 categories for occupational structure) are included. Effects are not shown for those who are enrolled in school.
2
Also local unemployment level (4+4 categories), age (14 categories), duration since previous birth (7 categories), parity (1,2,3), educational level (4 categories), year (3 categories) and region of residence (East/ South+West / Central+North combined with 3 categories for occupational structure) are included. Effects are not shown for those who are enrolled in school.
3
Arbitrarily chosen baseline category * significant at the 0.05 level. N Number of births
5.2 Simulations
However, there is also an aggregate effect. All women’s first-birth rates will be raised by a factor of 1.04, and their higher-order birth rates by a factor of 0.97, if aggregate unemployment is increased from 2% to 4%. If there is a simultaneous increase in men’s unemployment, from 2% to 6%, there will be a change in fertility rates of 0% for first births (because the 1.04 factor associated with 4% unemployment for women is combined with an estimate of 0.96 associated with 6% unemployment for men) and a change of 13% for higher-order births (the corresponding estimates being 0.97 and 0.90). This corresponds to a reduction of 0.082 in total fertility.
Part of this reduction of 0.082 is due to the larger proportion of women who experience a lower fertility because they do not have a partner, or who have a partner who is unemployed. According to the paternity rate model estimates, men who are unemployed will have a total fertility 0.264 lower than others (of which 0.181 is due to the lower first-birth rates). If the size of this group increases by 4%, the total impact stemming from the individual-level effects will be 0.04*0.264, which is about 0.01. This reflects both that unemployed men probably are under-represented in ‘stable’ unions, and that fertility in these unions is low when the male partner is unemployed.
Obviously, the aggregate contribution is the dominant one. This conclusion hinges, of course, on the assumption that the estimate of the aggregate effect is no more biased than the individual effect by the lack of control for potential confounders that are not available in the data.
Such results also nicely illustrate the need to incorporate macro-level variables in the models. If aggregate-level variables had been left out, the estimated individual-level effects would have captured part of the aggregate effects, but only a very small one (not shown).
1990 national population data. When birth rates were kept at the reference level for two years, then abruptly reduced to that associated with 4-6% unemployment, and one year afterwards turned back to the reference level, period total fertility was 0.11 lower in the third year than it would have been without this ‘shock’. On the other hand, it was 0.015 higher the fourth year, 0.004 higher the fifth year, and only slightly higher the next ten years.
The length of individual unemployment has not been considered when assessing the effects on total fertility above. Of course, when unemployment at a given time of the year increases from 2% to 6%, it could be the result of a higher rate of entrance into unemployment, a longer duration, or a combination. To illustrate the importance of this distinction, assume first that there is a situation where 2% of the men are unemployed 0-5 months (i.e., that 2% of their exposure time is in the state ‘0-0-5 months of unemployment’). In a second situation, 6% of the men are in this category. That means that average total fertility becomes 0.008 lower (according to simulations based on estimates in Table 4). Going to the extreme, a third situation could be that 2% are in the 0-5 category, 2% in the 6-12 category and 2% in the 13+ category (i.e. an increase in cross-section measure of unemployment exclusively due to longer durations). That would lead to a fertility reduction of 0.016 compared to the first situation. Of course, the figure 0.04*0.264=0.011 referred above lies between these two figures. Effects of women’s individual unemployment are small anyway. Thus, regardless of whether the increase in unemployment stems from higher entry rates or longer durations, it is obvious that the individual-level effects are small.
5.3 An Unresolved Puzzle
Ending the investigation here would be convenient, as the estimates make good sense in light of the theoretical discussion. However, one might also like to see whether the idea of parity-independent unemployment effects for people who have already become fathers or mothers is supported by the data. Unfortunately, the results of this check are somewhat puzzling, and leave the researcher with quite a punishment for curiosity and thoroughness.
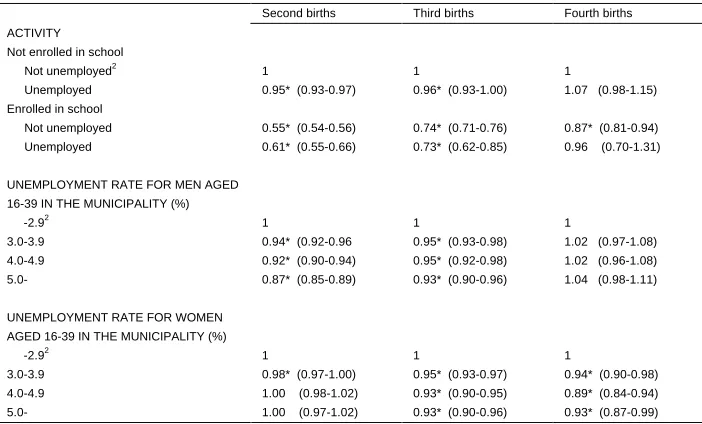
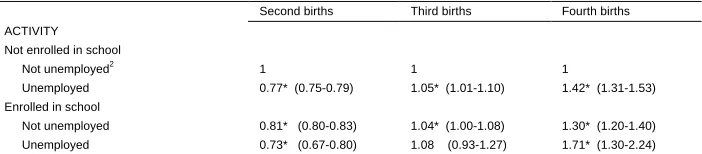
Also aggregate effects change across parity. In particular, fourth births are less markedly influenced by a combination of men’s and women’s unemployment than are the lower-order births.
Table 5: Effect estimates (with 95% confidence interval) in continuous-time hazard models for parity transitions among women, based on Norwegian register data for 1992-1998.1
Second births Third births Fourth births ACTIVITY
Not enrolled in school
Not unemployed2 1 1 1
Unemployed 0.95* (0.93-0.97) 0.96* (0.93-1.00) 1.07 (0.98-1.15) Enrolled in school
Not unemployed 0.55* (0.54-0.56) 0.74* (0.71-0.76) 0.87* (0.81-0.94) Unemployed 0.61* (0.55-0.66) 0.73* (0.62-0.85) 0.96 (0.70-1.31)
UNEMPLOYMENT RATE FOR MEN AGED 16-39 IN THE MUNICIPALITY (%)
-2.92 1 1 1
3.0-3.9 0.94* (0.92-0.96 0.95* (0.93-0.98) 1.02 (0.97-1.08) 4.0-4.9 0.92* (0.90-0.94) 0.95* (0.92-0.98) 1.02 (0.96-1.08) 5.0- 0.87* (0.85-0.89) 0.93* (0.90-0.96) 1.04 (0.98-1.11)
UNEMPLOYMENT RATE FOR WOMEN AGED 16-39 IN THE MUNICIPALITY (%)
-2.92 1 1 1
3.0-3.9 0.98* (0.97-1.00) 0.95* (0.93-0.97) 0.94* (0.90-0.98) 4.0-4.9 1.00 (0.98-1.02) 0.93* (0.90-0.95) 0.89* (0.84-0.94) 5.0- 1.00 (0.97-1.02) 0.93* (0.90-0.96) 0.93* (0.87-0.99)
1
Also age (14 categories), duration since previous birth (7 categories), educational level (4 categories), year (3 categories) and region of residence (East/ South+West / Central+North combined with 3 categories for occupational structure) are included.
2
Table 6: Effect estimates (with 95% confidence interval) in continuous-time hazard models for parity transitions among men, based on Norwegian register data for 1992-1998.1
Second births Third births Fourth births ACTIVITY
Not enrolled in school
Not unemployed2 1 1 1
Unemployed 0.77* (0.75-0.79) 1.05* (1.01-1.10) 1.42* (1.31-1.53) Enrolled in school
Not unemployed 0.81* (0.80-0.83) 1.04* (1.00-1.08) 1.30* (1.20-1.40) Unemployed 0.73* (0.67-0.80) 1.08 (0.93-1.27) 1.71* (1.30-2.24)
1
Also age (14 categories), duration since previous birth (7 categories), educational level (4 categories), year (3 categories), local unemployment level (4+4 categories), and region of residence (East/ South+West / Central+North) combined with 3 categories for occupational structure) are included.
2
Arbitrarily chosen baseline category * significant at the 0.05 level.
Various kinds of selection may lie behind these changes in individual effects. One possibility is that there is a subgroup in the Norwegian population who have generally high fertility and also respond less strongly than others to unemployment (e.g. because of a tighter family network to rely on), so that even the unemployed have higher birth rates than experienced by the majority. Immigrants from high-fertility countries might possibly be such a minority group. If unemployment in the majority group reduces fertility sharply, and if current unemployment is linked with past unemployment, few of the unemployed at high parity levels will be from the majority group, and relatively many will come from the minority group. Average fertility among the unemployed may therefore be higher than among the employed, who will be more strongly dominated by the majority group (although with more representation from minority groups than at lower parities).
If unemployment effects are indeed confounded by, for example, ethnicity (or citizenship or country of birth) at high parity levels, and to a lesser extent at low parity levels, it also means that the first and higher-order birth rate models in focus of this study are misspecified. In other words, the effects that are estimated are inadequate measures of the causal impact of unemployment on fertility. If ethnicity is the most important excluded variable, the causal effects of unemployment are probably more clearly negative than suggested by the estimates.
could be different at higher parities. For example, more of them might be homemakers, who could have a relatively low fertility, as explained above. However, the interaction with parity is sharpest for men, among whom very few are homemakers.
Simulations based on estimates from parity-specific models for higher-order births give, of course, the same results as reported above.
6. Conclusion
A woman's unemployment seems to have little impact on her fertility. Whereas second-and higher-order birth rates are slightly lower for women who were unemployed one year before than for other women, an opposite effect of about the same size is estimated for first births. By contrast, sharper negative effects of men's unemployment are seen.
Previous studies of individual-level unemployment and fertility have included very few control variables. This is a limitation of the present study as well, although the large data set and the comparison of effects at individual and aggregate level, for men and women, and at different parities should nevertheless make it a valuable contribution to the literature. The lower educational level of the unemployed is taken into account (without being a very important control variable), but the data do not allow other supposedly important determinants of unemployment to be included. The bias introduced because of this is unknown. Presumably, unemployment effects would have been more negative for both men and women if it could be controlled for the over-representation of immigrants among the unemployed. On the other hand, if the unemployed tend to have a poor health as well, which has been seen in some other countries, the bias might go in the opposite direction, perhaps most markedly for women. Norwegian studies from this period have shown that also low wages and short work experience are among the determinants of unemployment. The relationship between these factors and fertility is not firmly established, but it seems most reasonable to assume that inclusion of a wage variable would have produced more negative effects of unemployment for women, if influential at all. The opposite is more plausible for men. Less is known about work experience, but according to a Norwegian study (Kravdal 1994), its inclusion would at least have given more positive effects for first births. An additional complicating factor is that partners' unemployment chances are correlated. In particular, the effect of woman's unemployment might have been slightly more positive if that of her partner had been included.
theoretical arguments above. It is less clear, however, whether a woman's unemployment actually reduces or increases her fertility. Given the weak effects that are estimated, and the many possible sources of spuriousness, one can merely conclude that a large effect of any sign seems unlikely.
On the whole, unemployment seems to have had a modest impact on fertility in Norway, especially through the individual-level effects. (This would be true also if the negative effects of men's unemployment were actually, say, twice as strong as suggested by the estimates.) According to simulations based on the model estimates, an increase in unemployment from 2% to 6% would reduce total fertility by only 0.01 through individual-level effects.
Macro-level effects are more important, unless the additional municipality characteristics that have been included (occupational structure and main region of residence) are much less adequate as controls than the individual-level variables.
According to the estimates, an increase in unemployment from 2% to 6% is associated with a reduction of fertility by about 0.08, as a combined individual- and aggregate-level effect. Stated differently, if unemployment in 1993 had been at the low level of 2% (or less), which was experienced during much of the post-war period, total fertility would have been 0.08 higher. This hinges on the assumption that a change in unemployment over time will produce a change in fertility that is of the same size as the corresponding cross-sectional differences in fertility. Moreover, the assessment is based on municipalities as the only aggregation level. It might well be that other levels of aggregation would have given somewhat different results. With the available data, it would not be possible to go below the municipality level, but one could in future studies check the importance of unemployment in a larger region of neighbouring municipalities.
7. Acknowledgements
References
Agresti A. (1990). Categorical Data Analysis. New York: Wiley and sons.
Colbjørnsen, T. 1994. “Fra elendighetsbeskrivelser til mestringsstudier.” In: A. Sandmo, editor. Perspektiv på Arbeidsledigheten. SNF Årbok. Bergen: Fagbokforlaget.
DeCooman, E., J. Ermisch, H. Joshi. (1987). “The next birth and the labour market: A dynamic model of births in England and Wales.” Population Studies, 41: 237-268.
Ermisch, J. (1988). “Econometric analysis of birth rate dynamics in Britain.” Journal of Human Resources, 23: 563-576.
Happel, S.K., J.K. Hill, S.A. Low. (1984). “An economic analysis of the timing of first birth.” Population Studies, 38: 299-311.
Hoem, B. (1998). Barnfödande och sysselsättning. Demografiska rapporter 1998:1. Statistics Sweden, Stockholm.
Hoem, B. (2000). “Entry into motherhood in Sweden: the influence of economic factors on the rise and fall in fertility, 1986-1997.” Demographic Research (online) www.demographic–research.org/volumes/vol2/4
Impens, K.K. (1989). “The impact of female unemployment on fertility in Flanders.” In: R.L. Cliquet, G. Dooghe, J. De Jong-Gierveld, F. Van Poppel, editors. Population and Family in Low Countries VI 18: 119-140.
Kjønstad, A. , ed. (1998). Folketrygdloven med Kommentarer. Oslo: Ad Notam Gyldendal.
Kravdal, Ø. (1992). ”The weak impact of female labour force participation on Norwegian third-birth rates.” European Journal of Population, 8 : 247-263.
Kravdal, Ø. (1994). ”The importance of economic activity, economic potential and economic resources for the timing of first birth in Norway.” Population Studies, 48: 249-267
Kravdal, Ø. (1997). ”Wanting a child without a firm commitment to the partner: Interpretations and implications of a common behaviour pattern among Norwegian cohabitants.” European Journal of Population, 13: 269-298.
Kravdal, Ø. (2001a). ”Main and interaction effects of women’s education and status on fertility: The case of Tanzania.” European Journal of Population 17: 107-136
Kravdal, Ø. (2001b). ”The high fertility college educated women in Norway: An artefact of the separate modelling of each parity transition." Demographic Research (online) www.demographic–research.org/volumes/vol5/6.
Kravdal, Ø. (2002). ”Is the previously reported increase in second- and higher-order birth rates in Norway and Sweden from the mid-1970s real or a result of inadequate estimation methods?" Demographic Research (online) www.demographic–research.org/volumes/vol6/9.
Kreyenfeld, M. (2000). ”Changes in the timing of first birth in East Germany after re-unification.” Schmollers Jahrbuch 120: 169-186. Berlin: Duncker & Humblot.
Macunovich, D.J. (1996). “Relative income and price of time: exploring their effects on US fertility and female labor force participation.” Population and Development Review, 22 Suppl: 223-257.
Macunovich D.J., R. Easterlin. (1988). “Application of Granger-Sims causality test to monthly fertility data.” Journal of Population Economics, 1: 71-87.
Nilsen, Ø.A., A.E. Risa, A. Torstensen. (2000). "Transition from employment among young Norwegian workers." Journal of Population Economics 13: 21-34.
Nordberg. M. (2000). "Hvem er de ledige? En økonometrisk analyse av arbeidsledighetens sammensetning i Norge på 1990-tallet." Report 1/2000. Ragnar Frisch Centre for Economic Research, Oslo.
OECD. 1999. Web site www.oecd.org/new-numbers/
Oppenheimer, V. K. (1994). “Women’s rising employment and the future of the family in industrial societies.” Population and Development Review, 20: 293-342.
Pedersen, P.J., N. Westergård-Nielsen. (1998). "Unemployment: What do we know from longitudinal data?" In: T. Lange, editor. Unemployment in Theory and Practice. Cheltenham: Edward Elgar
Preston D.L., J.H. Rubin JH, P.A. Pierce PA et al. (1993). Epicure user's guide. Seattle: Hirosoft International Corporation.
Rødseth, A. (1994). ”Om konjunkturane i Norge etter 1980: Vegen til høg arbeidsløyse.” In: A. Sandmo, editor. Perspektiv på Arbeidsledigheten. SNF Årbok, Bergen: Fagbokforlaget.
Røed, K., T. Zhang. (2000). “Labour market transitions and economic incentives.” Memorandum 2000/15, Department of Economics, University of Oslo, Norway.
Røed, K. (2001). "Hvor stramt er arbeidsmarkedet? Et forslag til ny konjunkturindikator." Økonomisk Forum 55 (3): 25-32.
Santow, G., M. Bracher. (2001). “Deferment of first birth and fluctuating fertility in Sweden.” European Journal of Population 17: 343-363.
Sardon, J.P. (2000). ”The demographic situation of Europe and the developed countries overseas.” Population: An English Selection 12: 293-328.
Statistics Norway. (1985). “Standard for kommuneklassifisering.” Standarder for norsk statistikk 4. Oslo-Kongsvinger.
Sullingham, O., J. Falkingham. (1991). ”Unemployment: family circumstances and childhood correlates among young people in Britain.” In: M. Murphy, J. Hobcraft, editors. Population Research in Britain, Population Studies, 45 Suppl: 115-132