11
Numerical Methods in Civil Engineering
Study on the Effect of the Position of X-bracing Arrangement in the Steel
Structures with a Triangular Plan
Kheyroddin, A.
*and Ezoddin, A.R.
**ARTICLE INFO Article history: Received: April 2017 Revised: July 2017 Accepted: October 2017
Keywords:
Triangular structures Steel brace position Non-linear static Torsional moment Eccentricity
Abstract:
In buildings with triangular plan, the center of mass and rigidity cannot geometrically match all possible directions of the earthquake. This will result in torsional moments in the stories causing the building to rotate around the center of rigidity. In this paper, via response spectrum analysis (RSA) and nonlinear static analysis, the seismic behavior of 5-, 10- and 15-story steel structures with a triangular plan is investigated by proposing 7 types of bracing arrangements in the plan. According to the analysis results, the most appropriate bracing arrangements in these seven proposed models in the triangular planes is the arrangement of braces in the middle of the triangle sides and continuous. This causes the center of mass to get closer to the center of rigidity, as a result of which, torsional moments and additional rotational displacements at the stories are decreased. The continuous braces reduces the lateral displacement of the structure about 38% and increases the displacement ductility ratio about 12%. Also, in structures whose braces cross each other at one point, the torsional strength of the system has been zeroed and in accordance with the ASCE7-16, they are considered to possess extreme torsional irregularity and the structures are therefore unstable.
1. Introduction
In urban areas with a high density, constraints due to the shape of the streets leads to the formation of conventional triangular, trapezoidal, or iron forms and sometimes architectural considerations have a significant effect on the behavior of building structures due to the shape of the building plan. The performance of buildings in past earthquakes has shown that generally, asymmetric buildings are more vulnerable and will have more severe damage during an earthquake and the probability of collapse is higher than symmetrical buildings. By studying the behavior of these buildings during an earthquake, it can be concluded that the vulnerability of these buildings is a result of torsional moments and additional rotational displacements which is caused by an asymmetry in the building's diaphragms causing structural and non-structural damages, especially on the external sides of the building. Asymmetry of the building can be due to asymmetric mass distribution in the building's diaphragms, or a result of the asymmetric distribution of stiffness or resistance to lateral elements.
*Corresponding Author: Professor, Civil Engineering Faculty, Semnan University and member of Center of Excellence for Engineering and Management of Civil Infrastructures, University of Tehran, Tehran, Iran. **Ph.D. Candidate, Civil Engineering Faculty, Semnan University, Semnan, Iranand lecturer, Department of Civil Engineering, Semnan Branch, Technical and Vocational University (TVU), Semnan, Iran.
Therefore, it can be concluded that the position, stiffness and resistance of mass of center, are the main parameters which affects the behavior of asymmetric structures. Other important parameters that affect the torsional behavior of structures are, the stiffness and torsional strength of the structure and the mass moment of inertia of the story [1]. In buildings with irregular plans, especially triangular buildings, because of the noncompliance of the center of mass and the center of rigidity, the torsional moment causes the building to rotate around the rigidity center. To avoid torsional deformation, the center of rigidity of the building must be aligned with its center of mass. However, the rigidity center of a triangular building can be matched to its center of mass, but it is often difficult to maintain this compliance in a non-elastic stress state. If there is eccentricity between the center of rigidity and the center of mass in a structure with less torsional stiffness, the torsional deformation will be higher [2]. Paulay [3] studied the torsional behavior of asymmetric braced and unbraced structures. He concludes that in these structures, the most critical element is the farthest element with the least displacement of the limit of flow and the main factor in the torsional behavior of the structure is the eccentricity of resistance which should be determined by examining and determining the torsional moment in the structure. Paulay
Numerical Methods in Civil Engineering, Vol. 2, No. 2, December. 2017
[4] also did not approve the strength distribution in the regulations and suggested that building conditions be used at the ultimate limit rather than the desired strength distribution. Myslimaj and Tso [5] investigated different arrangements of the stiffness, strength, and mass for a floor model. Their research results showed when the structure reacts in a linear region, the behavior of structure depends on the position of the center of rigidity, but if one lateral resistant elements is produced with displacement, the location of the resultant force resistance from the center of
rigidity to the center of stiffness can influence the center of
stiffness in the response structure. Therefore, the two factors
namely, the center of stiffness and rigidity in reaction of
structures are important and must be considered in the design. They concluded that the most appropriate arrangement is that, the center of stiffness is on both sides of the center of mass. They called this arrangement a balanced arrangement. This balanced arrangement reduced story drift ratio and structure rotation, but increased the ductility significantly. Humar et al. [6], discussed the torsion criteria in NBCC [7] and the proposed text of NBCC [8]. NBCC [7] considers the torsional effect via static analysis of a structural model in which the force of the earthquake is placed at a distance relative to the center of rigidity. To take into account the possibility of increased torsion due to the nature of the dynamic response and also the effect of the
random torsion, the eccentricity ed is assumed to change in
the range of Eq. (1) and (2) of the following design:
d1
e =1.5e + 0.1b (1)
d2
e =0.5e - 0.1b (2)
Where, b is the structural model dimension perpendicular to the earthquake. Structural resistant elements for
earthquake forces located at ed1 or ed2 distance from the
center of rigidity are designed. Zalka [9] investigated torsional analysis of multi-story building structures under horizontal load. The results of a comprehensive accuracy analysis demonstrated the validity of the method. Kim and
Hong [10] investigated the progressive collapse
performance of irregular buildings. They considered the progressive collapse-resisting capacities of 30-storey tilted buildings with braced cores and 30-storey twisted buildings with reinforced concrete cores and evaluated them by nonlinear static and dynamic analyses. They concluded the
progressive collapse potential of the tilted structures varied significantly, depending on the location of the removed column. It was also observed in the tilted structures that the plastic hinges were formed not only in the bays from which a column was removed, but also in the nearby bays. Ravikumar et al [11] considered the effect of irregular configurations on seismic vulnerability of RC buildings. They studied two kinds of irregularities in the building models namely, plan irregularity with geometric and diaphragm discontinuity and vertical irregularity with setback and sloping ground. Analytical approaches were performed to identify the seismic demands in both linear and nonlinear way. Gokdemir et al [12] studied the effects of torsional irregularity on structures during earthquakes. The results were compared and precautions were taken to prevent damages caused by torsional irregularity under earthquake loads. Also, statements in different earthquake codes related to torsional irregularity were compared. The results showed that separating big building sections from each other with proper separation distances and increasing lateral rigidity in the weak direction of the structures decreases the effect of torsion. Tarbali and Shakeri [13] proposed a single-run pushover procedure to assess the seismic response of asymmetric-plan buildings, when subjected to unidirectional earthquake ground motions. The effects of the higher and torsional modes were incorporated into an invariant load pattern, which was calculated based on the height-wise distribution of the modal story shear and torsional moment. Many studies were conducted about the modifying seismic analysis of multistory asymmetric elastic buildings. For example, Georgoussis [14] and Georgoussis et al [15] studied modified seismic analysis of multistory asymmetric elastic buildings and suggestions for minimizing the rotational response. Bahmani et al [16] studied the factor story drift ratio to compare the design of buildings against torsion.
According to the American Society of Civil Engineers (ASCE7-16) [17], the horizontal irregularity (in the plan) types are categorized as follows:
Torsional irregularity, extreme torsional irregularity, reentrant corner irregularity, diaphragm discontinuity irregularity, out-of-plane offset irregularity and nonparallel system irregularity.
Examples of buildings with a triangular plan have been shown in Fig. 1.
a) Soochow Securities Headquarters (21-story in Suzhou, China) b) Fuller Building (22-story in New York City) c) Triangular building in
the city Denver, Colorado
Fig. 1: Example buildings with triangular plan [18].
13
The rotational response of building structures duringstrong ground motions has been proved to be the main cause of partial or total collapse. In recent years a number of investigations have been carried out to demonstrate the seismic vulnerability due to vertical and horizontal structural irregularities. Han et al [19] evaluated the collapse performance of multi-story model structures with various degrees of torsional irregularity via nonlinear response history analyses.
The shear force that is produced in the building stories, along with the shear force due to the torsion created by the eccentricity, is distributed between the various elements of the resistant system proportional to their center of rigidity and the center of mass. Fig. 2 shows the distance of the center of mass from the center of rigidity in a triangular plan which causes the torsional moment in the structure and leads to the rotation of the structure around the rigidity center where, CR and CM are the center of rigidity and the center of mass respectively.
Fig. 2: Torsional moment on the floor due to the eccentricity of the lateral force relative to the center of rigidity of the floor.
2. The Objective of the Research
Previous studies have been conducted on simplified models in the plan. In these studies, only the results of model analysis are considered, and the type of plan and design of the structures has been neglected. In the analysis of the
structures, some assumptions such as the P- effect, the
effect of the random torsion resulting from the shape of the plan and torsional moment due to the distance between the center of the mass and the center of rigidity that leads to general damage to the structure, has been neglected. Therefore, in this research, the choice of a structural resistant system against lateral and gravity loads in these plans is very important. The use of steel braces, due to their high stiffness and strength in steel structures makes the position and the study of behavior of these structures to be considered. The brace position in the building plan extremely affects the behavior of the structure, in particular the torsional moment of the floors, uplift force, the lateral displacement, the story drift ratio and the eccentricity. According to the research, many steel structures with triangular plans are vulnerable under earthquakes, the main reason for which is the resistant system, and the position of the braces in the plan. The main objective of this research is to determine the best positioning
of steel bracing in the triangular plans. As a result, three steel structures with a triangular plan of 24 meter side at three
different heights of 5-, 10- and 15- stories is studied with
different position of bracing and the results are compared with each other.
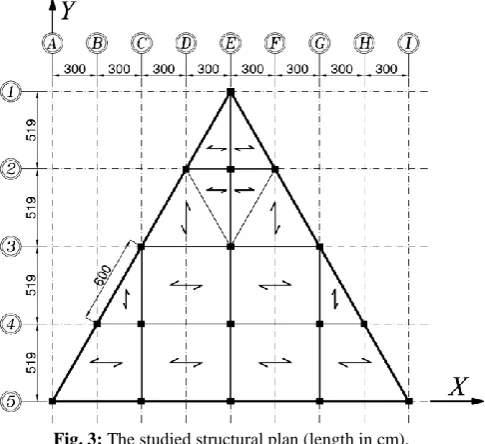
3. Building Description
In this paper, seven models with the triangular plan of 5-, 10- and 15- story steel structures with different positions of concentrically braced frames (CBF) is investigated. The plan of the structure is studied as an equilateral triangle with sides of 24 meters and height of 3.4 meters, which is the same for each of the seven models. The roof of the building is the hollow-tile type with blocks to a height of 33 cm. Structural steel properties are used with a minimum yielding stress 240 MPa and ultimate stress 370 MPa and Poisson’s
ratio = 0.3. The plan of the studied structures is shown in
Fig. 3.
Fig. 3: The studied structural plan (length in cm).
In general, for 5-, 10- and 15-story structures, 6 braces are used in the plan. To analyze these seven different patterns of the brace in the plan, each of the 7 models was first analyzed and the sections of beams, columns and braces were designed for each of these seven models and the most critical model with the maximum displacement, uplift force, story drift ratio and torsional moment in the floors was selected. Subsequently, the designed sections of the critical model were used for 6 other structure models. The purpose of this method is to maintain the stiffness of the structure of the other 7 models which can be compared with each other and the most appropriate bracing position in these plans was identified. This arrangement of braces in the structure plan is shown in Fig. 4. The 7 different brace arrangements in the plan are as follows:
- Model S1: Two successive braces on the center of the diagonal side of the triangle along the Y axis and two braces on the triangle base, each of which is close to the vertex of the triangle.
Numerical Methods in Civil Engineering, Vol. 2, No. 2, December. 2017
- Model S2: There are two braces on each vertex of the triangle.
- Model S3: Two successive braces on each diagonal side of the triangle along the Y axis and two successive braces in the middle and perpendicular to the triangle base parallel to the Y axis.
- Model S4: The braces are located each side of the triangle consecutively and at the intermediate spans.
- Model S5: Three successive braces on each diagonal side along the Y axis these braces are close to the triangle base.
- Model S6: Two successive braces on each side of the diagonal triangle along the Y axis, which is close to the triangle's base, and two braces on the triangle's base, each of which is close to the vertex of the triangle.
- Model S7: Three successive braces on each side of the diagonal side, which is close to the vertex of the triangle.
The purpose of the arrangement of the S3, S5, and S7 models is that, the location of consecutive braces and the crossing of braces at one point result in the torsional strength zero.
S1 S2 S3
S4
S5 S6S7
Fig. 4: Plan number of studied structures by placing braces in different positions on the plan.
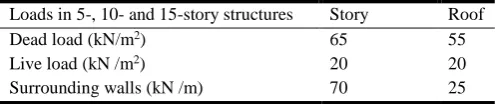
Lateral load bearing systems in all structures is considered based on minimum design loads for buildings and other structures ASCE 7-16 [4]. The service loads are summarized in Table 1.
Table 1. Value of the service loads in 5, 10 and 15-story steel structure models.
Loads in 5-, 10- and 15-story structures Story Roof
Dead load (kN/m2) 65 55
Live load (kN /m2) 20 20
Surrounding walls (kN /m) 70 25
15
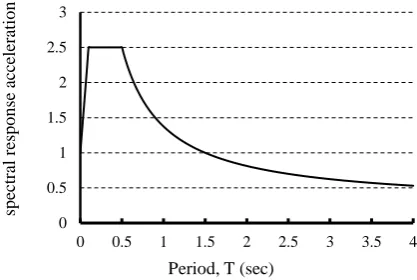
The analysis of the above structures is performed by usingtwo methods of the spectrum and nonlinear static analysis executed by software ETABS 2013 [20]. To create a spectrum of a standard design, it is necessary to have the
spectral coefficient, which is 𝐴𝐼
𝑅 multiplied by the values of
the reflection spectrum of the building (B) where A = 0.35g and g is the gravity gradient of the earth. In the spectral analysis of superposition, modes of complete quadratic combination (CQC) method is used. The design spectrum reflects the effect of the motion of the earth. In determining this spectrum, damping ratio is assumed as 5%. The acceleration response spectrum is as shown in Fig. 5.
Fig. 5: The design acceleration response spectrum
The structural design is carried out based on American Institute of Steel Construction (AISC) [21]. The sections used for the three 5-, 10- and 15-story structures are summarized in Table 2.
Table 2. Sectional dimensions for 5-, 10- and 15-story steel structure.
Case Studies
Story Numbers
Brace Size
Column Size (mm)
5
1 2UNP14 Box 250×250×12
2 , 3 2UNP12 Box 200×200×10
4 2UNP10 Box 200×200×10
5 2UNP8 Box 200×200×6
10
1, 2 2UNP18 Box 550×550×15
3 , 4 2UNP16 Box 450×450×12
5 , 6 2UNP14 Box 400×400×10
7 , 8 2UNP12 Box 250×250×10
9 2UNP10 Box 200×200×10
10 2UNP8 Box 200×200×6
15
1, 2 , 3 2UNP22 Box 800×800×20
4 , 5 2UNP20 Box 700×700×20
6 , 7 2UNP18 Box 600×600×20
8 , 9 2UNP16 Box 500×500×20
10 , 11 2UNP14 Box 450×450×12
12 , 13 2UNP12 Box 350×350×10
14 2UNP10 Box 250×250×10
15 2UNP8 Box 200×200×6
4. Analysis of the Results
4.1. Spectral Analysis (Complete Quadratic Combination (CQC) Method)
4.1.1 Study of the effect of floor displacement
By comparing the story displacement in these seven models of bracing arrangement in the plan, the least displacement is in the direction of the X axis related to the S4 structure compared to the S1 structure that has the largest displacement. The lateral displacement in that direction for the model S4 than S1 at the three structural 5-, 10- and 15-story is reduced 35%, 41% and 39%, respectively as shown in Figs 5-7. For models S3, S5, and S7, crossing at one point along the bracings location, causes the torsional resistance of these three structures to be zero leading to the displacement of 211, 350 and 405 cm, for 5-, 10- and 15-story structures as shown in Figs. 6-8, respectively.
By comparing the displacement along the Y axis, it can be observed that the smallest displacement is related to the structures S3, S5 and S7 but, since in these three models, all the braces crossed at a one point, it has led to the torsional moment of the X axis to be zero as shown in Figs. 6-8. Therefore, the three models do not satisfy the conditions for the control of lateral displacement according to ASCE 7-16 [4].
The minimum lateral displacement in the four remaining models along the Y-axis of the S4 model in comparison with S1 which is reduced for the 5-, 10-, and 15-story structures is about 31, 36 and 43 percent, respectively. Therefore, from the different arrangements in the plan for the 5-, 10-, and 15-story structures in the 7 models, the S4 model is the most suitable model in terms of lateral displacement in two directions of X and Y.
0 0.5 1 1.5 2 2.5 3
0 0.5 1 1.5 2 2.5 3 3.5 4
sp
ec
tral
re
sp
o
n
se
a
cc
elera
ti
o
n
Period, T (sec)
Numerical Methods in Civil Engineering, Vol. 2, No. 2, December. 2017
a) Lateral displacement along the X axis for seven structural models. b) Lateral displacement along the X axis for four structural
models.
c) Lateral displacement along Y-axis for seven structural models.
Fig. 6: Story displacement for 5-story structure.
a) Lateral displacement along the X axis for seven structural models. b) Lateral displacement along the X axis for four structural models.
0
1
2
3
4
5
0
0.5
1
1.5
2
2.5
3
3.5
S
to
ry
Nu
m
b
er
Lateral Displacement (cm)
S1
S2
S4
S6
0 1 2 3 4 5
0
50
100
150
200
250
S
to
ry
Nu
m
b
er
Lateral Displacement (cm)
S1
S2
S3
S4
S5
S6
S7
0 1 2 3 4 5
0 0.5 1 1.5 2 2.5 3 3.5 4
S
to
ry
Nu
m
b
er
Lateral Displacement (cm)
S1
S2
S3
S4
S5
S6
S7
0 1 2 3 4 5 6 7 8 9 10
0 2.5 5 7.5 10 12.5 15
S
to
ry
Nu
m
b
er
Lateral Displacement (cm)
S1
S2
S4
S6
0 1 2 3 4 5 6 7 8 9 10
0 50 100 150 200 250 300 350
S
to
ry
Nu
m
b
er
Lateral Displacement (cm)
S1
S2
S3
S4
S5
S6
S7
17
c) Lateral displacement along Y-axis for seven structural models.
Fig. 7: Story displacement for 10-story structure.
a) Lateral displacement along the X axis for seven structural models. b) Lateral displacement along the X axis for four structural models.
0 1 2 3 4 5 6 7 8 9 10
0 2.5 5 7.5 10 12.5 15
S
to
ry
Nu
m
b
er
Lateral Displacement (cm)
S1
S2
S3
S4
S5
S6
S7
0 1 2 3 4 5 6 7 8 9 10 11 12 13 14 15
0 5 10 15 20 25 30
S
to
ry
Nu
m
b
er
Lateral Displacement (cm)
S1
S2
S4
S6
0 1 2 3 4 5 6 7 8 9 10 11 12 13 14 15
0 100 200 300 400 500
S
to
ry
Nu
m
b
er
Lateral Displacement (cm)
S1
S2
S3
S4
S5
S6
S7
Numerical Methods in Civil Engineering, Vol. 2, No. 2, December. 2017
c) Lateral displacement along Y-axis for seven structural models.
Fig. 8: Story displacement for 15-story structure.
4.1.2 Investigation of the effect of the story drifts ratio The story drift ratio is one of the indicators for assessing seismic damage to the structure and it is very important in designing structures. According to the results of the spectral analysis for three 5-, 10- and 15-story structures, the minimum story drift ratio relates S4 structure and the maximum story drift ratio relates to the three structures S3, S5 and S7, as shown in Figs 9-11. The story drift ratio of the X-axis stories for the S4 decreased more than the S1 model for the three 5-, 10- and 15-story structures by about 42, 43 and 39 percent, respectively. The smallest story drift ratio along the Y axis is for the three S3, S5, and S7 structures. But, as shown in Figs. 9-11, in the direction of axis X, the
three structures have maximum story drift ratio and therefore exceed the allowed amount of ASCE7-16 [4] because, in these three structures, the torsional resistance along the X axis is zero and the structure cannot resist against the torsion that occurs, resulting in excessive story drift ratio. The story drift ratio of the Y-axis classes for the S4 model in comparison with the S1 model of the three 5-, 10- and 15-story structures are reduced by about 41, 39 and 48 percent, respectively. Therefore, the S4 structure has the least lateral displacement and the story drift ratio among these seven brace models.
a) The Story drift along the X-axis for seven bracing arrangement models. b) The Story drift along the X-axis for four bracing
arrangement models. 0
1 2 3 4 5 6 7 8 9 10 11 12 13 14 15
0 5 10 15 20 25 30
S
to
ry
Nu
m
b
er
Lateral Displacement (cm)
S1
S2
S3
S4
S5
S6
S7
0 1 2 3 4 5
0 0.05 0.1 0.15 0.2 0.25
S
to
ry
Nu
m
b
er
Drift Ratio
S1
S2
S4
S6
0 1 2 3 4 5
0 5 10 15 20 25 30 35
S
to
ry
Nu
m
b
er
Drift Ratio
S1
S2
S3
S4
S5
S6
S7
19
c) The story drift along the Y-axis for seven bracing arrangement models.
Fig. 9: Story drift for 5-story structure.
a) The Story drift along the X-axis for seven bracing arrangement models. b) The Story drift along the X-axis for four bracing
arrangement models.
c) The story drift along the Y-axis for seven bracing arrangement models.
Fig. 10: Story drift for 10-story structure. 0
1 2 3 4 5
0 0.05 0.1 0.15 0.2 0.25
S
to
ry
Nu
m
b
er
Drift Ratio
S1
S2
S3
S4
S5
S6
S7
0 1 2 3 4 5 6 7 8 9 10
0 0.1 0.2 0.3 0.4 0.5 0.6 0.7
S
to
ry
Nu
m
b
er
Drift Ratio
S1
S2
S4
S6
0 1 2 3 4 5 6 7 8 9 10
0 5 10 15 20 25 30 35 40
S
to
ry
Nu
m
b
er
Drift Ratio
S1
S2
S3
S4
S5
S6
S7
0 1 2 3 4 5 6 7 8 9 10
0 0.1 0.2 0.3 0.4 0.5 0.6
S
to
ry
Nu
m
b
er
Drift Ratio
S1
S2
S3
S4
S5
S6
S7
Numerical Methods in Civil Engineering, Vol. 2, No. 2, December. 2017
a) The Story drift along the X-axis for seven bracing arrangement models. b) The Story drift along the X-axis for four bracing
arrangement models.
c) The story drift along the Y-axis for seven bracing arrangement models.
Fig. 11: Story drift for 15-story structure.
4.1.3 Investigation of torsional moment
To calculate the torsional moment of the story after the initial analysis of the model, the displacement of soft and hard edges is calculated. It is determined that, the maximum drift in each story, including accidental torsion at one end of the structure which has exceeded 20% of the average of the story drifts of the two ends of the structure, differs along the X axis. The rotations created at the level of each story in the
spectral analysis are due to the differences in distance between the center of mass and the center of rigidity of that story of the building. In other words, the moment produced at the center of rigidity results from the multiplication of the amount of lateral force in the eccentricity of axial static. The torsional moment for 7 structural models with 5-, 10- and 15-story is shown in Figs. 12-14, respectively.
0 1 2 3 4 5 6 7 8 9 10 11 12 13 14 15
0 0.1 0.2 0.3 0.4 0.5 0.6 0.7 0.8
S
to
ry
Nu
m
b
er
Drift Ratio
S1
S2
S4
S6
0 1 2 3 4 5 6 7 8 9 10 11 12 13 14 15
0 2.5 5 7.5 10 12.5 15 17.5 20 22.5
S
to
ry
Nu
m
b
er
Drift Ratio
S1
S2
S3
S4
S5
S6
S7
0 1 2 3 4 5 6 7 8 9 10 11 12 13 14 15
0 0.1 0.2 0.3 0.4 0.5 0.6 0.7
S
to
ry
Nu
m
b
er
Drift Ratio
S1
S2
S3
S4
S5
S6
S7
21
a) 7 model arrangement brace b) 4 model arrangement brace
Fig. 12: Comparison of torsional moment story for 5-story.
a) 7 model arrangement brace b) 4 model arrangement brace
Fig. 13: Comparison of torsional moment story for 10-story.
a) 7 model arrangement brace b) 4 model arrangement brace
Fig. 14: Comparison of torsional moment story for 15-story.
The results obtained in Figs. 12-14 show that, the S4 structure has the lowest torsional moment in all three 5-, 10- and 15-story structures, which is less than 72% compared to the S2 structure. The largest torsional moment relates to the S3, S5 and S7 structures, which is 14 times greater than the
S4 structure. Because in these three structures, the braces cross one another, there is no lateral brace in the X direction. As a result, the distance between the center of mass and the center of rigidity increases and leads to a torsional moment in these three structures.
0 1 2 3 4 5
0 500 1000 1500 2000 2500 3000
S to ry Nu m b er
Twisting Moment (ton.m)
S1 S2 S3 S4 S5 S6 S7 0 1 2 3 4 5
0 100 200 300 400 500
S to ry Nu m b er
Twisting Moment (ton.m)
S1 S2 S4 S6 0 1 2 3 4 5 6 7 8 9 10
0 1000 2000 3000 4000 5000 6000
S to ry Nu m b er
Twisting Moment (ton.m)
S1 S2 S3 S4 S5 S6 S7 0 1 2 3 4 5 6 7 8 9 10
0 200 400 600 800 1000
S to ry Nu m b er
Twisting Moment (ton.m)
S1 S2 S4 S6 0 1 2 3 4 5 6 7 8 9 10 11 12 13 14 15
0 1000 2000 3000 4000 5000 6000
S to ry Nu m b er
Twisting Moment (ton.m)
S1 S2 S3 S4 S5 S6 S7 0 1 2 3 4 5 6 7 8 9 10 11 12 13 14 15
0 500 1000 1500 2000 2500
S to ry Nu m b er
Twisting Moment (ton.m)
S1
S2
S4
S6
Numerical Methods in Civil Engineering, Vol. 2, No. 2, December. 2017
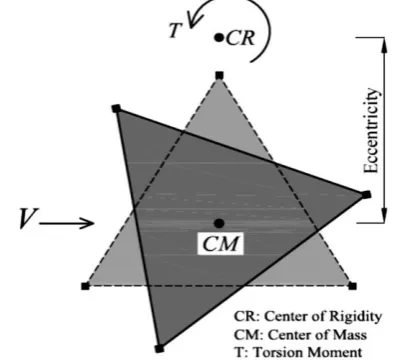
4.1.4 Investigation of the eccentricity ratio
One of the important parameters in the design of structures is the distance between the center of mass and the center of rigidity which is termed as eccentricity. The distance between the center of mass and center of rigidity of the three 5-, 10- and 15-story structures for 7 different bracing arrangements is shown in Table 3.
Table 3. Comparison of eccentricity for 7 bracing arrangement models (Units in meters).
Story S1 S2 S3 S4 S5 S6 S7
5 0.68 1.36 14.68 0.76 14.71 1.78 14.63
10 0.78 1.56 15.72 0.61 14.76 1.14 14.71
15 1.23 3.74 15.68 1.17 14.68 2.21 14.78
Since the S3, S5 and S7 models do not meet the regulatory criteria and have high eccentricity, comparison of the results of eccentricity is observed for four other models (structures S1, S2, S4 and S6). S4 structure has minimum eccentricity which is about 72% less than the S2 structure which has the maximum eccentricity. As a result, the structure will have less damage due to torsion. Also, the results of Table 3 indicate that the amount of eccentricity in three structures S3, S5 and S7 is about 13.5 times higher than S4 structure which results in a large torsional moment in these three structures because the amount of the arm of this torsional moment is 13.5 times the S4 structure. Fig. 15 shows the position of center of mass and center of rigidity for three structures S3, S5 and S7. The structure rotates
around the center of rigidity (CR) and causes severe damage to the structure.
Fig. 15: The position of the center of rigidity and center of mass in three structures S3, S5 and S7.
4.1.5 Investigation of irregularity torsion
In accordance with ASCE-7-16 [4], when the maximum story drift, including accidental torsion with Ax =1.0 at one end of the structure transverse to an axis, is more than 1.4 times the average of the story drifts at the two ends of the structure, this building is considered to possess extreme
torsional irregularity. The maximum displacement (max) to
the average of the displacements (Δav) ratio per floor,
including 5% of the randomized eccentricity in the X direction is shown in Table 4, 5 and 6.
Table 4. Ratio max toΔav of 5-story structure.
Story S1 S2 S3 S4 S5 S6 S7
1 1.128578 1.153462 1.919002 1.14623 1.95176 1.143034 1.95261
2 1.11813 1.157909 1.925528 1.144667 1.95505 1.142148 1.958691
3 1.109887 1.16137 1.934745 1.144037 1.961976 1.139341 1.96627
4 1.104345 1.163493 1.943595 1.14377 1.968165 1.137303 1.972408
5 1.09969 1.166046 1.951023 1.143851 1.972953 1.136008 1.977203
Table 5. Ratio max toΔav of 10-story structure.
Story S1 S2 S3 S4 S5 S6 S7
1 1.131255 1.152007 1.566802 1.147094 1.578343 1.138083 1.576698
2 1.122328 1.153018 1.562057 1.145593 1.575395 1.134558 1.574589
3 1.115581 1.154693 1.557797 1.144831 1.573359 1.131405 1.573301
4 1.110473 1.156665 1.553173 1.144508 1.571283 1.12888 1.571999
5 1.106073 1.158397 1.548002 1.144096 1.568871 1.126808 1.570481
6 1.102167 1.160019 1.54302 1.14366 1.566437 1.125014 1.569115
7 1.098677 1.161565 1.540841 1.143193 1.565585 1.123378 1.56931
8 1.095469 1.163047 1.5444 1.142688 1.568267 1.121868 1.572654
9 1.092559 1.164469 1.551223 1.142199 1.572933 1.120487 1.577483
10 1.090029 1.165796 1.557028 1.141738 1.576876 1.119166 1.581361
23
Table 6. Ratio max toΔav of 10-story structure.Story S1 S2 S3 S4 S5 S6 S7
1 1.117883 1.131056 1.538965 1.139974 1.562439 1.133028 1.564604
2 1.110682 1.133538 1.533169 1.13868 1.558977 1.129529 1.561958
3 1.104637 1.136128 1.528365 1.137843 1.556704 1.126412 1.560679
4 1.100032 1.138789 1.524165 1.137389 1.554981 1.12389 1.559964
5 1.09651 1.141538 1.520538 1.137116 1.553639 1.121812 1.559627
6 1.093552 1.144065 1.517638 1.136955 1.552706 1.120075 1.559657
7 1.091027 1.146644 1.515942 1.136893 1.552464 1.118606 1.560288
8 1.088198 1.149191 1.515529 1.136872 1.552915 1.117338 1.561467
9 1.086452 1.151512 1.516319 1.136859 1.554004 1.116222 1.563139
10 1.085005 1.153923 1.518485 1.136859 1.555876 1.115237 1.565452
11 1.083648 1.156218 1.520576 1.136864 1.557725 1.114364 1.567767
12 1.082397 1.158475 1.52011 1.136853 1.558186 1.113576 1.568986
13 1.081227 1.160601 1.516318 1.136815 1.556856 1.112852 1.568767
14 1.08005 1.162416 1.511359 1.136764 1.554911 1.112165 1.568006
15 1.078775 1.163799 1.507184 1.136703 1.553376 1.111491 1.567508
The ratio of maximum displacement (Δmax) to average
displacement (Δav) for the S4 model is less than 4%
compared to the S2 model. According to ASCE-7-16 [4], if
the maximum displacement (Δmax) to average displacement
(Δav) is greater than 1.4, the structure is considered to have
extreme torsional irregularity. As shown in Table 4, 5 and 5, this ratio is greater than 1.4 for the three S3, S5 and S7 models. Thus, these three structures are considered to
possess extreme torsional irregularities. This ratio for the three S3, S5 and S7 models is 54% higher than the S4 model which causes severe structural damage.
Table 7 investigates different types of the horizontal irregularities in accordance with the ASCE-7-16 standard for these seven models of bracing arranged in the plan.
Table 7. Summarizes different types of the horizontal irregularities in accordance with the ASCE-7-16 [4].
Model
Reentrant Corner Irregularity
Diaphragm Discontinuity Irregularity
Out-of-Plane Offset Irregularity
Nonparallel System Irregularity
Torsional Irregularity
Extreme Torsional Irregularity
S1 Yes No No Yes No No
S2 Yes No No Yes No No
S3 Yes No No Yes No Yes
S4 Yes No No Yes No No
S5 Yes No No Yes No Yes
S6 Yes No No Yes No No
S7 Yes No No Yes No Yes
4.2. Nonlinear Static Analysis (pushover)
4.2.1 Plastic hinge
Nonlinear static analysis, commonly referred to as pushover analysis, is a method for determining the ultimate load and deflection capability of a structure. Pushover analysis in ETABS 2013 [20] assumes that nonlinear behavior occurs within frame elements at concentrated plastic hinges with automated or user defined hinge properties being assigned to each hinge [22].
To investigate and compute the load redistribution behavior, the ETABS 2013 [20] program has been utilized. Both
nonlinear effects, including geometry and materials are considered for this program application. Program defaults plastic hinges for columns, specifications of a-row of Table 5-5 of ASCE 41-13 [23] for beams are used. For estimation of the nonlinear static response of the considered building models, lumped-plasticity models representing the potential failure modes in different members have been developed. The major bending moment (M3) plastic hinges has been
assigned at mid span of beams and axial force (P) plastic
hinges and axial force-biaxial moment (P-M2-M3) interaction hinges has been assigned at both ends of brace
Numerical Methods in Civil Engineering, Vol. 2, No. 2, December. 2017
and column elements, respectively. The idealized force-deformation curve of ASCE 41-06 (2007) is assigned to each
plastic hinge as shown Fig. 16. The values assigned to these points vary according to the type of structural member.
Fig. 16: Generalized force-deformation curve for frame elements [23].
Since the three S3, S5, and S7 structures did not recognize the acceptance conditions of linear static analysis (allowed displacement, story drift ratio) and were subject to severe torsion, a nonlinear static analysis was carried for four structures S1, S2, S4 and S6. This is shown in Fig 17, in the
force-displacement diagram for 5-, 10- and 15-story buildings. Also, the formation of plastic hinges for the four structures S1, S2, S4 and S6 for 5-, 10- and 15-story buildings is shown in Table 8.
a) 5-story structure b) 10-story structure
c) 15-story structure
Fig. 17: Comparison of pushover curves for four models. 0
500 1000 1500 2000 2500 3000
0 5 10 15 20 25 30
Sh
ea
r
Fo
rce
(
k
N)
Displacement (cm)
S1 S2 S4 S6
0 1000 2000 3000 4000 5000 6000
0 10 20 30 40 50 60 70
Sh
ea
r
Fo
rce
(
k
N)
Displacement (cm)
S1 S2 S4 S6
0 1000 2000 3000 4000 5000 6000 7000
0 10 20 30 40 50 60
S
h
ear
F
o
rce
(k
N)
Displacement (cm)
S1
S2
S4
S6
25
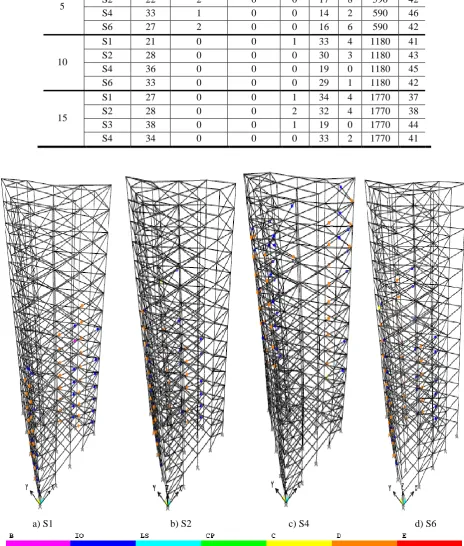
Table 8. The formation of plastic hinges in the braced frames.Number
Story Model
IO-LS (Life Safety)
LS-CP (Collapse Prevention)
CP-C
(Collapse) C-D D-E >E
Total plastic hinges
Step push
5
S1 19 2 0 0 19 8 590 43
S2 22 2 0 0 17 8 590 42
S4 33 1 0 0 14 2 590 46
S6 27 2 0 0 16 6 590 42
10
S1 21 0 0 1 33 4 1180 41
S2 28 0 0 0 30 3 1180 43
S4 36 0 0 0 19 0 1180 45
S6 33 0 0 0 29 1 1180 42
15
S1 27 0 0 1 34 4 1770 37
S2 28 0 0 2 32 4 1770 38
S3 38 0 0 1 19 0 1770 44
S4 34 0 0 0 33 2 1770 41
a) S1 b) S2 c) S4 d) S6
Fig. 18: Plastic hinge formation in candidate models for 15-story structure.
Based on the results of nonlinear static analysis, the structure initially has linear behavior with increasing horizontal load and then enters the nonlinear range. Similarly, with increasing load and increasing displacement
in the structure, it passes the immediate operation (IO) level and enters into the life safety (LS) zone. In this case, the building faces decreased stiffness and increased damping and, by entering the collapse limit (CP), the structure cannot
Numerical Methods in Civil Engineering, Vol. 2, No. 2, December. 2017
be loaded, and the joints exceed the yield limit. Since the area below the force-displacement diagram shows the amount of energy dissipated by the structure, the higher the area under this curve, the more the structure will be able to absorb and dissipate. The comparison of the push-over graph obtained from the nonlinear static analysis exhibited in Fig. 17, shows that the displacement of the S4 structure is 12% less than that of the S6 structure and the S4 structure is more ductile than the S6 and S2 structures. This is because the area under the push-over curve in the S4 structure is more than the S6 structure which causes an increase in the absorption and energy dissipation of the S4 structure compared to other models. Therefore, the bearing capacity of the S4 structure has a better performance than other structures and the design of the bracing system in the S4 model leads to increased structural ductility and resistance to lateral loads.
4.2.2 Displacement ductility ratio (µ)
The structural ability to tolerate elastic and plastic deformations without collapse of the structure is called the displacement ductility ratio of the structure. The displacement ductility ratio is the structural ability to tolerate non-elastic deformations and entering the plastic region can be calculated using Eq. (3).
μ=∆𝑑
∆𝑦 (3)
In the above relation, Δd is the ratio of maximum
displacement of the structure after entering the plastic region
and Δy is to the corresponding displacement at the onset of
yielding (yield displacement). The maximum relative and relative displacement of the structure in the structural yielding strength level are calculated based on Idealized force-displacement curves of the structure in accordance with ASCE 41-13 [23], as shown in Fig. 19. Nonlinear behavior of the structure shows the relationship between the base shear and the displacement of the control point as shown in Fig. 19. In order to calculate the effective lateral
stiffness Ke and the effective yield shear Vy, it should be
replaced by a simple linear behavior model. The first part of
the curve must begin with the slope Ke, which is equal to the
Secant modulus calculated for the base shear of 0.6 Vy. In a
simplified model, it should be noted that Vy is not greater
than the maximum base shear in the nonlinear behavior
curve. The second line with a positive slope 1Ke is used at
the point (Vd, d) and the intersection point with the first
line (Vy, y) so that, the area below the model of the bilinear
behavior is equal to the area below the nonlinear behavior
curve up to the point (Vy, y). The third line with negative
slope 2Ke is plotted using the point (Vy, y) and the point at
which the shear force is equal to 0.6 Vy.
Fig. 19: Idealized force-displacement curves [23].
Using a pushover curve and Idealized force-displacement curves, for four structures S1, S2, S4 and S6 at the 5-, 10- and 15-story buildings, the value of the displacement ductility ratio for the four above structures is calculated from Eq. (3), as shown in Table 9.
Table 9. Displacement ductility ratio for 5-, 10- and 15-story buildings.
Story S1 S2 S4 S6
5 1.86 1.94 2.01 1.88
10 1.76 1.98 2.15 2.03
15 1.91 2.21 2.24 2.14
Since the amount of displacement ductility ratio in the structure is greater, the structural ability to tolerate the deformations under applied load after the initial flow will be higher, without significant reduction in the overall resistance of the structure. Therefore, based on the results obtained in Eq. (3), which is shown in Table 9, it can be seen that, the average value of the displacement ductility ratio for the S4 structure is higher than the S1 structure for the three 5-, 10- and 15-story structures by about 16%.
5. Conclusion
The main objective of this research is the effect of the concentric braced frame position of the X-type in steel structures with a triangular plan. For this purpose, three 5-, 10- and 15-story structures with a triangular plan with 7 different bracing arrangements are used. The results of spectral and nonlinear static analysis of these structures are as follows:
1. The lateral displacement of the structure, where the braces are located on each side of the triangle successively in the middle openings, is about 37% less than a structure that has two braces which is close to the vertex of the triangle. The maximum lateral displacement in the three S3, S5, and S7 structures are along the X axis. Because each of the braces of these three models intercept each other at one
27
point, it causes the torsional strength of these three structuresto be zero.
2. The story drift ratio of the S4 model is 41% less than the S1 model. Thus, by locating the brace in the middle of the sides of the triangle, it is observed the story drift ratio is 2.5 times less than that of the brace in other places in the plan.
3. The S4 structure has the minimum and the S2 structure has the maximum eccentricity. So, the S4 structure has about 72% less eccentricity than the S2 structure. The maximum eccentricity is related to three S3, S5 and S7 structures which is about 13.5 times more than the S4 structure. Therefore, the distance of the center of mass from the center of rigidity causes a torsional moment in these three structures. Because the braces of the S3, S5 and S7 structures intercept at a point, their torsional resistance is zero and the structure rotates around the center of rigidity. The torsional moment value of the S4 structure is about 4 times lower than the S2 structure. 4. Since the area under the force-displacement curve represents the amount of energy dissipated by the structure, the more the area under this curve, the greater the ability to absorb and dissipate the energy of the structure is observed. Therefore, a structure with the braces are located each side of the triangle consecutively and at the intermediate spans (S4 structure), the performance level is better than other models, in that, this increases the strength and ductility of the structure.
5. The average value of the displacement ductility ratio for a structure whose braces are located each side of the triangle consecutively and at the intermediate spans (S4 structure), is higher than the S1 and S6 structures for the three 5-, 10- and 15-story structures by about 16%, 6%, respectively.
Therefore, the best effect of the concentrically bracing position in steel structures with a triangular plan is in the middle of the outer sides of the triangle, where the braces are located each side of the triangle consecutively and at the intermediate spans. This causes the center of mass to reach its minimum value giving the structure the minimum torsion and the maximum area under the force-displacement curve and the displacement ductility ratio.
Reference
[1] Sadek AW, Tso WK. (1989), "Strength eccentricity concept for
inelastic analysis of asymmetrical structures", Engineering Structure. 11: 189-194.
[2] Paulay T. (2000), "Understanding torsional phenomena in ductile
systems". Bulletin of the New Zealand Society for Earthquake Engineering. 33: 403–420.
[3] Paulay T. (1997), "Seismic torsional effects on ductile structural
wall systems", Journal of earthquake engineering, 1 (4) 721-745.
[4] Paulay T. (1998), "Torsional mechanism in ductile building
systems", Earthquake engineering and structural dynamics, 27 (10) 1101-1121.
[5] Myslimaj B. Tso WK. (2002), "A strength distribution criterion
for minimizing torsional response of asymmetric wall-type systems", Earthquake engineering and structural dynamics, 31: 99-120.
[6] Humar J, Yavari S, Saatcioglu M. (2003), "Design for forces
induced by seismic torsion", Canada journal civil engineering, Published on the NRC research 30. 10.1139/l02-029.
[7] National Building Code of Canada (NBCC). (1995), Associate
Committee on the national building code, National Research Council of Canada, Quebec.
[8] National Building Code of Canada (NBCC). (2005), "Associate
Committee on the National Building Code", National Research Council of Canada, Quebec.
[9] Zalka KA. (2010), "Torsional analysis of multi-storey building
structures under horizontal load". the structural design of tall and special buildings. DOI: 10.1002/tal.665.
[10] Kim J, Hong S. (2011), "Progressive collapse performance of
irregular buildings". The structural design of tall and special buildings 20: 721–734.
[11] Ravikumar CM, Babu Narayan KS, Sujith BV, Venkat Reddy D.
(2012), "Effect of Irregular Configurations on Seismic Vulnerability of RC Buildings". Journal of architectural research. 2(3) 20-26, DOI: 10.5923/j.arch.20120203.01.
[12] Gokdemir H, Ozbasaran H, Dogan M, Unluoglu E, Albayrak U.
(2013), "Effects of torsional irregularity to structures during earthquakes". Engineering Failure Analysis 35 713–717.
[13] Tarbali K, Shakeri K. (2014), "Story shear and torsional
moment-based pushover procedure for asymmetric-plan buildings using an adaptive capacity spectrum method". Engineering Structures, 79, 32-44.
[14] Georgoussis G. (2014), "Modified seismic analysis of
multistory asymmetric elastic buildings and suggestions for minimizing the rotational response". Earthquakes and Structures, An International Journal, 7(1): 039-52.
[15] Georgoussisa G, Tsompanosa A, Makarios T. (2015),
"Approximate seismic analysis of multi-story buildings with mass and stiffness irregularities". Procedia Engineering 125: 959 – 966.
[16] Bahmani P, van de Lindt J, and Dao T. (2014),
"Displacement-based design of buildings with torsion: theory and verification", Journal of structural engineering. 10.1061/ (ASCE) ST.1943-541X.0000896.
[17] American Society of Civil Engineers (ASCE). (2016),
"Minimum Design Loads for Buildings and Other Structures", ASCE ISEI 7-16.
[18] Kheyroddin A. Aramesh S. (2015), "Lateral Resisting Systems
in Tall Buildings". Semnan University Press (In Persian).
[19] Han SW, Kim T, Kim DH, Baek SJ. (2017), "Seismic collapse
performance of special moment steel frames with torsional irregularities". Engineering Structures 141, 482–494.
[20] ETABS 2013. Version 13.1.1(2013), Extended 3-D Analysis
of Building Systems, Computers and Structures, Inc., Berkeley.
[21] American Institute of Steel Construction (AISC). (2016),
“Load and resistance factor design specification for structural steel buildings“. Chicago (IL).
[22] Shatarat NK, Symans MD, McLean DI, Cofer WF. (2007), Evaluation of displacement-Based Methods and Computer Software for Seismic Analysis of Highway Bridges, Engineering Structures. 30 1335- 1345.
[23] ASCE 41-13, American Society of Civil Engineers. (2013),
“Seismic evaluation and retrofit of existing buildings“, public comment draft, Reston, VA.
![Fig. 1: Example buildings with triangular plan [18].](https://thumb-us.123doks.com/thumbv2/123dok_us/8942506.1851874/2.595.144.440.595.720/fig-example-buildings-with-triangular-plan.webp)

![Table 7. Summarizes different types of the horizontal irregularities in accordance with the ASCE-7-16 [4]](https://thumb-us.123doks.com/thumbv2/123dok_us/8942506.1851874/13.595.109.503.464.608/table-summarizes-different-types-horizontal-irregularities-accordance-asce.webp)
![Fig. 16: Generalized force-deformation curve for frame elements [23].](https://thumb-us.123doks.com/thumbv2/123dok_us/8942506.1851874/14.595.72.513.339.740/fig-generalized-force-deformation-curve-frame-elements.webp)
![Fig. 19: Idealized force-displacement curves [23].](https://thumb-us.123doks.com/thumbv2/123dok_us/8942506.1851874/16.595.323.516.335.405/fig-idealized-force-displacement-curves.webp)
