R E S E A R C H
Open Access
Mapping of equine mesenchymal stromal
cell surface proteomes for identification of
specific markers using proteomics and
gene expression analysis: an in vitro
cross-sectional study
Louise Bundgaard
1*, Allan Stensballe
2, Kirstine Juul Elbæk
2and Lise Charlotte Berg
1Abstract
Background:Stem cells have great potential for tissue regeneration, but before stem cell populations can be used in the clinic, it is crucial that the stem cells have been definitely characterized by a set of specific markers. Although there have been attempts to identify a set of immunophenotypic markers to characterize equine mesenchymal stromal cells (MSCs), immunophenotyping of equine MSCs is still challenging due to the limited availability of suitable antibodies of high quality and consistent performance across different laboratories. The aim of this study was to evaluate a strategy for mapping the equine MSCs surface proteome by use of biotin-enrichment and mass spectrometry (MS) analysis and mine the proteome for potential equine MSCs surface markers belonging to the cluster of differentiation protein group. Gene expression analysis was used for verification.
Methods:Equine MSCs derived from bone marrow (BM) (n= 3) and adipose tissue (AT) (n= 3) were expanded to
P3 and either used for (1) cell differentiation into mesodermal lineages (chondrogenic and osteogenic), (2) enrichment of the MSCs surface proteins by biotinylation followed by in-gel digest of the isolated proteins and nanoLC-MS/MS analysis to unravel the enriched cell surface proteome, and (3) RNA isolation and quantitative real-time reverse transcriptase PCR analysis of the CD29, CD44, CD90, CD105, CD166, CD34, CD45, and CD79a gene expression.
Results:A total of 1239 proteins at 1% FDR were identified by MS analysis of the enriched MSCs surface protein samples. Of these proteins, 939 were identified in all six biological samples. The identified proteins included 19 proteins appointed to the cluster of differentiation classification system as potential cell surface targets. The protein and gene expression pattern was positive for the commonly used positive MSCs markers CD29, CD44, CD90, CD105, and CD166, and lacked the negative MSCs markers CD34, CD45, and CD79a.
Conclusions:The findings of this study show that enrichment of the MSCs surface proteome by biotinylation followed by MS analysis is a valuable alternative to immunophenotyping of surface markers, when suitable antibodies are not available. Further, they support gene expression analysis as a valuable control analysis to verify the data.
Keywords:Mesenchymal stromal cells, CD surface markers, Biotinylation, Mass spectrometry, Gene expression, Equine
* Correspondence:[email protected]
1Department of Veterinary Clinical Sciences, University of Copenhagen, Agrovej 8, DK-2630 Taastrup, Denmark
Full list of author information is available at the end of the article
Background
Similar to humans, the horse is a long-lived athletic species, and regenerative medicine is seen as the next-generation treatment to restore normal function of cells and tissues damaged by time, injury or disease. Stem cells have great potential for tissue repair and regeneration; that is why, they are intensely investigated in equine clinical research [1, 2]. However, before any type of stem cell can be applied in practice, it is crucial that the isolated stem cells have been definitively characterized by a set of specific functional or phenotypic markers.
A common definition of equine mesenchymal stromal cells (MSCs) is still lacking, but in humans, characterization of these cells is well defined by the criteria of the International Society for Cellular Therapy (ISCT) [3]. ISCT has stated that MSCs must be plastic adherent and be capable of differentiating toward the osteogenic, chondrogenic, and adipogenic lineage. Furthermore, they must express CD29, CD44, CD73, CD90, and CD105 and lack expression of CD14, CD34, CD45, CD79a, and MHC II. Although there have been attempts to identify a set of immunophenotypic markers to characterize equine MSCs [4–6], immunophenotyping of equine MSCs is still challenging due to the limited avail-ability of suitable antibodies of high quality and consistent performance across different laboratories [5, 7]. Radcliffe et al. [5] found that only 4 of 15 antibodies tested (27%) were reactive to equine molecules using flow cytometry analysis. De Schauwer et al. [7] found that 11 out of 30 antibodies (37%) were reactive to equine molecules, and they were not able to confirm cross-reactivity of two tested clones used in other studies to characterize equine MSCs. In general, cross-reactivity for antihuman mono-clonal antibodies to equine epitopes is limited. In a large test of 379 antihuman monoclonal antibodies, only 14 rec-ognized the corresponding epitopes on isolated equine leukocytes, which is less than 5% [8]. This illustrates the need for studies evaluating alternative methods for identification of MSCs markers.
Mass spectrometry (MS) is a rapidly advancing tech-nology for identification and quantification of proteins applicable to stem cell investigation [9], thus circum-venting the need of antibodies for cell phenotyping. This analysis technology in combination with cell surface protein biotinylation to enrich the plasma membrane proteins has successfully been used for comprehensive analysis of cell surface proteomes, e.g., to identify spermatozoa surface proteins and quantitative changes during epididymal maturation in boars [10] and bulls [11], and to identify surface proteins of human dental pulp stem cells and their variation between culture conditions [12]. Furthermore, this approach has been used for comprehensive analysis of the human BM-MSCs surface proteome [13,14].
Gene expression analysis at the mRNA level is another potentially valuable alternative to antibody-based methods, and compared to MS, which is still only accessible at spe-cialized proteomic core facilities, qPCR analysis is available in most laboratories.
The aim of this study was to analyze and compare the equine adipose tissue (AT)-derived and bone marrow (BM)-derived MSCs surface proteome by use of biotin enrichment and MS analysis and mine the proteomes for potential equine MSCs surface markers appointed to the cluster of differentiation (CD) classification system. Gene expression analysis was used to verify the results.
Methods
The experimental protocol was approved by the Ethics and Welfare Committee of Department of Veterinary Clinical Sciences, University of Copenhagen, Denmark.
Animals used in the study
MSCs derived from BM (n= 3) and AT (n= 3) were obtained from mares of mixed breeds, weighing approx. 500 kg and ranging from 13 to 17 years. The horses were euthanized with captive bolt and exsanguination at the Large Animal Teaching Hospital, University of Copenhagen, for unrelated reasons.
Sampling of bone marrow and adipose tissue
BM-MSCs were isolated from sternal BM aspirates. The skin over the sternum was surgically prepared immediately post-euthanasia in a routine manner, and 5–7 mL BM was aspirated using a Jamshidi biopsy needle (11 gauge, 12.7 cm) (Stryker, Kalamazoo, MI, USA) in a 20-mL syringe preloaded with 1 mL 10% 0.109 M trisodium citrate. The aspirate was trans-ferred to a 50-mL falcon tube and inverted gently.
AT-MSCs were isolated from adipose tissue from the region above the biceps femoris muscle at the base of the tail. The skin was surgically prepared immediately post-euthanasia in a routine manner, and a 10 cm × 10 cm piece of epidermis and dermis was removed to expose the subcutaneous AT. Approximately 15 g of AT was harvested, avoiding fascia and blood vessels and transferred to a 50-mL falcon tube with 30 mL sterile PBS.
All samples were transported at room temperature to the laboratory immediately and further processed within ~ 1 h after sampling.
Isolation of mesenchymal stromal cells
supernatant was discarded, and the cell pellet resuspended in 24 mL expansion medium (EM) (Dulbecco’s modified Eagle’s medium (DMEM) 1 g/L glucose, with phenol red, GlutaMAX, and pyruvate (Thermo Fischer Scientific, Waltham, MA, USA) supple-mented with 10% (v/v) fetal bovine serum (FBS) (Thermo Fischer Scientific, Waltham, MA, USA), 100 U/mL penicillin and 100 μg/mL streptomycin (Thermo Fischer Scientific, Waltham, MA, USA), and 25μg/mL amphotericin B (Thermo Fischer Scientific, Waltham, MA, USA)). The cells were distributed equally in two T75 cm2 culture flasks and cultured at 37 °C in a humidified atmosphere containing 5% CO2.
AT was washed three times in sterile PBS, dissected to smaller pieces, and digested in sterile filtered (0.2 μm) (Sartorius, Goettingen, Germany) enzyme medium (DMEM 1 g glucose/L, with phenol red, Glu-taMAX, and pyruvate, supplemented with 100 U/mL penicillin and 100 μg/mL streptomycin, 50 μg/mL gentamycin (Sigma-Aldrich, St. Louis, MI, USA), and 1 mg/mL collagenase type I (Thermo Fischer Scientific, Waltham, MA, USA)) for 3 h at 37 °C and 30 rpm. Re-leased cells were isolated through a cell strainer (70μm) (Thermo Fischer Scientific, Waltham, MA, USA), rinsed twice in sterile PBS, supernatant discarded, and the cell pellet resuspended in 24 mL EM supplemented with 50μg/mL gentamycin. The cells were distributed equally in two T75 cm2culture flasks and cultured at 37 °C in a humidified atmosphere containing 5% CO2.
After overnight incubation, non-adherent cells were removed and fresh medium added. Medium was chan-ged every 2–3 days. Cells were passaged (P1) at ~ 80% confluency (10–12 days) using trypsin-EDTA (0.25%) (Thermo Fischer Scientific, Waltham, MA, USA), replat-ing ratio 1:3. P1 cells were further expanded in EM without amphotericin B, supplemented with 50 μg/mL gentamycin (only AT-MSCs). At 80% confluency (8– 10 days), cells were detached with trypsin-EDTA, rinsed in sterile PBS, counted, and cryopreserved in FBS supple-mented with 10% dimethyl sulfoxide (Sigma-Aldrich, St. Louis, MI, USA) in 1–2 × 10⁶ aliquots. Cryopreserved MSCs (~ 2 × 10⁶cells) were thawed (P2) and expanded in two T75 cm2 flasks in EM without amphotericin B, supplemented with 50 μg/mL gentamycin (only AT-MSCs). At ~ 90% confluency (10–12 days), the cells were passaged using trypsin-EDTA (0.25%) and replated in ratio 1:3 (P3). P3 cells at ~ 90% confluency (5–6 days) were either used for cell differentiation into mesodermal lineages (chondrogenic and osteogenic), biotinylation of cell surface proteins, or RNA isolation.
Cell differentiation into mesodermal lineages
Cells were passaged (P4) to 48-well plates at a density of ~ 103 cells/well (9090 cells/cm2) and expanded in
EM without amphotericin B, supplemented with 50μg/mL gentamycin (only AT-MSCs). At ~ 80% confluency, cells were washed with sterile PBS and medium was changed to chondrogenic differentiation medium (DMEM 4.5 g/L glucose, without phenol red, supplemented with 1% (v/v) GlutaMAX (Thermo Fischer Scientific, Waltham, MA, USA), 1% (v/v) pyruvate (Thermo Fischer Scientific, Waltham, MA, USA), 2% (v/v) FBS, 1% (v/v) insulin-transferrin-selenium (ITS) (Thermo Fischer Scientific, Waltham, MA, USA), 100 U/mL penicillin and 100 μg/mL streptomycin, 10−7 M dexamethasone (Sigma-Aldrich, St. Louis, MI, USA), 50 μg/mL ascorbic acid (L-ascorbic acid 2-phosphate) (Sigma-Aldrich, St. Louis, MI, USA), 10 ng/mL TGF-ß3 (recombinant human TGF-ß3) (R&D Systems, Inc., Minneapolis, MI, USA), and 50 μg/mL gentamycin (only AT-MSCs)) or osteogenic differentiation medium (DMEM 1 g/L glucose, without phenol red, supplemented with 1% (v/v) pyruvate (Thermo Fischer Scientific, Waltham, MA, USA), 2% (v/v) FBS, 1% (v/v) ITS, 100 U/mL penicillin and 100 μg/mL streptomycin, 10−7M dexamethasone, 50μg/mL ascorbic acid (L-ascorbic acid 2-phosphate), 10μL/mL 1 M ß-glyc-erophosphate (ß-glycß-glyc-erophosphate, disodium salt, penta-hydrate) (Merck KGaA, Darmstadt, Germany), and 50 μg/mL gentamycin (only AT-MSCs). Differentiation medium was changed every 3 days for 21 days. Con-firmation of chondrogenic and osteogenic differenti-ation was performed by staining for proteoglycans in the extracellular matrix using 0.1% Safranin O, pH 4.6 (Merck KGaA, Darmstadt, Germany) and calcified extracellular matrix deposits using 2% Alizarin red staining, pH 4.2 (Sigma-Aldrich, St. Louis, MI, USA), respectively.
Mesenchymal stromal cell surface biotinylation
then centrifuged for 1 min at 1000g. The column was washed with wash buffer supplemented with protease inhibitor (25:1 (v/v)), and centrifuged for 1 min at 1000g. This step was repeated three times. A 4× Laemmli sample buffer (Bio-Rad Laboratories, Inc., Hercules, CA, USA) with 50 mM dithiothreitol was added to the column, and the reaction was incubated for 60 min at RT on a rocking platform followed by centrifugation for 2 min at 1000 g. The eluate was stored at −80 °C until further processing.
SDS-PAGE and in-gel digestion of biotinylated cell surface proteins
Samples were thawed on ice and the proteins in 25 μL 4× Laemmli buffer were reduced by heating for 7 min at 95 °C, and further processed by SDS-PAGE (10 well, mini protean TGX gel 4–20%) (Bio-Rad Laboratories, Inc., Hercules, CA, USA) at 180 V for 10 min, to remove lithium dodecyl sulphate from the sample and separate proteins according to molecular weight allowing the proteins to penetrate the resolving gel for approx. 1 cm. After staining with coomassie blue (Sigma-Aldrich, St. Louis, MI, USA), the visible band was excised into small cubes and transferred to individual 1.5 mL microcen-trifuge tubes. The gel pieces were washed with 50 mM triethylammonium bicarbonate buffer (TEAB) (Sigma-Aldrich, St. Louis, MI, USA) for 15 min at RT, followed by addition of acetonitrile (Honeywell-Fluka, Morris Plains, NJ, US) in a 1:1 solution with TEAB and incubation for 15 min at RT, removing of all liquids and shrinking of the gel pieces with acetonitrile. These wash-ing steps were repeated four times. Proteins in the gel pieces were reduced and alkylated by incubation with 1.2μL 0.5 M tris (2-carboxyethyl)phosphine hydrochlorid (Sigma-Aldrich, St. Louis, MI, USA) per 50μL TEAB and 6 μL 0.5 M chloroacetamide (Sigma-Aldrich, St. Louis, MI, USA) per 50μL TEAB for 30 min at 37 °C followed by a fifth washing sequence. Proteins were digested with 12.5 ng trypsin (Thermo Fischer Scientific, Waltham, MA, USA)/μL TEAB at 37 °C overnight, and the supernatant containing the extracted peptides was transferred to a fresh microcentrifuge tube. The gel pieces were then incubated in 1:20 (v/v) formic acid (Honeywell-Fluka, Morris Plains, NJ, USA) in TEAB for 15 min at RT, the supernatant added to the peptide solution, the gel pieces incubated in acetonitrile for 15 min at RT, and the super-natant transferred to the peptide solution. The peptides were concentrated in a vacuum centrifuge and stored at− 80 °C until further processing.
LC-MS/MS analysis
Peptides were resuspended in resuspension buffer (2% acetonitrile, 0.1% triflouroacetic acid (Thermo Fischer Scientific, Waltham, MA, USA), 0.1% formic acid in
MilliQ water) and a volume corresponding to ~ 1 μg peptide was analyzed by nanoLC-MS/MS (Thermo Scientific Dionex Ultimate 3000 RSLC) coupled in-line to a Thermo Scientific Q Exactive HF mass spectro-meter. The peptide separation was accomplished using a precolumn setup (Acclaim PepMap 100 C18 2 cm 100 μm precolumn; 75 μm 75 cm main column) (Thermo Fischer Scientific, Waltham, MA, USA) and a 35-min gradient from 10% buffer B (99.9% acetonitrile) to 35% buffer B and the buffer A being 99.1% MilliQ with 0.1% formic acid. The mass spectrometer was set to acquire MS1 data from m/z 375–1500 at R= 60 k and MS2 at R= 30 k allowing up to 20 precursor ions per MS1 scan.
RNA isolation and quantitative real-time reverse transcriptase PCR analysis
Cells were lysed in TRI Reagent (Molecular Research Center, Inc., Cincinnati, OH, USA) and stored at−80 °C until further processing. After thawing, the cell lysate was further homogenized through a QIAshredder col-umn (Qiagen, Hilden, Germany) for 2 min at 12,000 g. The homogenate was phase separated by adding 0.2 mL chloroform per mL TRI Reagent, shaked vigorously for 15 s allowing it to stand for 15 min at RT, and centri-fuged at 12,000 g for 15 min at 4 °C. The upper phase containing the RNA was transferred to a fresh tube. The RNA was precipitated by adding 0.5 mL 2-propanol per mL TRI Reagent, incubation for 8 min at RT, followed by centrifugation at 12,000 g for 8 min at 4 °C. After removing the supernatant, the RNA pellet was washed by adding 1 mL 75% ethanol per 1 mL TRI Reagent and centrifugation at 7500 g for 5 min at 4 °C. The supernatant was removed, and the pellet was air dried for 5–7 min. The pellet was resuspended in distilled water and incubated for 15 min at 60 °C. Total RNA concentration was determined by optical density measurement (NanoDrop TM Spectrophotometer (Thermo Fischer Scientific, Waltham, MA, USA)), and total RNA isolates were kept at −80 °C until further processing.
Waltham, MA, USA) at 25 °C for 10 min, 42 °C for 60 min, and 95 °C for 5 min. Samples were stored at− 20 °C.
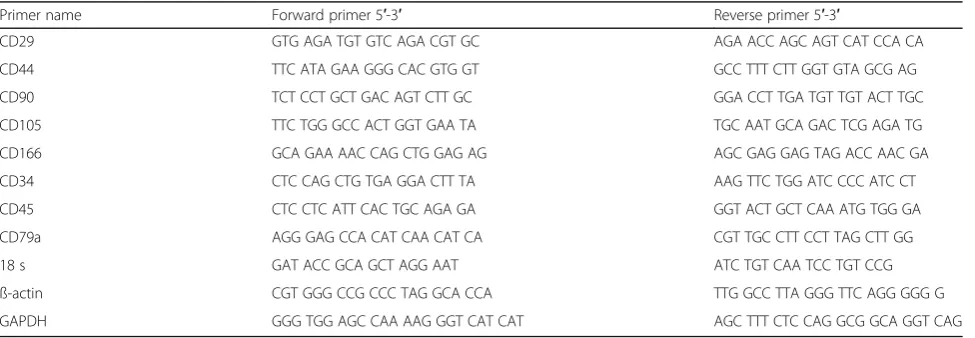
Species-specific intron-spanning equine primers were used to amplify CD29, CD44, CD90, CD105, CD166, CD34, CD45, and CD79a. Primers are listed in Table 1. Primers were purchased from TAG Copenhagen (Copenhagen, Denmark). Quantitative real-time reverse transcriptase PCR was performed in triplicates using the LightCycler® Fast Start DNA Master SYBR Green I and LightCycler® Real-Time PCR System (Roche, Basel, Switzerland). cDNA from equine spleen was used as a positive control.
Data analysis
Raw data was searched against theEquus caballus refer-ence sequrefer-ence database from Uniprot (UP000002281; May 16, 2017; 22,698 proteins) using MaxQuant search engines (MaxQuant v.1.6.0.1 and Perseus v.1.6.0.2). Label-free quantification (LFQ) was based on total ion chromatogram normalization [15]. The online database STRING-DB was used to further identify uncharacter-ized proteins based on gene [16]. Only proteins with at least two unique peptide sequences and FDR < 1% was included. The MS proteomics data have been deposited and made publically available to the ProteomeXchange Consortium via the PRIDE partner repository with the dataset identifier PXD008884 [17].
Relative mRNA expression was calculated using the efficiency corrected calculation method also known as the Roche Applied Sciences E(efficiency)-method: Normalized relative ratio (NRR) = EtCT (target calibrator)–CT (target sample)
/ErCT (reference calibrator)–CT (reference sample). All results were normalized to the reference gene gluceraldehyde-3-phosphate dehydrogenase (GAPDH) selected after initial testing of three reference genes (GAPDH,β-actin and ribosomal RNA (18 S)) [18].
Results
Cellular morphology and differentiation into mesodermal linages
All cell lines were plastic adherent and exhibited a fibroblast-like morphology. Chondrogenic differentiated cells stained positive for proteoglycans in the extracellu-lar matrix and osteogenic differentiated cells stained positive for calcified extracellular matrix deposits on day 21 after induction of differentiation.
MS analysis
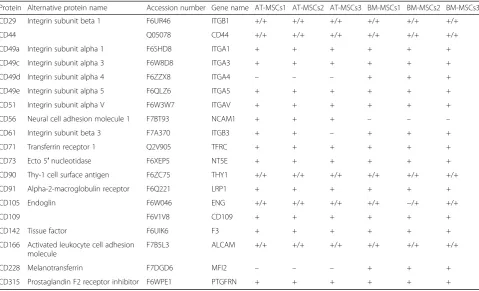
A total of 1239 proteins were identified with at least two unique peptide sequences and FDR < 1%. Among the identified proteins were a total of 19 proteins appointed to the CD classification system as potential cell surface targets for immunophenotyping of cells (Tables2and3). The CD proteins were identified in all samples, except CD49c and CD228, which were not identified in the samples from AT-MSCs; CD61, which was not identified in one of the samples from AT-MSCs; CD56, which was not identified in any of the BM-MSCs samples; and CD105, which was not identified in one of the samples from BM-MSCs.
The protein and gene expression pattern for selected MSCs markers
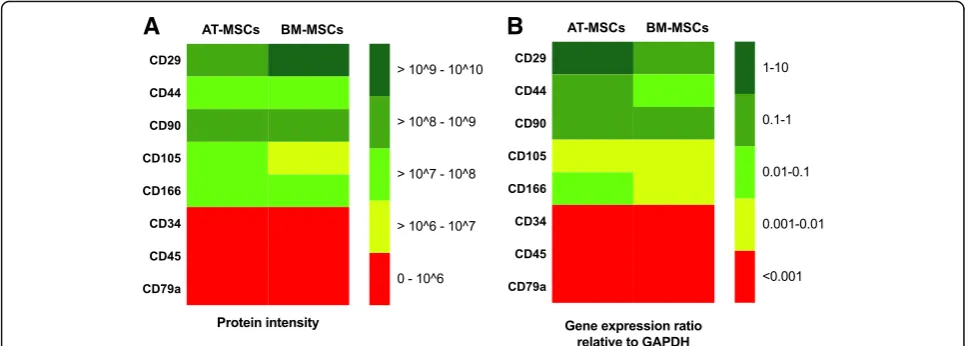
The protein and gene expression pattern was measured for the commonly used positive MSCs markers CD29, CD44, CD90, CD105, and CD166, and negative MSCs markers CD34, CD45, and CD79a.
The mean label-free quantification (LFQ) intensity was above 107 for CD29, CD44, CD90, and CD166, with a higher mean LFQ intensity in samples from AT-MSCs compared to BM-MSCs, except for CD29 where the LFQ intensity was higher in the samples from BM-MSCs (Fig. 1a). The cell surface protein CD105 was identified in all AT-MSCs samples, but only in two of the three BM-MSCs samples. The LFQ intensity ranged from
Table 1Species-specific primers used to amplify specific genes
Primer name Forward primer 5′-3′ Reverse primer 5′-3′
CD29 GTG AGA TGT GTC AGA CGT GC AGA ACC AGC AGT CAT CCA CA
CD44 TTC ATA GAA GGG CAC GTG GT GCC TTT CTT GGT GTA GCG AG
CD90 TCT CCT GCT GAC AGT CTT GC GGA CCT TGA TGT TGT ACT TGC
CD105 TTC TGG GCC ACT GGT GAA TA TGC AAT GCA GAC TCG AGA TG
CD166 GCA GAA AAC CAG CTG GAG AG AGC GAG GAG TAG ACC AAC GA
CD34 CTC CAG CTG TGA GGA CTT TA AAG TTC TGG ATC CCC ATC CT
CD45 CTC CTC ATT CAC TGC AGA GA GGT ACT GCT CAA ATG TGG GA
CD79a AGG GAG CCA CAT CAA CAT CA CGT TGC CTT CCT TAG CTT GG
18 s GAT ACC GCA GCT AGG AAT ATC TGT CAA TCC TGT CCG
ß-actin CGT GGG CCG CCC TAG GCA CCA TTG GCC TTA GGG TTC AGG GGG G
4.2 × 10⁶–1.7 × 10⁷ (Fig. 1a). The cell surface proteins CD34, CD45, and CD79a were not identified in any of the samples (Fig.1a).
The relative gene expression ratio for CD29, CD44, and CD90 ranged from 0.06 to 3.14, and for CD105 and CD166, the relative gene expression ratio ranged from 0.002 to 0.014 except for one AT-MSCs sample, where the relative gene expression ratio for CD166 was 0.15. The mean relative gene expression ratios for CD29, CD44, CD90, CD105, and CD166 were higher in AT-MSCs samples compared to BM-MSCs samples. The relative gene expression ratios for CD34, CD45, and CD79a were < 0.0003 in all AT-MSCs and BM-MSCs samples and > 0.05 in the positive control samples.
Discussion
This is the first study in the horse, where the cell surface proteomes of AT-MSCs and BM-MSCs have been analyzed by use of biotinylation of the intact cells to enrich the plasma membrane proteins followed by MS for identification of the proteins with high confidence. This pipeline revealed identification of 1239 proteins including 19 CD markers.
Enrichment procedures like biotinylation aim to increase the relative abundance of proteins of interest, but all accessible proteins in the sample will be labeled with biotin, including intracellular proteins released due to cell death and extracellular proteins. However, the enrichment strategy in this study was considered successful, because the relative number of CD markers compared to the total number of identified proteins was markedly higher than the relative number of CD markers identified in a comparable MS study of equine umbilical cord MSCs without enrichment of the cell surface proteins [19]. Here, a total of 2118 proteins was identified of which only 14 proteins were assigned as CD markers [19].
The 19 identified CD markers included CD29, CD44, CD51, CD71, CD73, CD90, CD105, and CD166, which have also been identified as equine stem cell surface proteins in previous studies [5, 7, 19–21]. CD29, CD44, CD73, CD90, and CD105 are the five positive surface markers included in the ISCT criteria of human MSCs. However, in studies of equine stem cell surface proteins, only CD29 has been robustly positive in equine stem cells, while CD44, CD73, CD90, and CD105 have been identified
Table 2Identified genes and/or proteins appointed to the cluster of differentiation (CD) classification system
Protein Alternative protein name Accession number Gene name AT-MSCs1 AT-MSCs2 AT-MSCs3 BM-MSCs1 BM-MSCs2 BM-MSCs3
CD29 Integrin subunit beta 1 F6UR46 ITGB1 +/+ +/+ +/+ +/+ +/+ +/+
CD44 Q05078 CD44 +/+ +/+ +/+ +/+ +/+ +/+
CD49a Integrin subunit alpha 1 F6SHD8 ITGA1 + + + + + +
CD49c Integrin subunit alpha 3 F6W8D8 ITGA3 + + + + + +
CD49d Integrin subunit alpha 4 F6ZZX8 ITGA4 – – – + + +
CD49e Integrin subunit alpha 5 F6QLZ6 ITGA5 + + + + + +
CD51 Integrin subunit alpha V F6W3W7 ITGAV + + + + + +
CD56 Neural cell adhesion molecule 1 F7BT93 NCAM1 + + + – – –
CD61 Integrin subunit beta 3 F7A370 ITGB3 + + – + + +
CD71 Transferrin receptor 1 Q2V905 TFRC + + + + + +
CD73 Ecto 5′nucleotidase F6XEP5 NT5E + + + + + +
CD90 Thy-1 cell surface antigen F6ZC75 THY1 +/+ +/+ +/+ +/+ +/+ +/+
CD91 Alpha-2-macroglobulin receptor F6Q221 LRP1 + + + + + +
CD105 Endoglin F6W046 ENG +/+ +/+ +/+ +/+ −/+ +/+
CD109 F6V1V8 CD109 + + + + + +
CD142 Tissue factor F6UIK6 F3 + + + + + +
CD166 Activated leukocyte cell adhesion molecule
F7B5L3 ALCAM +/+ +/+ +/+ +/+ +/+ +/+
CD228 Melanotransferrin F7DGD6 MFI2 – – – + + +
CD315 Prostaglandin F2 receptor inhibitor F6WPE1 PTGFRN + + + + + +
Cells are isolated from samples harvested from three different horses (1–3). The cell surface proteins were enriched with biotinylation, and the samples analyzed by mass spectrometry. Raw data was searched against theEquus caballusreference sequence database from Uniprot (UP000002281; May 16, 2017; 22,698 proteins) giving information about protein names, accession numbers, and gene names. Gene expression was used to verify the data. (+) indicates that the protein was identified in the sample, (−) indicates that the protein was not identified in the sample. (+/+) indicates identification both on the protein and gene level. (−/+) indicates no identification on the protein level, but identification on the gene level
with different expression patterns [5, 7, 19, 21, 22]. The inconsistent findings of CD105 on the surface of equine stem cells [7,21,22] were supported by the observations in this study, but the other four human ISCT-positive surface markers were identified with high confidence.
CD51 has been identified on the surface of MSCs derived from equine peripheral blood and AT [20] and CD71 in the proteome from MSCs derived from equine umbilical cord [19]. CD51 is known to be an endothelial cell marker and has been shown to be upregulated in mouse BM-MSCs during osteoblastic differentiation, suggesting a putative role in osteogenesis [20]. The role of CD51 and CD71 in equine MSCs is not clearly known, and further studies are required to establish them as stem
cell markers. Stem cells should lack expression of CD45, CD34, and CD79a, and these proteins were not observed in the MS analysis of the enriched MSCs samples. Equine CD34 and CD45 have been identified in a previous com-prehensive MS analysis of different equine tissues and body fluids [23], showing that the proteins can be identi-fied using MS. Since CD34 and CD45 were not identiidenti-fied in this study, our findings support their capacity as true negative identifiers. To our knowledge, equine CD79a has never been identified by MS analysis. Identification of this protein in another cell type is needed to confirm that this is a true negative identifier for MSCs in MS studies.
Multiple factors have been suggested to explain the variable expression pattern of equine stem cell surface
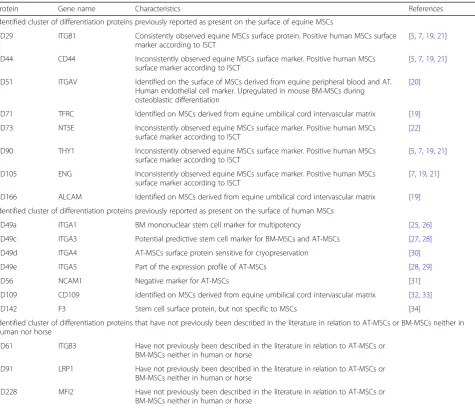
Table 3Cluster of differentiation proteins (CD) identified in equine AT-MSCs and/or equine BM-MSCs and their characteristics in relation to AT-MSCs and BM-MSCs described in the literature
Protein Gene name Characteristics References
Identified cluster of differentiation proteins previously reported as present on the surface of equine MSCs
CD29 ITGB1 Consistently observed equine MSCs surface protein. Positive human MSCs surface marker according to ISCT
[5,7,19,21]
CD44 CD44 Inconsistently observed equine MSCs surface marker. Positive human MSCs surface marker according to ISCT
[5,7,19,21]
CD51 ITGAV Identified on the surface of MSCs derived from equine peripheral blood and AT. Human endothelial cell marker. Upregulated in mouse BM-MSCs during osteoblastic differentiation
[20]
CD71 TFRC Identified on MSCs derived from equine umbilical cord intervascular matrix [19]
CD73 NT5E Inconsistently observed equine MSCs surface marker. Positive human MSCs surface marker according to ISCT
[22]
CD90 THY1 Inconsistently observed equine MSCs surface marker. Positive human MSCs surface marker according to ISCT
[5,7,19,21]
CD105 ENG Inconsistently observed equine MSCs surface marker. Positive human MSCs surface marker according to ISCT
[7,19,21]
CD166 ALCAM Identified on MSCs derived from equine umbilical cord intervascular matrix [19]
Identified cluster of differentiation proteins previously reported as present on the surface of human MSCs
CD49a ITGA1 BM mononuclear stem cell marker for multipotency [25,26]
CD49c ITGA3 Potential predictive stem cell marker for BM-MSCs and AT-MSCs [27,28]
CD49d ITGA4 AT-MSCs surface protein sensitive for cryopreservation [30]
CD49e ITGA5 Part of the expression profile of AT-MSCs [28,29]
CD56 NCAM1 Negative marker for AT-MSCs [31]
CD109 CD109 Identified on MSCs derived from equine umbilical cord intervascular matrix [32,33]
CD142 F3 Stem cell surface protein, but not specific to MSCs [34]
Identified cluster of differentiation proteins that have not previously been described in the literature in relation to AT-MSCs or BM-MSCs neither in human nor horse
CD61 ITGB3 Have not previously been described in the literature in relation to AT-MSCs or BM-MSCs neither in human or horse
CD91 LRP1 Have not previously been described in the literature in relation to AT-MSCs or BM-MSCs neither in human or horse
CD228 MFI2 Have not previously been described in the literature in relation to AT-MSCs or BM-MSCs neither in human or horse
CD315 PTGFRN Have not previously described in the literature studied in relation to AT-MSCs or BM-MSCs neither in human or horse
markers, for example differences in culture conditions and timeframes [5], distinct surface antigens for MSCs of different origin [22], and even individual differences between donors [22]. Another challenge often encoun-tered in equine research is the lack of suitable antibodies of high quality and consistent performance across differ-ent laboratories [5, 7]. In this study, we employed two technologies that do not rely on antibodies as alterna-tives to immunophenotyping: MS to identify relevant proteins, and qPCR to identify relevant genes. Mass spectrometry has the advantage of identifying the markers at protein and peptide level being independent of protein antibodies for specific identification [23,24]. However, this technology is still reserved for specialized proteomic core facilities, and its applicability for more general use is therefore limited. qPCR is a more commonly available technology. Radcliffe et al. [5] studied the temporal expression of CD29, CD44, CD90, CD11a/CD18, and CD45RB, both at the mRNA and protein level. They found that at all culture points tested, the gene mRNA expression followed the same pattern as the cellular protein expression. The uniformity between mRNA and protein expression patterns was supported by the observations of this study in terms of both expression pattern and positive and negative identifiers. Taken together, the results of these studies emphasize that gene expression analysis on mRNA might be of great value for identification of equine MSCs and as a method to verify findings on protein level, especially when suitable antibodies are lacking.
To our knowledge, this is the first study to identify CD49a, CD49c, CD49d, CD49e, CD56, CD61, CD91, CD109, CD142, CD166, CD228, and CD315 in equine
MSCs. The majority of these proteins have been re-ported to be present on the surface of human AT-MSCs and BM-MSCs. In humans, CD49a proved useful as a positive marker for the most multipotent cells from a heterogeneous pool of BM mononuclear stem cells [25]. However, selection for CD49a-positive cells in a AT-MSCs population showed only a minor advantage to reduce heterogeneity [26]. In an attempt to identify chondrogenic potency predictors prior to chondrogenic differentiation of human BM-MSCs and AT-MSCs, it was demonstrated that CD49c was positively associated with GAG quantitation [27]. In another study of human BM-MSCs, the expression level of CD49c and CD49e was found to decrease after induction of chondrogenic differentiation in the presence of TGF-ß3 [28], which suggests that CD49c may be a predictive stem cell marker in humans. CD49e has also been identified as part of the expression profile of human AT-MSCs al-though less than 28% of the cells were positive for this marker [29]. The expression of CD49d on human AT-MSCs was found to decrease after cryopreservation and thawing even though the immunophenotypic marker expression was largely preserved, and their multipotency was maintained [30]. We also observed a lack of CD49d in AT-MSCs, but further investigation is needed to state if this is related to the phenotype. CD56 was observed in all AT-MSCs samples from horses and absent in all BM-MSCs samples. Human AT-MSCs have shown a vari-able positivity for CD56, and it is generally considered a negative marker for human AT-MSCs [31]. The diverging results could be due to different biological characteristics of this protein across species. In humans, CD109 and CD142 have been identified as stem cell surface proteins,
A
B
but their presence has not been specific to the MSCs phenotype [32–34].
CD61, CD91, CD228, and CD315 have not previously been studied in relation to AT-MSCs and BM-MSCs ei-ther in human or horse. Furei-ther investigation and valid-ation will be needed to test the immunological characterization of these proteins in the horse and deter-mine their value as equine MSCs surface markers.
Conclusions
In conclusion, the findings of this study show that enrichment of the MSCs surface proteome by biotinyl-ation followed by MS analysis is a valuable alternative to immunophenotyping of surface markers, when suitable antibodies are not available. Furthermore, the method is very useful for mining of the cell surface proteome to identify potential additional equine stem cell markers. Furthermore, the results support using gene expression analysis to verify the data by another method, and as a valuable alternative to immunophenotyping for identifi-cation of specific MSCs markers.
Abbreviations
AT:Adipose tissue; BM: Bone marrow; CD: Cluster of differentiation; DMEM: Dulbecco’s modified Eagle’s medium; EM: Expansion medium; FBS: Fetal bovine serum; ISCT: International Society for Cellular Therapy; LFQ: Label free quantification; MS: Mass spectrometry; MSCs: Mesenchymal stromal cells; TEAB: Triethylammonium bicarbonate buffer
Funding
Funding was generously provided by Independent Research Fund Denmark (grant number FTP-1335-00133) to cover the project expenses. The Da-nish National Mass Spectrometry Platform for Functional Proteomics (PRO-MS), the Obel Family Foundation, and the Svend Andersen Founda-tion are acknowledged for grants to the analytical platform enabling parts of this study.
Availability of data and materials
The mass spectrometry proteomics data generated during the current study are available in the ProteomeXchange Consortium via the PRIDE partner repository with the dataset identifier PXD008884.
Authors’contributions
LB designed the study; harvested the MSCs; performed most of the work with the cell cultures, biotinylation, sample preparation for MS analysis, qPCR analysis, and the data interpretation; and wrote the manuscript. AS provided expert assistance with sample preparation for MS analysis, MS analysis, and data interpretation, and revised the manuscript. KJE assisted with optimization of the protocol for preparation of the samples for MS analysis, assisted with the MS analyses, and revised the manuscript. LCB designed the study, provided expert assistance with harvesting and culturing the MSCs and qPCR analysis of the MSCs gene expression, and revised the manuscript. All authors read and approved the final manuscript.
Ethics approval and consent to participate
The experimental protocol was approved by the Ethics and Welfare Committee of Department of Veterinary Clinical Sciences, University of Copenhagen, and all procedures were carried out according to the Danish Act on animal experiments.
Consent for publication
Not applicable.
Competing interests
The authors declare that they have no competing interests.
Publisher’s Note
Springer Nature remains neutral with regard to jurisdictional claims in published maps and institutional affiliations.
Author details
1Department of Veterinary Clinical Sciences, University of Copenhagen, Agrovej 8, DK-2630 Taastrup, Denmark.2Department of Health Science and Technology, Aalborg University, Fredrik Bajers Vej 7, 9220 Aalborg Ø, Denmark.
Received: 25 March 2018 Revised: 4 October 2018 Accepted: 8 October 2018
References
1. McIlwraith CW, Frisbie DD, Rodkey WG, Kisiday JD, Werpy NM, Kawcak CE, Steadman JR. Evaluation of intra-articular mesenchymal stem cells to augment healing of microfractured chondral defects. Arthroscopy. 2011;27:1552–61.
2. Ferris DJ, Frisbie DD, Kisiday JD, McIlwraith CW, Hague BA, Major MD, Schneider RK, Zubrod CJ, Kawcak CE, Goodrich LR. Clinical outcome after intra-articular administration of bone marrow derived mesenchymal stem cells in 33 horses with stifle injury. Vet Surg. 2014;43:255–65.
3. Dominici M, Le Blanc K, Mueller I, Slaper-Cortenbach I, Marini F, Krause D, Deans R, Keating A, Prockop D, Horwitz E. Minimal criteria for defining multipotent mesenchymal stromal cells. The International Society for Cellular Therapy position statement. Cytotherapy. 2006;8:315–7. 4. Guest DJ, Ousey JC, Smith MR. Defining the expression of marker genes in
equine mesenchymal stromal cells. Stem Cells Cloning. 2008;1:1–9. 5. Radcliffe CH, Flaminio MJ, Fortier LA. Temporal analysis of equine bone
marrow aspirate during establishment of putative mesenchymal progenitor cell populations. Stem Cells Dev. 2010;19:269–82.
6. De Schauwer C, Meyer E, Van de Walle GR, Van Soom A. Markers of stemness in equine mesenchymal stem cells: a plea for uniformity. Theriogenology. 2011;75:1431–43.
7. De Schauwer C, Piepers S, Van de Walle GR, Demeyere K, Hoogewijs MK, Govaere JL, Braeckmans K, Van Soom A, Meyer E. In search for cross-reactivity to immunophenotype equine mesenchymal stromal cells by multicolor flow cytometry. Cytometry A. 2012;81:312–23.
8. Ibrahim S, Saunders K, Kydd JH, Lunn DP, Steinbach F. Screening of anti-human leukocyte monoclonal antibodies for reactivity with equine leukocytes. Vet immunol immunop. 2007;119:63–80.
9. Riis S, Stensballe A, Emmersen J, Pennisi CP, Birkelund S, Zachar V, Fink T. Mass spectrometry analysis of adipose-derived stem cells reveals a significant effect of hypoxia on pathways regulating extracellular matrix. Stem Cell Res Ther. 2016;7:52.
10. Belleannee C, Belghazi M, Labas V, Teixeira-Gomes AP, Gatti JL, Dacheux JL, Dacheux F. Purification and identification of sperm surface proteins and changes during epididymal maturation. Proteomics. 2011;11:1952–64. 11. Kasvandik S, Sillaste G, Velthut-Meikas A, Mikelsaar AV, Hallap T, Padrik P,
Tenson T, Jaakma U, Koks S, Salumets A. Bovine sperm plasma membrane proteomics through biotinylation and subcellular enrichment. Proteomics. 2015;15:1906–20.
12. Niehage C, Karbanova J, Steenblock C, Corbeil D, Hoflack B. Cell surface proteome of dental pulp stem cells identified by label-free mass spectrometry. PLoS One. 2016;11:e0159824.
13. Niehage C, Steenblock C, Pursche T, Bornhauser M, Corbeil D, Hoflack B. The cell surface proteome of human mesenchymal stromal cells. PLoS One. 2011;6:5.
14. Lee SK, Kim JH, Kim SS, Kang T, Park NH, Kwon KH, Lee SS, Lee ZW, Suh-Kim H, Cho K, et al. Profiling and semiquantitative analysis of the cell surface proteome in human mesenchymal stem cells. Anal Bioanal Chem. 2013;405:5501–17.
15. Cox J, Hein MY, Luber CA, Paron I, Nagaraj N, Mann M. Accurate proteome-wide label-free quantification by delayed normalization and maximal peptide ratio extraction, termed MaxLFQ. Mol Cell Proteomics. 2014;13:2513–26.
17. Vizcaino JA, Csordas A, Del-Toro N, Dianes JA, Griss J, Lavidas I, Mayer G, Perez-Riverol Y, Reisinger F, Ternent T, et al. 2016 update of the PRIDE database and its related tools. Nucleic Acids Res. 2016;44:11033. 18. Andersen CL, Jensen JL, Orntoft TF. Normalization of real-time quantitative
reverse transcription-PCR data: a model-based variance estimation approach to identify genes suited for normalization, applied to bladder and colon cancer data sets. Cancer Res. 2004;64:5245–50.
19. Maia L, de Moraes CN, Dias MC, Martinez JB, Caballol AO, Testoni G, de Queiroz CM, Pena RD, Landim-Alvarenga FC, de Oliveira E. A proteomic study of mesenchymal stem cells from equine umbilical cord. Theriogenology. 2017;100:8–15.
20. Dhar M, Neilsen N, Beatty K, Eaker S, Adair H, Geiser D. Equine peripheral blood-derived mesenchymal stem cells: isolation, identification, trilineage differentiation and effect of hyperbaric oxygen treatment. Equine Vet J. 2012;44:600–5.
21. Ranera B, Lyahyai J, Romero A, Vazquez FJ, Remacha AR, Bernal ML, Zaragoza P, Rodellar C, Martin-Burriel I. Immunophenotype and gene expression profiles of cell surface markers of mesenchymal stem cells derived from equine bone marrow and adipose tissue. Vet Immunol Immunop. 2011;144:147–54.
22. Paebst F, Piehler D, Brehm W, Heller S, Schroeck C, Tarnok A, Burk J. Comparative immunophenotyping of equine multipotent mesenchymal stromal cells: an approach toward a standardized definition. Cytometry A. 2014;85:678–87.
23. Bundgaard L, Jacobsen S, Sorensen MA, Sun Z, Deutsch EW, Moritz RL, Bendixen E. The Equine PeptideAtlas - a resource for developing proteomics-based veterinary research. Proteomics. 2014;14:763–73. 24. Hesselager MO, Codrea MC, Sun Z, Deutsch EW, Bennike TB, Stensballe A,
Bundgaard L, Moritz RL, Bendixen E. The Pig PeptideAtlas: a resource for systems biology in animal production and biomedicine. Proteomics. 2016;16:634–44.
25. Rider DA, Nalathamby T, Nurcombe V, Cool SM. Selection using the alpha-1 integrin (CD49a) enhances the multipotentiality of the mesenchymal stem cell population from heterogeneous bone marrow stromal cells. J Mol Histol. 2007;38:449–58.
26. Griesche N, Luttmann W, Luttmann A, Stammermann T, Geiger H, Baer PC. A simple modification of the separation method reduces heterogeneity of adipose-derived stem cells. Cells Tissues Organs. 2010;192:106–15. 27. Garcia J, Mennan C, McCarthy HS, Roberts S, Richardson JB, Wright KT.
Chondrogenic potency analyses of donor-matched chondrocytes and mesenchymal stem cells derived from bone marrow, infrapatellar fat pad, and subcutaneous fat. Stem Cells Int. 2016;2016:6969726.
28. Lee HJ, Choi BH, Min BH, Park SR. Changes in surface markers of human mesenchymal stem cells during the chondrogenic differentiation and dedifferentiation processes in vitro. Arthritis Rheum. 2009;60:2325–32. 29. Gronthos S, Franklin DM, Leddy HA, Robey PG, Storms RW, Gimble JM.
Surface protein characterization of human adipose tissue-derived stromal cells. J Cell Physiol. 2001;189:54–63.
30. Irioda AC, Cassilha R, Zocche L, Francisco JC, Cunha RC, Ferreira PE, Guarita-Souza LC, Ferreira RJ, Mogharbel BF, Garikipati VN, et al. Human adipose-derived mesenchymal stem cells cryopreservation and thawing decrease alpha4-integrin expression. Stem Cells Int. 2016;2016:2562718. 31. Blasi A, Martino C, Balducci L, Saldarelli M, Soleti A, Navone SE, Canzi L,
Cristini S, Invernici G, Parati EA, Alessandri G. Dermal fibroblasts display similar phenotypic and differentiation capacity to fat-derived mesenchymal stem cells, but differ in anti-inflammatory and angiogenic potential. Vasc Cell. 2011;3:5.
32. Giesert C, Marxer A, Sutherland DR, Schuh AC, Kanz L, Buhring HJ. Antibody W7C5 defines a CD109 epitope expressed on CD34+ and CD34-hematopoietic and mesenchymal stem cell subsets. Ann N Y Acad Sci. 2003;996:227–30.
33. Zhou S, Cecere R, Philip A. CD109 released from human bone marrow mesenchymal stem cells attenuates TGF-beta-induced epithelial to mesenchymal transition and stemness of squamous cell carcinoma. Oncotarget. 2017;8:95632–47.