R E V I E W
Open Access
Variation in population levels of physical
activity in European adults according to
cross-European studies: a systematic
literature review within DEDIPAC
Anne Loyen
1*, Linde Van Hecke
2,3, Maïté Verloigne
4, Ingrid Hendriksen
5,6, Jeroen Lakerveld
1,
Jostein Steene-Johannessen
7, Anne Vuillemin
8, Annemarie Koster
9, Alan Donnelly
10, Ulf Ekelund
7,
Benedicte Deforche
2,3, Ilse De Bourdeaudhuij
4, Johannes Brug
1, Hidde P. van der Ploeg
11,12and on behalf of the DEDIPAC consortium
Abstract
Background:Physical inactivity is a well-known public health risk that should be monitored at the population level. Physical activity levels are often surveyed across Europe. This systematic literature review aims to provide an overview of all existing cross-European studies that assess physical activity in European adults, describe the variation in population levels according to these studies, and discuss the impact of the assessment methods.
Methods:Six literature databases (PubMed, EMBASE, CINAHL, PsycINFO, SportDiscus and OpenGrey) were searched,
supplemented with backward- and forward tracking and searching authors’and experts’literature databases. Articles
were included if they reported on observational studies measuring total physical activity and/or physical activity in leisure time in the general population in two or more European countries. Each record was reviewed, extracted and assessed by two independent researchers and disagreements were resolved by a third researcher. The review protocol of this review is registered in the PROSPERO database under registration number CRD42014010334.
Results:Of the 9,756 unique identified articles, twenty-five were included in this review, reporting on sixteen different studies, including 2 to 35 countries and 321 to 274,740 participants. All but two of the studies used questionnaires to assess physical activity, with the majority of studies using the IPAQ-short questionnaire. The remaining studies used accelerometers. The percentage of participants who either were or were not meeting the physical activity recommendations was the most commonly reported outcome variable, with the percentage of participants meeting the recommendations ranging from 7 % to 96 % across studies and countries.
Conclusions: The included studies showed substantial variation in the assessment methods, reported outcome variables and, consequently, the presented physical activity levels. Because of this, absolute population levels of physical activity in European adults are currently unknown. However, when ranking countries, Ireland, Italy, Malta, Portugal, and Spain generally appear to be among the less active countries. Objective data of adults across Europe is currently limited. These findings highlight the need for standardisation of the measurement methods, as well as cross-European monitoring of physical activity levels.
Keywords:Adults, Assessment methods, Europe, Physical Activity, Prevalence, Review
* Correspondence:a.loyen@vumc.nl
1Department of Epidemiology and Biostatistics, VU University Medical Center, EMGO+ Institute for Health and Care Research, De Boelelaan 1089a, 1081 HV Amsterdam, The Netherlands
Full list of author information is available at the end of the article
© 2016 The Author(s).Open AccessThis article is distributed under the terms of the Creative Commons Attribution 4.0 International License (http://creativecommons.org/licenses/by/4.0/), which permits unrestricted use, distribution, and reproduction in any medium, provided you give appropriate credit to the original author(s) and the source, provide a link to the Creative Commons license, and indicate if changes were made. The Creative Commons Public Domain Dedication waiver (http://creativecommons.org/publicdomain/zero/1.0/) applies to the data made available in this article, unless otherwise stated. Loyenet al. International Journal of Behavioral Nutrition
and Physical Activity (2016) 13:72
Background
According to the World Health Organization (WHO)’s physical activity recommendations, adults should engage in at least 150 min of moderate-intensity aerobic phys-ical activity per week, or 75 min of vigorous-intensity aerobic activity, or an equivalent combination [1]. Not meeting these recommendations increases the risk of cardiovascular diseases, type 2 diabetes, breast- and colon cancer, and premature death [2, 3]. In 2009, the WHO identified physical inactivity as the fourth leading risk factor for global mortality, causing approximately 6 % of global deaths [2]. A more recent study estimated that physical inactivity was responsible for 9 % of world-wide premature deaths [3].
In 2012, it was estimated that 31.1 % of the adult global population did not meet the physical activity recommen-dations [4]. Monitoring population levels of physical (in) activity provides the opportunity to track changes over time, identify and target populations with low physical activity levels, and evaluate public health policies and strategies. Internationally comparable data are especially interesting, since they allow cross-country comparisons and benchmarking.
In 2013, twelve European Member States established a Knowledge Hub on DEterminants of DIet and Physical ACtivity (DEDIPAC). One of DEDIPAC’s aims is “enab-ling a better standardised and more continuous pan-European‘needs analysis’, i.e. to monitor dietary, physical activity and sedentary behaviours and changes in these behaviours across the life course and within populations to identify targets and target populations for (policy) in-terventions”[5].
Providing an overview of the existing studies that monitor physical activity across European countries was identified as the first step towards standardisation in population surveillance. In addition, the results of these studies could provide an understanding of the current population levels of physical activity in Europe. A 2010 overview of physical activity surveillance by the WHO Regional Office for Europe concluded that even though population levels of physical activity are frequently mon-itored across Europe, national surveys were not compar-able due to differences in measurement methods while cross-national surveillance efforts were heterogeneous [6]. Hence, the current study provides an updated over-view with the sole focus on multi-country studies, in order to enable within-study comparisons of population levels of physical activity across countries.
Four systematic literature reviews have been conjointly performed, focused on 1) sedentary time in youth [7], 2) sedentary time in adults [8], 3) physical activity in youth [9], and 4) physical activity in adults (the current re-view). The aim of the present review is to a) provide an overview of existing cross-European studies on physical
activity in adults (≥18 years), b) describe the variation in population levels of physical activity according to these studies, and c) discuss the impact of study and measure-ment methods on these population levels.
Methods
As described in the introduction, this systematic litera-ture review is part of a set of four reviews. Because the four systematic reviews originate from the same project, have similar objectives (although for different behaviours and/or age groups) and share their methodology, the introduction-, methods- and discussion sections of the review articles have obvious similarities. The search, art-icle selection, data extraction and quality assessment were conducted conjointly for all four reviews. Subse-quently, the included articles were allocated to the ap-propriate review article(s). One article could be included in multiple reviews. If an article included both youth (<18 years) and adults (≥18 years) and presented strati-fied results, those stratistrati-fied results were used in the ap-propriate review. If the article did not present stratified results, the article was allocated to the most appropriate review, based on the mean age (and age distribution) of the study sample. Before the search commenced, review protocols were written based on the“Centre for Reviews and Dissemination’s guidance for undertaking reviews in health care”[10], and registered in the PROSPERO data-base [11]. The review protocol of this review on physical activity in adults is published under registration number CRD42014010334. The reporting of this systematic re-view adheres to the preferred reporting items of the PRISMA checklist (see Additional file 1).
Search strategy
The search was conducted in June 2014 and updated on February 29th, 2016. Six databases (PubMed, EMBASE, CINAHL, PsycINFO, SportDiscus and OpenGrey) were searched using similar search strategies, adapted to each database. The following search terms were used: ‘Phys-ical activity’OR‘Sedentary behaviour’AND‘Europe’ (in-cluding all individual country names) AND ‘Countries’/ ‘Multi-country’/‘International’. Both the index terms and the title and abstract were searched and synonyms (e.g. for physical activity: physically active, physical exercise, etc.) were used. The complete search string can be found in Additional file 2. Based on the in- and exclusion cri-teria described below, search filters of the databases were used when possible, for example to select the appropri-ate publication period or language.
appropriate articles. Also, several experts in the field of physical activity and sedentary behaviour were contacted to provide additional articles. Finally, all authors involved in the four reviews were asked to search their own litera-ture databases for appropriate articles. All additionally retrieved articles underwent the same selection process as the original articles - as described below.
Article selection
All retrieved records were imported into Reference Manager 12 (Thomson Reuters, New York). Duplicates were hand-searched and removed. Records were in-cluded if they were journal articles, reports or doctoral dissertations (further referred to as ‘articles’) written in English. To be included, articles needed to report on ob-servational studies conducted after 01-01-2000 (to avoid reporting outdated data) in the general, healthy popula-tion. In addition, articles were only included if they pro-vided data for two or more European countries (as defined by the Council of Europe) [12].
With regard to physical activity, articles were included if they reported total physical activity (e.g. minutes/day or meeting recommendations), and/or physical activity in leisure time. Articles that only reported on transport, occupational or household physical activity were excluded. Both subjective (e.g. questionnaires) and objective (e.g. accelerometers) measures were included.
Three researchers (AL, LVH, MV) were involved in the article selection, data extraction and quality assess-ment. For the title selection, the three researchers each independently reviewed 1/3 of the titles of the retrieved articles. For the abstract and the full-text selection, data extraction and quality assessment, the three researchers each covered 2/3 of the articles, so that each article was independently reviewed, extracted and assessed by two different researchers. Disagreement between the two re-searchers was resolved by the third researcher.
Data extraction
A standardized data extraction file was used to extract data regarding the study characteristics, the study sam-ple, the assessment methods, the reported outcomes, and the findings. We did not request the original data. The complete data extraction file can be found in Additional file 3.
Quality assessment
A quality score was used to provide a general overview of the quality of the included articles. The ‘Standard quality assessment criteria for evaluating primary research papers from a variety of fields’ [13] was used for the as-sessment. The checklist consists of fourteen items to be scored ‘Yes’ (2 points),‘Partial’ (1 point),‘No’ (0 points)
and ‘Not applicable’. The summary score was calculated
as follows: Total sum ((number of ‘Yes’x 2) + (number of
‘Partial’x 1)) / Total possible sum (28–(number of ‘Not
applicable’ x 2)). This instrument was chosen because it provides the opportunity to assess and compare the qual-ity of different study designs, focuses on both the research and the reporting, and allows researchers to indicate that an item is not applicable, without affecting the total qual-ity score. The complete qualqual-ity assessment file can be found in Additional file 4.
Results
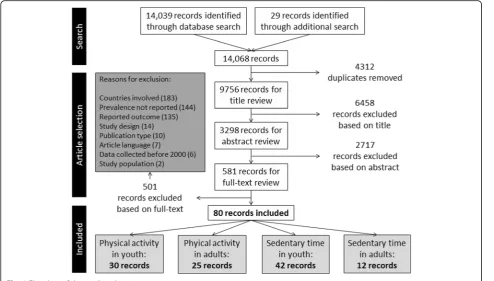
The flowchart of the combined review process for all four reviews is shown in Fig. 1. The search (original and update combined) resulted in 14,068 records (14,039 through the database search and 29 through the additional search), of which 9756 were unique. 6458 records were ex-cluded based on their title, and an additional 2717 based on their abstract, leaving 581 records for the full-text re-view phase. In this phase, 501 records were excluded, mainly because the studies did not include at least two European countries (N = 183); because the prevalence numbers were not reported per country (N = 144); or be-cause the reported outcomes were not relevant (N = 135). The remaining 80 records were eligible for inclusion. In the current review on physical activity in adults, 25 re-cords were included [4, 14–37].
Overview of the existing cross-European studies on physical activity in adults
outcome variables. None of the included articles reported data from Armenia, Azerbaijan, Former Yugoslav Republic of Macedonia, Republic of Moldova, Montenegro, and the microstates Andorra, Liechtenstein, Monaco and San Marino.
Variation in population levels of physical activity in European adults
As discussed, several articles reported on data from the same study. To avoid presenting results from the same data twice, we used one article per study to describe re-ported physical activity levels. This selection was based on the information in the article and the similarities with the other articles. Thus, eight articles presenting dupli-cate results were excluded [14, 15, 20, 21, 23, 25, 27, 28]. The following section will discuss the seventeen remaining articles.
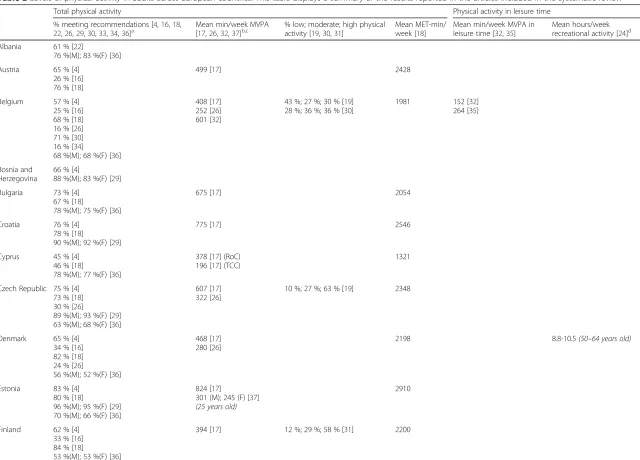
Table 2 provides an overview of the levels of physical activity in adults across European countries, as a summary of the results reported in the included articles. To enable comparison across studies, we harmonised these results where this was possible. For example, some articles [4, 22, 29, 33] reported the percentage of participantsnot meet-ing the physical activity recommendations. After checkmeet-ing for missing values, we reversed those numbers. Another article [17] reported days/week and minutes/day of mod-erate physical activity (MPA) and vigorous physical activity (VPA), which we converted into minutes/week
moderate-to-vigorous physical activity (MVPA) using the following formula: ((days/week VPA * min/day VPA) + (days/week MPA * min/day MPA)). Finally, two articles [26, 37] re-ported MVPA minutes per day instead of per week, which we multiplied by seven to calculate minutes per week.
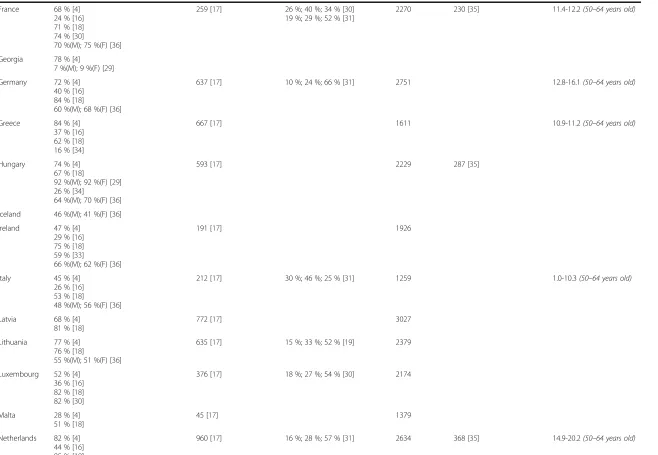
Ten articles reported the percentage of participants meeting the physical activity recommendations. The lowest percentages (7 % in males and 9 % in females) were found in Georgia, while the highest percentage (96 %) was found in Ukrainian females and Estonian males [29]. Four articles reported the time spent in MVPA, which ranged from 45 min/week in Malta to 960 min/week in the Netherlands [17]. Three articles re-ported the percentage of participants with low, moderate and high physical activity levels, and the percentage of participants with high physical activity levels varied from 25 % in Italy to 66 % in Germany [31]. MET-minutes/ week ranged from 1139 in Portugal to 3027 in Latvia [18]. The Portuguese reported 147 min/week of MVPA in leisure time [32], whereas the Dutch reported 368 min/week [35]. Finally, Italian elderly reported the least hours of recreational physical activity per week(1.0), whereas Dutch elderly reported the most (20.2) [24].
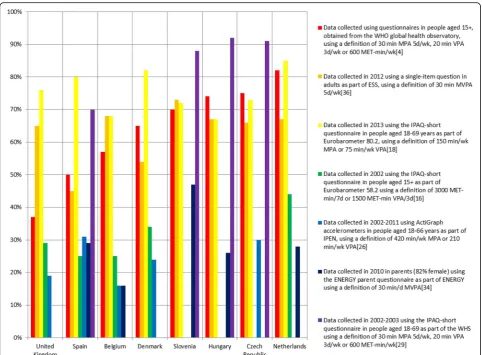
In order to provide a more accessible overview of the re-sults, Fig. 2 shows the percentage of participants meeting the physical activity recommendations in eight different countries, based on seven different studies. This outcome was chosen because it was reported most often; these Fig. 1Flowchart of the combined review process
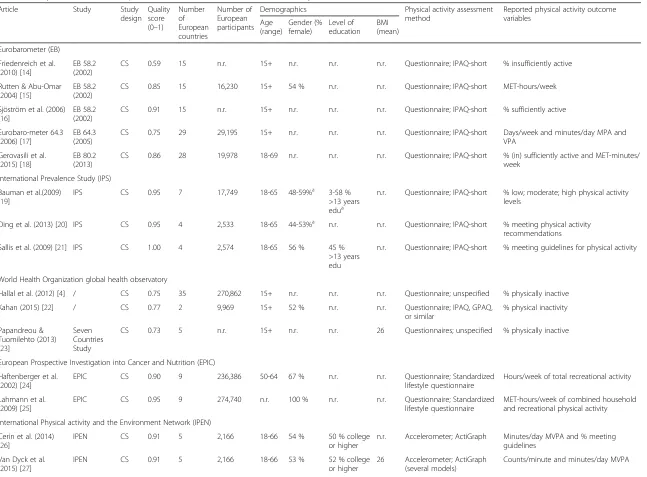
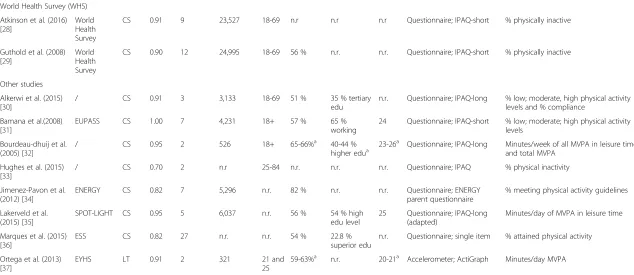
Table 1Study information and sample characteristics of the articles included in the systematic review
Article Study Study design
Quality score (0–1)
Number of European countries Number of European participants
Demographics Physical activity assessment method
Reported physical activity outcome variables Age (range) Gender (% female) Level of education BMI (mean) Eurobarometer (EB)
Friedenreich et al. (2010) [14]
EB 58.2 (2002)
CS 0.59 15 n.r. 15+ n.r. n.r. n.r. Questionnaire; IPAQ-short % insufficiently active
Rutten & Abu-Omar (2004) [15]
EB 58.2 (2002)
CS 0.85 15 16,230 15+ 54 % n.r. n.r. Questionnaire; IPAQ-short MET-hours/week
Sjöström et al. (2006) [16]
EB 58.2 (2002)
CS 0.91 15 n.r. 15+ n.r. n.r. n.r. Questionnaire; IPAQ-short % sufficiently active
Eurobaro-meter 64.3 (2006) [17]
EB 64.3 (2005)
CS 0.75 29 29,195 15+ n.r. n.r. n.r. Questionnaire; IPAQ-short Days/week and minutes/day MPA and VPA
Gerovasili et al. (2015) [18]
EB 80.2 (2013)
CS 0.86 28 19,978 18-69 n.r. n.r. n.r. Questionnaire; IPAQ-short % (in) sufficiently active and MET-minutes/ week
International Prevalence Study (IPS)
Bauman et al.(2009) [19]
IPS CS 0.95 7 17,749 18-65 48-59%a 3-58 % >13 years edua
n.r. Questionnaire; IPAQ-short % low; moderate; high physical activity levels
Ding et al. (2013) [20] IPS CS 0.95 4 2,533 18-65 44-53%a n.r. n.r. Questionnaire; IPAQ-short % meeting physical activity recommendations
Sallis et al. (2009) [21] IPS CS 1.00 4 2,574 18-65 56 % 45 % >13 years edu
n.r. Questionnaire; IPAQ-short % meeting guidelines for physical activity
World Health Organization global health observatory
Hallal et al. (2012) [4] / CS 0.75 35 270,862 15+ n.r. n.r. n.r. Questionnaire; unspecified % physically inactive
Kahan (2015) [22] / CS 0.77 2 9,969 15+ 52 % n.r. n.r. Questionnaire; IPAQ, GPAQ, or similar
% physical inactivity
Papandreou & Tuomilehto (2013) [23]
Seven Countries Study
CS 0.73 5 n.r. 15+ n.r. n.r. 26 Questionnaires; unspecified % physically inactive
European Prospective Investigation into Cancer and Nutrition (EPIC)
Haftenberger et al. (2002) [24]
EPIC CS 0.90 9 236,386 50-64 67 % n.r. n.r. Questionnaire; Standardized lifestyle questionnaire
Hours/week of total recreational activity
Lahmann et al. (2009) [25]
EPIC CS 0.95 9 274,740 n.r. 100 % n.r. n.r. Questionnaire; Standardized lifestyle questionnaire
MET-hours/week of combined household and recreational physical activity
International Physical activity and the Environment Network (IPEN)
Cerin et al. (2014) [26]
IPEN CS 0.91 5 2,166 18-66 54 % 50 % college or higher
n.r. Accelerometer; ActiGraph Minutes/day MVPA and % meeting guidelines
Van Dyck et al. (2015) [27]
IPEN CS 0.91 5 2,166 18-66 53 % 52 % college or higher
26 Accelerometer; ActiGraph (several models)
Counts/minute and minutes/day MVPA
Table 1Study information and sample characteristics of the articles included in the systematic review(Continued)
World Health Survey (WHS)
Atkinson et al. (2016) [28]
World Health Survey
CS 0.91 9 23,527 18-69 n.r n.r n.r Questionnaire; IPAQ-short % physically inactive
Guthold et al. (2008) [29]
World Health Survey
CS 0.90 12 24,995 18-69 56 % n.r. n.r. Questionnaire; IPAQ-short % physically inactive
Other studies
Alkerwi et al. (2015) [30]
/ CS 0.91 3 3,133 18-69 51 % 35 % tertiary edu
n.r. Questionnaire; IPAQ-long % low; moderate, high physical activity levels and % compliance
Bamana et al.(2008) [31]
EUPASS CS 1.00 7 4,231 18+ 57 % 65 % working
24 Questionnaire; IPAQ-short % low; moderate; high physical activity levels
Bourdeau-dhuij et al. (2005) [32]
/ CS 0.95 2 526 18+ 65-66%a 40-44 %
higher edua
23-26a Questionnaire; IPAQ-long Minutes/week of all MVPA in leisure time and total MVPA
Hughes et al. (2015) [33]
/ CS 0.70 2 n.r 25-84 n.r. n.r. n.r. Questionnaire; IPAQ % physical inactivity
Jimenez-Pavon et al. (2012) [34]
ENERGY CS 0.82 7 5,296 n.r. 82 % n.r. n.r. Questionnaire; ENERGY parent questionnaire
% meeting physical activity guidelines
Lakerveld et al. (2015) [35]
SPOT-LIGHT CS 0.95 5 6,037 n.r. 56 % 54 % high edu level
25 Questionnaire; IPAQ-long (adapted)
Minutes/day of MVPA in leisure time
Marques et al. (2015) [36]
ESS CS 0.82 27 n.r. n.r. 54 % 22.8 %
superior edu
n.r. Questionnaire; single item % attained physical activity
Ortega et al. (2013) [37]
EYHS LT 0.91 2 321 21 and
25
59-63%a n.r. 20-21a Accelerometer; ActiGraph Minutes/day MVPA
BMIBody Mass Index,EUPASSEuropean Physical Activity Surveillance System,ENERGYEuropeaN Energy balance Research to prevent excessive weight Gain among Youth,SPOTLIGHTSustainable Prevention of Obesity Through Integrated Strategies,ESSEuropean Social Survey,EYHSEuropean Youth Heart Study,CSCross-sectional,LTLongitudinal,n.r.not reported,yrsyears,edueducation,IPAQInternational Physical Activity Question-naire,GPAQGlobal Physical Activity Questionnaire,METmetabolic equivalent,MPAmoderate physical activity,VPAvigorous physical activity,MVPAmoderate-to-vigorous physical activity
a
These publications only presented stratified demographics. The numbers shown here represent the range
Loyen
et
al.
Internationa
lJournal
of
Behavioral
Nutrition
and
Physical
Activity
(2016) 13:72
Page
6
of
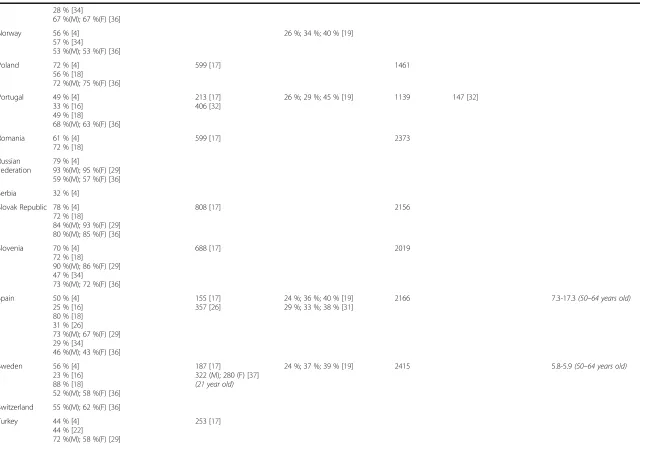
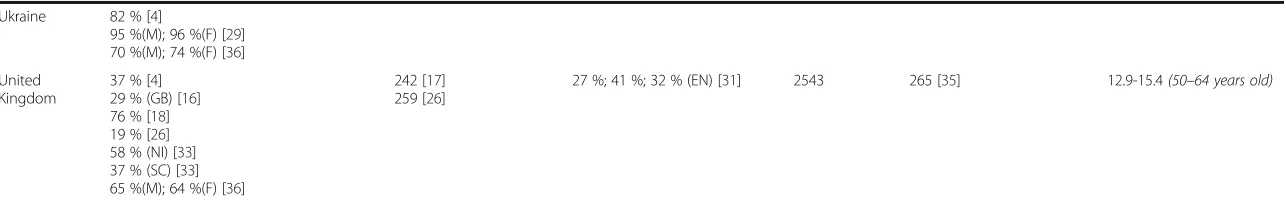
Table 2Levels of physical activity in adults across European countries. This table displays a summary of the results reported in the articles included in the systematic review
Total physical activity Physical activity in leisure time
% meeting recommendations [4,16,18,
22,26,29,30,33,34,36]a Mean min/week MVPA[17,26,32,37]b,c % low; moderate; high physicalactivity [19,30,31] Mean MET-min/week [18] Mean min/week MVPA inleisure time [32,35] Mean hours/weekrecreational activity [24]d
Albania 61 % [22]
76 %(M); 83 %(F) [36]
Austria 65 % [4] 26 % [16] 76 % [18]
499 [17] 2428
Belgium 57 % [4] 25 % [16] 68 % [18] 16 % [26] 71 % [30] 16 % [34]
68 %(M); 68 %(F) [36]
408 [17] 252 [26] 601 [32]
43 %; 27 %; 30 % [19] 28 %; 36 %; 36 % [30]
1981 152 [32] 264 [35]
Bosnia and Herzegovina
66 % [4]
88 %(M); 83 %(F) [29]
Bulgaria 73 % [4] 67 % [18]
78 %(M); 75 %(F) [36]
675 [17] 2054
Croatia 76 % [4] 78 % [18]
90 %(M); 92 %(F) [29]
775 [17] 2546
Cyprus 45 % [4] 46 % [18]
78 %(M); 77 %(F) [36]
378 [17] (RoC) 196 [17] (TCC)
1321
Czech Republic 75 % [4] 73 % [18] 30 % [26]
89 %(M); 93 %(F) [29] 63 %(M); 68 %(F) [36]
607 [17] 322 [26]
10 %; 27 %; 63 % [19] 2348
Denmark 65 % [4] 34 % [16] 82 % [18] 24 % [26]
56 %(M); 52 %(F) [36]
468 [17] 280 [26]
2198 8.8-10.5(50–64 years old)
Estonia 83 % [4] 80 % [18]
96 %(M); 95 %(F) [29] 70 %(M); 66 %(F) [36]
824 [17]
301 (M); 245 (F) [37]
(25 years old)
2910
Finland 62 % [4] 33 % [16] 84 % [18]
53 %(M); 53 %(F) [36]
394 [17] 12 %; 29 %; 58 % [31] 2200
Loyen
et
al.
Internationa
lJournal
of
Behavioral
Nutrition
and
Physical
Activity
(2016) 13:72
Page
7
of
Table 2Levels of physical activity in adults across European countries. This table displays a summary of the results reported in the articles included in the systematic review (Continued)
France 68 % [4] 24 % [16] 71 % [18] 74 % [30]
70 %(M); 75 %(F) [36]
259 [17] 26 %; 40 %; 34 % [30] 19 %; 29 %; 52 % [31]
2270 230 [35] 11.4-12.2(50–64 years old)
Georgia 78 % [4]
7 %(M); 9 %(F) [29]
Germany 72 % [4] 40 % [16] 84 % [18]
60 %(M); 68 %(F) [36]
637 [17] 10 %; 24 %; 66 % [31] 2751 12.8-16.1(50–64 years old)
Greece 84 % [4] 37 % [16] 62 % [18] 16 % [34]
667 [17] 1611 10.9-11.2(50–64 years old)
Hungary 74 % [4] 67 % [18]
92 %(M); 92 %(F) [29] 26 % [34]
64 %(M); 70 %(F) [36]
593 [17] 2229 287 [35]
Iceland 46 %(M); 41 %(F) [36]
Ireland 47 % [4] 29 % [16] 75 % [18] 59 % [33]
66 %(M); 62 %(F) [36]
191 [17] 1926
Italy 45 % [4] 26 % [16] 53 % [18]
48 %(M); 56 %(F) [36]
212 [17] 30 %; 46 %; 25 % [31] 1259 1.0-10.3(50–64 years old)
Latvia 68 % [4] 81 % [18]
772 [17] 3027
Lithuania 77 % [4] 76 % [18]
55 %(M); 51 %(F) [36]
635 [17] 15 %; 33 %; 52 % [19] 2379
Luxembourg 52 % [4] 36 % [16] 82 % [18] 82 % [30]
376 [17] 18 %; 27 %; 54 % [30] 2174
Malta 28 % [4] 51 % [18]
45 [17] 1379
Netherlands 82 % [4] 44 % [16] 85 % [18]
960 [17] 16 %; 28 %; 57 % [31] 2634 368 [35] 14.9-20.2(50–64 years old)
Loyen
et
al.
Internationa
lJournal
of
Behavioral
Nutrition
and
Physical
Activity
(2016) 13:72
Page
8
of
Table 2Levels of physical activity in adults across European countries. This table displays a summary of the results reported in the articles included in the systematic review (Continued)
28 % [34]
67 %(M); 67 %(F) [36]
Norway 56 % [4] 57 % [34]
53 %(M); 53 %(F) [36]
26 %; 34 %; 40 % [19]
Poland 72 % [4] 56 % [18]
72 %(M); 75 %(F) [36]
599 [17] 1461
Portugal 49 % [4] 33 % [16] 49 % [18]
68 %(M); 63 %(F) [36]
213 [17] 406 [32]
26 %; 29 %; 45 % [19] 1139 147 [32]
Romania 61 % [4] 72 % [18]
599 [17] 2373
Russian Federation
79 % [4]
93 %(M); 95 %(F) [29] 59 %(M); 57 %(F) [36]
Serbia 32 % [4]
Slovak Republic 78 % [4] 72 % [18]
84 %(M); 93 %(F) [29] 80 %(M); 85 %(F) [36]
808 [17] 2156
Slovenia 70 % [4] 72 % [18]
90 %(M); 86 %(F) [29] 47 % [34]
73 %(M); 72 %(F) [36]
688 [17] 2019
Spain 50 % [4] 25 % [16] 80 % [18] 31 % [26]
73 %(M); 67 %(F) [29] 29 % [34]
46 %(M); 43 %(F) [36]
155 [17] 357 [26]
24 %; 36 %; 40 % [19] 29 %; 33 %; 38 % [31]
2166 7.3-17.3(50–64 years old)
Sweden 56 % [4] 23 % [16] 88 % [18]
52 %(M); 58 %(F) [36]
187 [17]
322 (M); 280 (F) [37]
(21 year old)
24 %; 37 %; 39 % [19] 2415 5.8-5.9(50–64 years old)
Switzerland 55 %(M); 62 %(F) [36]
Turkey 44 % [4] 44 % [22]
72 %(M); 58 %(F) [29]
253 [17]
Loyen
et
al.
Internationa
lJournal
of
Behavioral
Nutrition
and
Physical
Activity
(2016) 13:72
Page
9
of
Table 2Levels of physical activity in adults across European countries. This table displays a summary of the results reported in the articles included in the systematic review (Continued)
Ukraine 82 % [4]
95 %(M); 96 %(F) [29] 70 %(M); 74 %(F) [36]
United Kingdom
37 % [4] 29 % (GB) [16] 76 % [18] 19 % [26] 58 % (NI) [33] 37 % (SC) [33] 65 %(M); 64 %(F) [36]
242 [17] 259 [26]
27 %; 41 %; 32 % (EN) [31] 2543 265 [35] 12.9-15.4(50–64 years old)
Minminutes,MVPAModerate-to-Vigorous Physical Activity,METmetabolic equivalent,MMales,FFemales,RoCRepublic of Cyprus,TCCTurkish Cypriot Community,yrsyears,GBGreat Britain,NINorthern Ireland,SC
Scotland,ENEngland.a
. Some studies [4,22,29,33] reported the percentage of participants NOT meeting the physical activity recommendations. We reversed those numbers to enable comparison.b
. Study [17] reported days/week and minutes/day of moderate physical activity (MPA) and vigorous physical activity (VPA) separately. We used the following formula to arrive at min/week MVPA: ((days/week VPA * min/day VPA) + (days/week MPA * min/day MPA)).c
. Studies [26,37] reported min per day MVPA instead of per week. To enable comparison, we multiplied these numbers by 7 to calculate minutes per week.d
. This study reported the results stratified by study center and gender. The numbers shown here are the lowest and highest results per country
Loyen
et
al.
Internationa
lJournal
of
Behavioral
Nutrition
and
Physical
Activity
(2016) 13:72
Page
10
of
countries and studies were included because they provided most data points. Because the WHS [29] and ESS [36] re-sults were stratified by gender, we calculated the (weighted) mean. In general, the WHS reports the highest percentages [29], while IPEN [26] and ENERGY [34] report the lowest percentages of participants meeting the physical activity recommendations. The three studies using the IPAQ-short questionnaire [16, 18, 29] show quite some differences across countries. Overall, the greatest variety can be found in Hungary, where the reported percentage of participants meeting the physical activity recommendations ranges from 26 % up to 92 %.
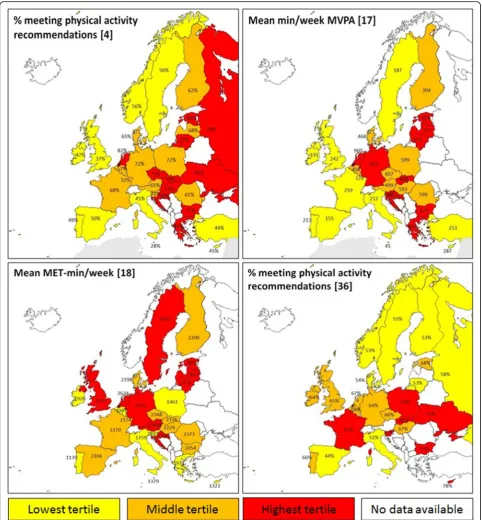
In addition, we constructed four maps of Europe based on the largest studies included in this review, which are shown in Fig. 3. They show the distribution of a) the per-centage of participants meeting the physical activity recom-mendations [4], b) the mean minutes/week of MVPA [17],
c) the mean MET-minutes/week [18], and d) the percentage meeting the recommendations [36]. All variables were self-reported. The colourings represent the lowest, middle and highest tertiles, respectively, based on the reported out-come variables. In general, the geographical patterns of the tertiles seem to be reasonably coherent between the four studies, with Italy consistently belonging to the low-est tertile in all studies, and Ireland, Malta, Portugal and Spain belonging to the lowest tertile in the majority of the studies.
Variation in assessment methods and reported outcome variables
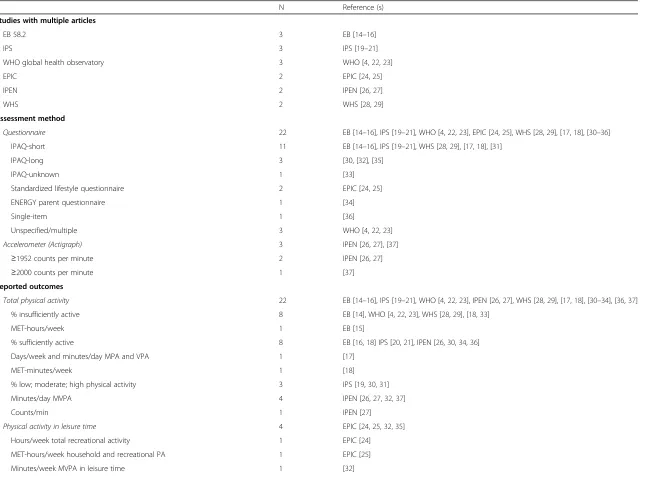
An overview of the assessment methods and the reported outcomes of the included articles is shown in Table 3. In this overview, all twenty-five included articles are Fig. 2The percentage of adults meeting physical activity recommendations across countries based on different articles. WHO = World Health Organization; Min = minutes; MPA = Moderate intensity physical activity; d = days; wk = week; VPA = Vigorous intensity physical activity; MET = Metabolic Equivalent; MVPA = Moderate-to-vigorous physical activity; ESS = European Social Survey; IPAQ = International Physical Activity Questionnaire; IPEN = International Physical activity and the Environment Network; ENERGY = European Energy balance Research to prevent excessive weight Gain among Youth; WHS = World Health Survey. The World Health Survey and European Social Survey stratified their results by gender. We calculated the (weighted) average
considered again, in order to give a complete overview. The articles reporting on the same study are indicated in the table. Twenty-one articles focused on total physical ac-tivity, three articles focused on physical activity in leisure-time [24, 25, 35], and one study studied both [32]. In total,
nine assessment methods were used to report twelve dif-ferent outcomes. Six studies (reported in eleven articles) used the IPAQ-short questionnaire [14–21, 28, 29, 31]. Fifteen articles (based on ten studies) reported the per-centage of participants who either were or were not Fig. 3The distribution of physical activity levels across Europe, showinga) the percentage of participants meeting the physical activity recommendations [4],b) the mean minutes/week of MVPA [17],c) the mean MET-minutes/week [18], andd) again the percentage meeting the recommendations [36]. All variables were self-reported. The yellow, orange and red colouring represent the lowest, middle and highest tertiles, respectively, based on the reported outcome variable. The countries marked white had no available data in (the majority of) the studies. Designed by Showeet.com
Table 3Assessment methods and reported outcome variables in the articles included in the systematic review
N Reference (s)
Studies with multiple articles
EB 58.2 3 EB [14–16]
IPS 3 IPS [19–21]
WHO global health observatory 3 WHO [4,22,23]
EPIC 2 EPIC [24,25]
IPEN 2 IPEN [26,27]
WHS 2 WHS [28,29]
Assessment method
Questionnaire 22 EB [14–16], IPS [19–21], WHO [4,22,23], EPIC [24,25], WHS [28,29], [17,18], [30–36]
IPAQ-short 11 EB [14–16], IPS [19–21], WHS [28,29], [17,18], [31]
IPAQ-long 3 [30, [32], [35]
IPAQ-unknown 1 [33]
Standardized lifestyle questionnaire 2 EPIC [24,25]
ENERGY parent questionnaire 1 [34]
Single-item 1 [36]
Unspecified/multiple 3 WHO [4,22,23]
Accelerometer (Actigraph) 3 IPEN [26,27], [37]
≥1952 counts per minute 2 IPEN [26,27]
≥2000 counts per minute 1 [37]
Reported outcomes
Total physical activity 22 EB [14–16], IPS [19–21], WHO [4,22,23], IPEN [26,27], WHS [28,29], [17,18], [30–34], [36,37]
% insufficiently active 8 EB [14], WHO [4,22,23], WHS [28,29], [18,33]
MET-hours/week 1 EB [15]
% sufficiently active 8 EB [16,18] IPS [20,21], IPEN [26,30,34,36]
Days/week and minutes/day MPA and VPA 1 [17]
MET-minutes/week 1 [18]
% low; moderate; high physical activity 3 IPS [19,30,31]
Minutes/day MVPA 4 IPEN [26,27,32,37]
Counts/min 1 IPEN [27]
Physical activity in leisure time 4 EPIC [24,25,32,35]
Hours/week total recreational activity 1 EPIC [24]
MET-hours/week household and recreational PA 1 EPIC [25]
Minutes/week MVPA in leisure time 1 [32]
Loyen
et
al.
Internationa
lJournal
of
Behavioral
Nutrition
and
Physical
Activity
(2016) 13:72
Page
13
of
Table 3Assessment methods and reported outcome variables in the articles included in the systematic review(Continued)
Minutes/day MVPA in leisure time 1 [35]
Operationalization of physical (in)activity
3000 MET-min/7 days, or 1500 MET-min VPA/3 days 2 EB [14,16]
150 min/week MPA or 75 min/week VPA 2 IPS [18,20]
30 min MPA 5 d/week, 20 min VPA 3 d/week, or 600 MET-min/week 7 IPS [21], WHO [4,22,23], WHS [28–30]
420 min/week MPA or 210 min/week VPA 1 IPEN [26]
5 days/week 30 min MVPA 2 [33] (NI) [36]
150 min/week MPA or 60 min/week VPA 1 [33] (I&SC)
30 min/day MVPA 1 [34]
EBEurobarometer,IPSInternational Prevalence Study,WHOWorld Health Organization,EPICEuropean Prospective Investigation into Cancer and Nutrition,IPENInternational Physical activity and the Environment Network,WHSWorld Health Survey,IPAQInternational Physical Activity Questionnaire,ENERGYEuropeaN Energy balance Research to prevent excessive weight Gain among Youth,METMetabolic Equivalent,MPA
Moderate Physical Activity,VPAVigorous Physical Activity,MVPAModerate-to-Vigorous Physical Activity,PAPhysical Activity,minminutes,ddays,NINorthern Ireland,IIreland,SCScotland
Loyen
et
al.
Internationa
lJournal
of
Behavioral
Nutrition
and
Physical
Activity
(2016) 13:72
Page
14
of
sufficiently active/meeting the physical activity recom-mendations [4, 14, 16, 18, 20–23, 26, 28–30, 33, 34, 36]. These fifteen articles used seven different ways of oper-ationalizing physical (in) activity. While some of the arti-cles that reported on the same study reported identical outcome variables, other articles that reported on the same study show differences in their reported outcomes and/or the operationalization of physical (in) activity.
Discussion
In this systematic literature review we aimed to provide an overview of the existing cross-European studies on physical activity levels in adults, to describe the variation in population levels of physical activity in European adults, and to discuss the impact of assessment methods. A total of twenty-five eligible articles were identified, reporting on sixteen different studies. The IPAQ-short questionnaire was used most frequently as assessment method, and the percentage of participants who either were or were not meeting the physical activity recom-mendations was reported most often as an outcome, with the percentage of participants meeting the physical activity recommendations ranging from 7 % to as high as 96 % across countries and studies.
Some of the (mostly Eastern) countries within the Council of Europe are currently not represented in cross-European surveys and studies on physical activity in adults. Future studies should include these countries in order to gain a complete picture of the population levels of physical activity in all countries across Europe, and to enable comparison and benchmarking.
A variety of questionnaires were used to assess physical activity levels. Although frequently used in physical activ-ity research, subjective self-report measures like question-naires have well-known limitations such as recall- and social desirability bias [38], limiting their validity. In addition, participants from different countries and/or cul-tures may interpret questions differently. These limitations do not apply to studies using objective assessment methods like accelerometers. Even though accelerometers have different limitations, such as higher costs and the lack of contextual information, they provide more valid and comparable physical activity data. Two of the identi-fied studies used accelerometers to assess physical activity levels across Europe [26, 27, 37]. One of these studies was conducted in a small sample of young adults in two coun-tries [37], while the other included non-representative samples of adults in five European countries, as part of a larger international study [26, 27]. Therefore, it can be concluded that there is currently a limited amount of ob-jective measurement of physical activity levels in adults across European countries. It should be noted, however, that accelerometer data are available in large scale national representative adult samples from five European countries
[39], but these were not included in the current review as they were single-country studies.
Because the different studies used different assessment methods, it is difficult to compare their results. In addition, even within the studies that used the same assessment method, there is substantial variation in the reported outcomes, and even within the studies that re-port the same outcome, there is variation in the opera-tionalization of that outcome. Moreover, differences in study samples (and non-population representative study samples) might add to this variation. This heterogeneity arguably becomes most apparent in Fig. 2. Even though all of these articles report the percentage of participants meeting the physical activity recommendations (most of them based on questionnaire research), those percent-ages differ greatly between studies and within countries. This means that population levels of physical activity in European adults are currently unknown.
The methodological variation in the current cross-European studies makes it difficult to compare the population levels of physical activity in terms of absolute numbers. However, since the geographical patterns seem to be reasonably consistent across studies, the identified studies might provide an judicious estimate of the rela-tive order of the countries within Europe, providing the opportunity to identify and target those countries that consistently show the lowest population levels of phys-ical activity. Acknowledging the inconclusive nature of this inference, these countries might include Ireland, Italy, Malta, Portugal, and Spain.
Strengths and limitations
This systematic literature review is the first - to our knowledge - to provide an overview of all available stud-ies reporting on the population levels of physical activity in adults across Europe. The main strength of this review is the thorough and systematic review process. A review protocol was written before the search was conducted, and adhered to throughout the review process. Combining the search for the four different reviews reduced the chances of missing articles, for example articles that did not explicitly define their target population. The search was performed in six databases, including a database spe-cialized in grey literature, and several additional search strategies were used. In addition, the article selection, data extraction and quality assessment were all conducted by two independent researchers.
Even though the search was performed in several data-bases and supplemented by additional search strategies, the possibility remains that articles have been missed. Related to this, the fact that we only included articles published in the English language might also have led to missing articles, although cross-European studies are likely to have been published in English.
For these systematic literature reviews, we chose to only include studies that included at least two European countries, because a 2010 WHO report had already identified all national surveillance systems and con-cluded that their results were not comparable between countries. Hence, national studies were excluded even if objective data was collected, which might have been bet-ter comparable. Although, comparisons of such national objective studies might have remained problematic due to differences in data processing across studies. Pooling, harmonizing and comparing available objectively mea-sured national population based physical activity data across Europe might be an opportunity worth exploring in future studies.
Of the twenty-five articles that were eligible for inclu-sion in this review, several reported on the same study sample. We decided to select one article per study to de-scribe the reported physical activity levels, to avoid pre-senting results from the same dataset twice. We selected these articles based on the information presented in the article and their similarities with the other articles. Ad-mittedly, these selection criteria are arbitrary. However, because the articles were based on the same data, it is not likely that including different articles would have re-sulted in different conclusions.
Results of joint reviews
This review was part of a cluster of four reviews, focus-ing on the variation in population levels of 1) sedentary time in youth [7], 2) sedentary time in adults [8], 3) physical activity in youth [9], and 4) physical activity in adults (the current review). In adults, more articles re-ported on physical activity than sedentary time, while this was the other way around for the youth articles. The youth reviews identified a larger number of articles for both behaviours, indicating cross-European studies are more often conducted in youth than in adults. The studies in adults and the sedentary time studies in youth predom-inantly used questionnaires, while the youth studies on physical activity used accelerometers more frequently. All four reviews displayed substantial variation in the assess-ment methods used and the reported outcome variables across studies, limiting their comparability.
Implications
The results of these reviews highlight the need for har-monisation and standardisation of the measurement methods used to assess population levels of physical ac-tivity in European countries, as these levels are currently unknown. Ideally, a cross-European surveillance system should be set up, with regular and state-of-the-art mea-sures of physical activity and sedentary behaviour (and their determinants) in youth and adults across Europe. Including objective measures such as accelerometers will
provide more valid and comparable estimates of physical activity levels, but might be challenging on such a large scale. Such a surveillance system could ensure the avail-ability and continuity of high-quality data and involve those countries that are currently absent in studies. This could be set-up by harmonising the existing national surveys, integrating these measures in the existing inter-national studies, or setting up a new cross-European monitoring system. The results of these surveillance ef-forts could be used to inform targeted interventions and public health campaigns, ultimately aiming to increase physical activity levels across Europe.
Conclusion
A valid overview of adult physical activity levels across Europe is currently lacking. Because of the large variety in the assessment methods used to assess physical activ-ity, the reported outcome variables and the presented physical activity levels per study, absolute physical activ-ity population levels in European adults are currently unknown. When ranking countries with available data, Ireland, Italy, Malta, Portugal, and Spain seemed to re-port less physical activity, but given the methodological limitations of such comparisons between countries, this observation should be treated with caution. Objective data in adults from cross-European studies is currently limited. These findings highlight the need for standard-isation of the measurement methods and data processing used to assess physical activity in Europe, and the added value of a cross-European surveillance system including state-of-the-art physical activity measurements.
Additional files
Additional file 1:The PRISMA checklist. (PDF 212 kb)
Additional file 2:The complete search string. (PDF 210 kb)
Additional file 3:Data extraction file. (XLSX 40 kb)
Additional file 4:Quality assessment file. (XLSX 14 kb)
Abbreviations
BMI:Body mass index; CS: Cross-sectional; DEDIPAC: Determinants of diet and physical activity; EB: Eurobarometer; Edu: Education; EN: England; ENERGY: EuropeaN energy balance Research to prevent excessive weight Gain among Youth; EPIC: European prospective investigation into cancer and nutrition; ESS: European social survey; EUPASS: European physical activity surveillance system; EYHS: European youth heart study; F: Females; GB: Great Britain; H: Hours; IPAQ: International physical activity questionnaire; IPEN: International physical activity and the environment network; IPS: International prevalence study; LT: Longitudinal; M: Males; MET: Metabolic equivalent; Min: Minutes; MPA: Moderate physical activity; MVPA: Moderate-to-vigorous physical activity; n.r: not reported; RoC: Republic of Cyprus; TCC: Turkish cypriot community; VPA: Vigorous physical activity; WHO: World Health Organization; WHS: World Health Survey; Yrs: Years
Acknowledgements Not applicable.
Funding
The preparation of this paper was supported by the DEterminants of DIet and Physical ACtivity (DEDIPAC) knowledge hub. This work is supported by the Joint Programming Initiative‘Healthy Diet for a Healthy Life’. The funding agencies supporting this work are (in alphabetical order of participating Member State): Belgium: Research Foundation–Flanders; France: Institut National de la Recherche Agronomique (INRA); Ireland: The Health Research Board (HRB); The Netherlands: The Netherlands Organisation for Health Research and Development (ZonMw); Norway: The Research Council of Norway, Division for Society and Health.
Availability of data and supporting materials Not applicable.
Authors’contributions
AL, LvH, and MV conducted the search, article selection, data extraction and quality assessment and drafted the manuscript. IH, JL, JSJ, AV, AK, AD, UE, BD, IDB, JB, HvdP conceptualized and designed the study. All authors were involved in critically revising the manuscript for important intellectual content and have read and approved the final manuscript.
Competing interests
The authors declare that they have no competing interests.
Consent for publication Not applicable.
Ethics Approval and Consent to Participate Not applicable.
Author details
1Department of Epidemiology and Biostatistics, VU University Medical Center, EMGO+ Institute for Health and Care Research, De Boelelaan 1089a, 1081 HV Amsterdam, The Netherlands.2Department of Public Health, Faculty of Medicine and Health Sciences, Ghent University, De Pintelaan 185, 9000 Ghent, Belgium.3Physical activity, Nutrition and Health Research Unit, Department of Movement and Sport Sciences, Faculty of Physical Education and Physical Therapy, Vrije Universiteit Brussel, Pleinlaan 2, 1050 Brussels, Belgium.4Department of Movement and Sport Sciences, Faculty of Medicine and Health Sciences, Ghent University, Watersportlaan 2, 9000 Ghent, Belgium.5TNO Expertise Centre Lifestyle, Schipholweg 77-89, 2316 ZL Leiden, The Netherlands.6Body@Work, EMGO+ Institute for Health and Care Research, VU University Medical Center, van der Boechorststraat 7, 1081 BT Amsterdam, The Netherlands.7Department of Sports Medicine, Norwegian School of Sport Sciences, Ullevål Stadion, PO Box 40140806 Oslo, Norway. 8Faculty of Sport Sciences, EA 4360 APEMAC, University of Lorraine, 30 rue du Jardin Botanique, CS 30156, 54600, Villers-lès-Nancy cedex, Nancy, France. 9Department of Social Medicine, CAPHRI School for Public Health and Primary Care, Maastricht University, PO BOX 6166200MD Maastricht, The Netherlands.10Department of Physical Education and Sport Sciences, Centre for Physical Activity and Health Research, University of Limerick, Limerick, Ireland.11Department of Public and Occupational Health, VU University Medical Center, EMGO Institute for Health and Care Research, van der Boechorststraat 7, 1081 BT Amsterdam, The Netherlands.12Sydney School of Public Health, The Charles Perkins Centre (D17), University of Sydney, 2006, NSW, Sydney, Australia.
Received: 2 December 2015 Accepted: 11 June 2016
References
1. World Health Organization. Global Recommendations on Physical Activity for Health. World Health Organization; 2010.
2. World Health Organization. Global Health Risk: mortality and burden of disease attributable to selected major risks. World Health Organization; 2009.
3. Lee IM, Shiroma EJ, Lobelo F, Puska P, Blair SN, Katzmarzyk PT. Effect of physical inactivity on major non-communicable diseases worldwide: an analysis of burden of disease and life expectancy. The Lancet. 2012;380: 219–29.
4. Hallal PC, Andersen LB, Bull FC, Guthold R, Haskell W, Ekelund U. Global physical activity levels: surveillance progress, pitfalls, and prospects. The Lancet. 2012;380:247–57.
5. Lakerveld J, van der Ploeg HP, Kroeze W, Ahrens W, Allais O, Andersen LF, et al. Towards the integration and development of a cross-European research network and infrastructure: the DEterminants of DIet and Physical ACtivity (DEDIPAC) Knowledge Hub. Int J Behav Nutr Phys Act. 2014;11:143. 6. WHO Regional Office for Europe. Review of physical activity surveillance
data sources in European Union Member States. World Health Organization; 2010.
7. Verloigne M, Loyen A, Van Hecke L, Lakerveld J, Hendriksen I, De Bourdeaudhuij I, et al. Variation in population levels of sedentary time in European children and adolescents: a systematic literature review within DEDIPAC. Int J Behav Nutr Phys Act. (Submitted; under revision). doi:10. 1186/s12966-016-0395-5.
8. Loyen A, Verloigne M, Van Hecke L, Hendriksen I, Lakerveld J, Steene-Johannessen J, et al. Variation in population levels of sedentary time in European adults: a systematic literature review within DEDIPAC. Int J Behav Nutr Phys Act. (Submitted; under revision). doi:10.1186/s12966-016-0397-3. 9. Van Hecke L, Loyen A, Verloigne M, Van der Ploeg H, Lakerveld J, Brug J, et
al. Variation in population levels of physical activity in European children and adolescents: a systematic literature review within DEDIPAC. Int J Behav Nutr Phys Act. (Submitted; under revision). doi:10.1186/s12966-016-0396-4. 10. Centre for Reviews and Dissemination. Systematic reviews: CRD’s guidance for undertaking reviews in health care. University of York, York: CRD; 2008. 11. Centre for Reviews and Dissemination: PROSPERO database. http://www.crd.
york.ac.uk/PROSPERO (2015). Accessed 2 May 2016.
12. Council of Europe: our member states. http://www.coe.int/en/web/about-us/our-member-states (2015). Accessed 2 May 2016.
13. Kmet LM, Lee RC, Cook LS. Standard quality assessment criteria for evaluating primary research papers from a variety of fields. Alberta Heritage Foundation for Medical Research; 2004.
14. Friedenreich CM, Neilson HK, Lynch BM. State of the epidemiological evidence on physical activity and cancer prevention. Eur J Cancer. 2010;46: 2593–604.
15. Rutten A, Abu-Omar K. Prevalence of physical activity in the European Union. Soc Prev Med. 2004;49.
16. Sjostrom M, Oja P, Hagstromer M, Smith BJ, Bauman A. Health-enhancing physical activity across European Union countries: the Eurobarometer study. J Public Health. 2006;14:291–300.
17. European Commission. Special Eurobarometer 246/Wave EB 64.3: Health and Food. European Commission; 2006.
18. Gerovasili V, Agaku IT, Vardavas CI, Filippidis FT. Levels of physical activity among adults 18–64 years old in 28 European countries. Prev Med. 2015;81:87–91.
19. Bauman A, Bull F, Chey T, Craig CL, Ainsworth BE, Sallis JF, et al. The International Prevalence Study on Physical Activity: results from 20 countries. Int J Behav Nutr Phys Act. 2009;6:21.
20. Ding D, Adams MA, Sallis JF, Norman GJ, Hovell MF, Chambers CD, et al. Perceived neighborhood environment and physical activity in 11 countries: do associations differ by country? Int J Behav Nutr Phys Act. 2013;10:57. 21. Sallis JF, Bowles HR, Bauman A, Ainsworth BE, Bull FC, Craig CL, et al.
Neighborhood environments and physical activity among adults in 11 countries. Am J Prev Med. 2009;36:484–90.
22. Kahan D. Adult physical inactivity prevalence in the Muslim world: Analysis of 38 countries. Prev Med Rep. 2015;2:71–5.
23. Papandreou C, Tuomilehto H. Coronary heart disease mortality in relation to dietary, lifestyle and biochemical risk factors in the countries of the Seven Countries Study: a secondary dataset analysis. J Hum Nutr Diet. 2014;27: 168–75.
24. Haftenberger M, Schuit AJ, Tormo MJ, Boeing H, Wareham N, Bueno-de-Mesquita HB, et al. Physical activity of subjects aged 50–64 years involved in the European Prospective Investigation into Cancer and Nutrition (EPIC). Public Health Nutr. 2002;5:1163–76.
25. Lahmann PH, Friedenreich C, Schulz M, Cust AE, Lukanova A, Kaaks R, et al. Physical activity and ovarian cancer risk: the European Prospective Investigation into Cancer and Nutrition. Cancer Epidemiol Biomarkers Prev. 2009;18:351–4.
26. Cerin E, Cain KL, Conway TL, Van Dyck D, Hinckson E, Schipperijn J, et al. Neighborhood environments and objectively measured physical activity in 11 countries. Med Sci Sports Exerc. 2014;46:2253–64.
27. Van Dyck D, Cerin E, De Bourdeaudhuij I, Hinckson E, Reis RS, Davey R, et al. International study of objectively measured physical activity and sedentary time with body mass index and obesity: IPEN adult study. Int J Obes (Lond). 2015;39:199–207.
28. Atkinson K, Lowe S, Moore S. Human development, occupational structure and physical inactivity among 47 low and middle income countries. Prev Med Rep. 2016;3:40–5.
29. Guthold R, Ono T, Strong KL, Chatterji S, Morabia A. Worldwide variability in physical inactivity a 51-country survey. Am J Prev Med. 2008;34:486–94. 30. Alkerwi A, Schuh B, Sauvageot N, Zannad F, Olivier A, Guillaume M, et al.
Adherence to physical activity recommendations and its associated factors: an interregional population-based study. Journal of Public Health Research. 2015;4.
31. Bamana A, Tessier S, Vuillemin A. Association of perceived environment with meeting public health recommendations for physical activity in seven European countries. J Public Health (Oxf). 2008;30:274–81.
32. Bourdeaudhuij ID, Teixeira PJ, Cardon G, Deforche B. Environmental and psychosocial correlates of physical activity in Portuguese and Belgian adults. Public Health Nutr. 2007;8.
33. Hughes J, Kabir Z, Bennett K, Hotchkiss JW, Kee F, Leyland AH, et al. Modelling Future Coronary Heart Disease Mortality to 2030 in the British Isles. PLoS One. 2015;10, e0138044.
34. Jimenez-Pavon D, Fernandez-Alvira JM, te Velde SJ, Brug J, Bere E, Jan N, et al. Associations of parental education and parental physical activity (PA) with children's PA: the ENERGY cross-sectional study. Prev Med. 2012;55:310–4.
35. Lakerveld J, Ben Rebah M, Mackenbach JD, Charreire H, Compernolle S, Glonti K, et al. Obesity-related behaviours and BMI in five urban regions across Europe: sampling design and results from the SPOTLIGHT cross-sectional survey. BMJ Open. 2015;5, e008505.
36. Marques A, Sarmento H, Martins J, Saboga NL. Prevalence of physical activity in European adults - Compliance with the World Health Organization's physical activity guidelines. Prev Med. 2015;81:333–8. 37. Ortega FB, Konstabel K, Pasquali E, Ruiz JR, Hurtig-Wennlof A, Maestu J, et al.
Objectively measured physical activity and sedentary time during childhood, adolescence and young adulthood: a cohort study. PLoS One. 2013;8, e60871.
38. Sallis JF, Saelens BE. Assessment of physical activity by self-report: status, limitations, and future directions. Res Q Exerc Sport. 2000;71 Suppl 2:1–14. 39. Wijndaele K, Westgate K, Stephens SK, Blair SN, Bull FC, Chastin SF, et al.
Utilization and Harmonization of Adult Accelerometry Data: Review and Expert Consensus. Med Sci Sports Exerc. 2015;47:2129–39.
• We accept pre-submission inquiries
• Our selector tool helps you to find the most relevant journal • We provide round the clock customer support
• Convenient online submission • Thorough peer review
• Inclusion in PubMed and all major indexing services • Maximum visibility for your research
Submit your manuscript at www.biomedcentral.com/submit