R E S E A R C H
Open Access
Developing a prediction model for
customer churn from electronic banking
services using data mining
Abbas Keramati
1*, Hajar Ghaneei
2and Seyed Mohammad Mirmohammadi
3* Correspondence:[email protected] 1
Department of Industrial Engineering, Faculty of Engineering, University of Tehran, North Kargar, Tehran, Iran
Full list of author information is available at the end of the article
Abstract
Background:Given the importance of customers as the most valuable assets of organizations, customer retention seems to be an essential, basic requirement for any organization. Banks are no exception to this rule. The competitive atmosphere within which electronic banking services are provided by different banks increases the necessity of customer retention.
Methods:Being based on existing information technologies which allow one to collect data from organizations’databases, data mining introduces a powerful tool for the extraction of knowledge from huge amounts of data. In this research, the decision tree technique was applied to build a model incorporating this knowledge.
Results:The results represent the characteristics of churned customers.
Conclusions:Bank managers can identify churners in future using the results of decision tree. They should be provide some strategies for customers whose features are getting more likely to churner’s features.
Keywords:Customer churn, Data mining, Electronic banking services, Decision tree, Classification
Background
Emphasizing the higher costs associated with attracting new customers compared with retaining existing customers, and the fact that long-term customers tend to produce more profits, Verbeke et al. (2011) assert that customer retention increases profitability. Many competitive organizations have realized that a key strategy for survival within the industry is to retain existing customers. Tsai and Chen (2010) argued that“this leads to the importance of churn management.”
Customer churn represents a basic problem within the competitive atmosphere of banking industry.
According to Nie et al. (2011), a bank can increase its profits by up to 85 % by improving the retention rate by up to 5 %. In addition, customer retention is seen as more important than in the past. This survey seeks to identify common charac-teristics of churned customers in order to build a customer churn prediction model.
Literature review Customer churn
According to Sharma and Panigrahi (2011), churning refers to a customer who leaves one company to go to another company.
Customer churn introduces not only some loss in income but also other negative effects on the operation of companies (Chen et al. 2014). As Hadden et al. (2005) stipu-lated, “Churn management is the concept of identifying those customers who are intending to move their custom to a competing service provider.”
Risselada et al. (2010) stated that churn management is becoming part of customer rela-tionship management. It is important for companies to consider it as they try to establish long-term relationships with customers and maximize the value of their customer base.
Data mining
Data mining refers to the discovery of knowledge from a huge amount of data (Nie et al. 2011). Tsai and Lu (2009) described data mining as discovering interesting pat-terns within the data and predicting or classifying the behavior exhibited by the model. Seng and Chen (2010) suggested that the basic challenge is how to convert seemingly meaningless data into useful information and competitive intelligence.
Data mining in customer churn
Tsai and Lu (2009) stipulated that “in literature, statistical and data mining techniques have been used to create the prediction models.” Classification tools are often used to model and predict customer churn. Some of the techniques commonly used to achieve this are neural networks, decision trees (DT), random forests, support vector machines (SVM) and logistic regression (Miguéis et al. 2012).
Electronic banking
Liébana-Cabanillas et al. (2013) recognized electronic banking portals as initial alterna-tive channels to the traditional bank branches. They mentioned many advantages of electronic banking; these include convenient and global access, availability, time- and cost-saving, wider choices of services, information transparency, customization, and financial innovation.
Related works
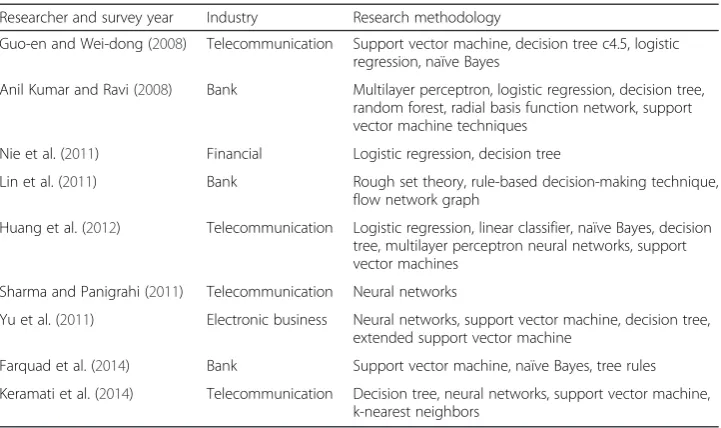
and variables). They further showed how rules and different kinds of churn are related. Sharma and Panigrahi (2011) applied neural networks to predict customer churn from cellular network services. The results indicated that neural networks could predict customer churn with an accuracy of higher than 92 %. Saradhi and Palshikar (2011) compared machine learning techniques used to build an employee churn prediction model. Yu et al. (2011) applied neural network, SVM, DT, and extended SVM (ESVM) techniques to fore-cast customer churn. Of the methods studied, ESVM performed best. Huang et al. (2012) presented new-features-based logistic regression (LR), linear classifier (LC), NB, DT, MLP neural networks, and SVM. In their experiments, each technique produced a different output. Data mining by evolutionary learning (DMEL) could show the reason or probability of a churning phenomenon; DT, however, could only show the reason. LR, NB, and MLP could provide probabilities of different customer behaviors. LC and SVM could distinguish between a churner and a non-churner. Farquad et al. (2014) used SVM to predict customer churn from bank credit cards. They introduced a hybrid approach to extract rules from SVM for customer relationship management purposes. The approach is composed of three phases where: 1) SVM-recursive feature elimination is applied to reduce the feature set; 2) the obtained dataset is used to build the SVM model; and 3) using NB, tree rules are generated. Keramati et al. (2014) not only presented different approaches to data mining and classification methods such as DT, neural networks, SVM, and k-nearest neighbors, but also had the performances of these approaches compared. They analyzed, as a case study, data from an Iranian mobile company. These studies are summarized in Table 1.
Customer churn analysis framework
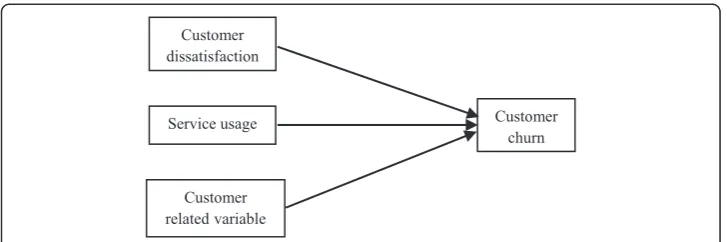
The present researcher’s conceptual model is based on a model previously proposed by Keramati and Ardabili (2011). Due to limitations of available data in the bank’s database, only customer dissatisfaction, level of service usage, and customer-related variables have been investigated in the present study. These factors are shown in Fig. 1.
Table 1Related works
Researcher and survey year Industry Research methodology
Guo-en and Wei-dong (2008) Telecommunication Support vector machine, decision tree c4.5, logistic regression, naïve Bayes
Anil Kumar and Ravi (2008) Bank Multilayer perceptron, logistic regression, decision tree, random forest, radial basis function network, support vector machine techniques
Nie et al. (2011) Financial Logistic regression, decision tree
Lin et al. (2011) Bank Rough set theory, rule-based decision-making technique, flow network graph
Huang et al. (2012) Telecommunication Logistic regression, linear classifier, naïve Bayes, decision tree, multilayer perceptron neural networks, support vector machines
Sharma and Panigrahi (2011) Telecommunication Neural networks
Yu et al. (2011) Electronic business Neural networks, support vector machine, decision tree, extended support vector machine
Farquad et al. (2014) Bank Support vector machine, naïve Bayes, tree rules
Customer dissatisfaction
Keramati and Ardabili (2011) defined customer satisfaction as“an experience-based as-sessment that stems from the degree to which customer expectations about characteris-tics of the service have been fulfilled.” As elements of satisfaction within the scope of electronic banking, Kumbhar (2011) referred to “perceived value, brand perception, cost effectiveness, ease of use, convenience, problem handling, security/assurance, responsiveness, contact facilities, system availability, fulfillment, efficiency and compen-sation.” In their study, Keramati and Ardabili (2011) analyzed customer churn across an Iranian mobile network operator. They used service failure rate, length of customer association, and customer complaints to evaluate the level of dissatisfaction across the operator’s database.
Accordingly, considering the limitations in the available data in the bank’s database, in this research, length of customer association and customer complaints were used to evaluate level of customer’s dissatisfaction.
Level of service usage
In this research, the number and value amount of transactions undertaken via electronic banking portals such as internet bank, unstructured supplementary service data (USSD) commands, telephone bank, mobile bank, and ATM were extracted from bank’s database.
Customer demographic variables
Clemes et al. (2010) listed customer-related demographic variables (e.g., income, age, education, culture, and nationality). They further suggested that the customer’s occupa-tion may affect his or her use of electronic banking channels. Buckinx and Van den Poel (2005) investigated the effect of gender as a customer demographic variable.
Considering the limitations in the available data in the bank’s database, in this research, age, gender, level of education, and career were used to evaluate customer demographic variables.
Methods CRISP-DM
We used CRISP-DM to build a customer churn prediction model. In this methodology, a 6-phase approach was used:
1. Business understanding 2. Data understanding 3. Data preprocessing 4. Modeling
5. Evaluation 6. Deployment
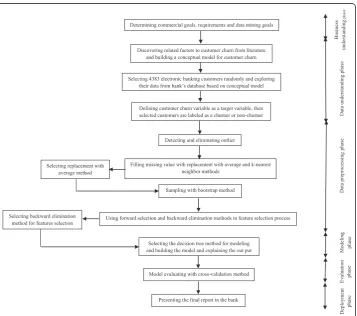
The research methodology was followed through the steps shown in Fig. 2.
To identify the characteristics of churned customers, we used the DT method in the modeling phase of CRISP-DM.
Data mining techniques
According to Han et al. (2012), in data mining, the predictive analysis task is undertaken via regression and classification techniques. They introduced classification as a process of find-ing a model that explains and recognizes data classes or concepts. This model is derived from the training dataset. The training data refer to the data objects whose class labels are known. The model can then be used to predict class labels of objects with unknown labels.
Decision tree
When an instance is classified by a DT model, the DT sorts it through the tree to the suitable leaf node. Each leaf node shows a classification (Tsai and Chen 2010). Nie et al.
(2011) suggested that the DT not only produces results which are easy to understand, but that it also has the ability to build models using numerical and categorical datasets.
In the present research, DT techniques were applied to build a prediction model for customer churn from electronic banking services for two reasons.
One reason relates to our goal of finding the features of churners and our need to understand if-then rules for this goal. Due to DT provides easy understanding rules, DT technique was selected for modeling phase. The other reason is the type of our data. Our data include numerical and categorical types and DT was suitable for these types of data. Therefor DT was applied for the modeling phase.
Results and discussion
It is necessary to note that any research focuses on one or more steps or sub-steps of the CRISP methodology, depending on the underlying research theme. The CRISP methodology steps are described as follows.
1. Business understanding phase
Zan et al. (2007) demonstrated that business understanding can be established via understanding the goals and data mining requirements.
Commercial objectives of this study include the discovery of common characteristics of churned customers from electronic banking services.
In the present survey, financial, human, and scientific resources are used. In order to accomplish this commercial objective, DT was used in the modeling phase. The results of the model represent the features of the churners.
2. Data understanding phase
Zan et al. (2007) stated that for this phase it is necessary to“determine what data is available to solve your business needs.”In the present survey, we randomly sampled 4383 customers of electronic banking services from the bank’s database. The extracted data covered the time interval between March 21st, 2013, and March 20th, 2015.
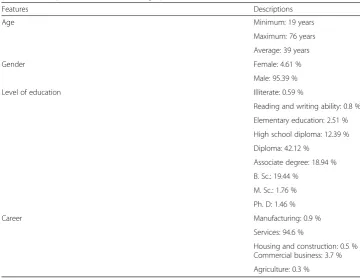
In this research, career is treated as a nominal variable, while gender, complaint, and churn are taken as binomial variables. Gender accepts either of two statuses: male or female, with 0 referring to a female customer and 1 to a male customer. A customer that had no transactions through electronic banking portals for at least the two years prior to the end of the research time period is considered to be a churner. For the customer churn variable, 1 refers to a churner and 0 to a non-churner. Education level was parameterized as an ordinal variable while the remaining variables were treated as discrete numerical variables. The dataset is shown in Tables2,3,4and5.
Data preprocessing phase
The variables (except complaint) were used in this phase. As highlighted by Han et al. (2012),“data cleaning routines attempt to fill in missing values, smooth out noise, identify outliers, and correct inconsistencies within the data.” In this research, we detected and eliminated outliers. Furthermore, we used two methods to fill in missing values: 1) replacing missing values with the average value of the corresponding variable; and 2) using k-nearest neighbor (k = 5). Considering the numbers of churners and non-churners (63 and 4320 customers, respectively), this is an imbalanced data problem. To solve it we used a bootstrap sampling module in the RapidMiner data mining software. In this method, random sampling with replacement is performed to take samples of customer records. In order to select the best method for data cleaning, we followed a DT approach to evaluate the results. The depth of the DT was set to 20; also, we used a gini index in the DT setting.
Gini index is one of the attribute selection measures in DT for choosing the attribute that discriminates the tuples in best case according class (Han et al. 2012). The split validation operator was then applied to this DT. The original dataset is divided into two subsets, namely, training (containing 70 % of the data) and testing (containing
Table 2Descriptions of customer demographic data
Features Descriptions
Age Minimum: 19 years
Maximum: 76 years
Average: 39 years
Gender Female: 4.61 %
Male: 95.39 %
Level of education Illiterate: 0.59 %
Reading and writing ability: 0.8 %
Elementary education: 2.51 %
High school diploma: 12.39 %
Diploma: 42.12 %
Associate degree: 18.94 %
B. Sc.: 19.44 %
M. Sc.: 1.76 %
Ph. D: 1.46 %
Career Manufacturing: 0.9 %
Services: 94.6 %
Housing and construction: 0.5 % Commercial business: 3.7 %
Agriculture: 0.3 %
Table 3Descriptions of level of service usage data
Features Descriptions
Number and amount of transactions through ATM Missing data: 3 (in number of transactions)
Number and amount of transactions through USSD-based mobile banking
Missing data: 0
Number and amount of transactions through mobile bank Missing data: 0
Number and amount of transactions through telephone bank Missing data: 0
30 % of the data). The purpose here is to compare different methods used for cleaning the data. The results are shown in Table 6. Accuracy, precision, recall and F-measure will be defined in the fifth phase.
As indicated by similar results shown in Table 6, we could equally have chosen either of the compared methods. We chose to replace missing values with the average value of the corresponding variable.
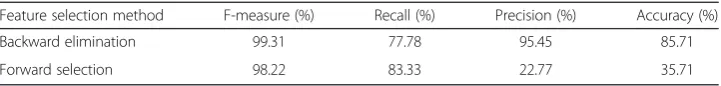
Han et al. (2012) introduced forward selection and backward elimination methods for feature subset selection. They defined forward selection as a procedure that starts with an empty set as the reduced set. At each step, the best of the remaining features are determined and added into the reduced set. They defined backward elimination as a procedure that starts with a full attributes set. At each step, the worst remaining attri-butes are removed from the set.
In the present study, we used forward selection and backward elimination methods for feature selection. These methods were compared using evaluation indicators, and the backward elimination method was selected. The results of evaluating these methods are shown in Table 7.
The backward elimination method was selected based on the results that showed in Table 7. The output of the backward elimination method indicated that career was redundant, so this feature was omitted from the dataset.
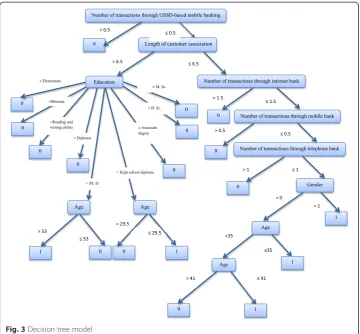
Modeling phase
As indicated by Larose (2005), in this phase, an appropriate modeling technique is selected and applied. We calibrated model setting to optimize the results. Figure 3 demonstrates the best achieved model among (DT) models.
This model categorized the characteristics of churned customers into five groups. We can use this model to predict customer churn from electronic banking services based on their common characteristics.
Evaluation phase
Larose (2005) said that in this phase one should “evaluate the one or more models delivered in the modeling phase for quality and effectiveness before deploying them for use in the field.” For defining model evaluation parameters, we defined the following terms according to Keramati et al. (2014):
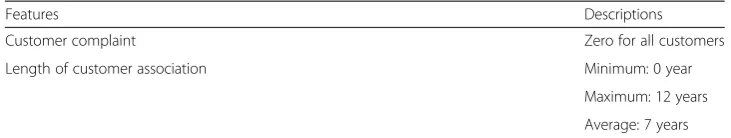
Table 4Descriptions of customer dissatisfaction data
Features Descriptions
Customer complaint Zero for all customers
Length of customer association Minimum: 0 year
Maximum: 12 years
Average: 7 years
Table 5Descriptions of customer churn
Feature Descriptions
Customer churn Churner: 1.44 %
True negative (TN) refers to the number of negative tuples that were labeled correctly by the classifier.
False positive (FP) refers to the number of negative tuples that were incorrectly labeled as positive.
False negative (FN) refers to the number of positive tuples that were incorrectly labeled as negative.
True positive (TP) refers to the positive tuples that were labeled correctly as positive.
A confusion matrix includes information about actual and predicted classifications. The confusion matrix has two dimensions: one indexed by the actual class and the other indexed by the class predicted by the classifier (Deng et al. 2016). According to Keramati et al. (2014), the confusion matrix can be shown as in Fig. 4.
Maratea et al. (2014) defined Accuracy as “the probability of success in recognizing the right class of an instance.”
They also definedPrecision as“the probability that a predicted positive class instance is a true positive” and explained Recallas “the probability of success in recognizing a positive class instance.” They further introduced F-measure, which is “the harmonic mean of precision and recall and tends towards the lower of the two.”
Based on the confusion matrix, evaluation indicators are defined as follows (Han et al. 2012).
Accuracy ¼ TNþTP
TNþFNþTPþFP ð1Þ
Precision ¼ TP
TPþFP ð2Þ
Recall ¼ TP
FNþTP ð3Þ
F–Measure ¼ 2 Recall Precision
RecallþPrecision ð4Þ
One of the useful statistical tools for describing the classifier performance is the re-ceiver operating characteristic (ROC) curve. Furthermore, one of the most popular measures for evaluating the power of a predictive model is the area under the curve (AUC). Gigliarano et al. (2014) defined AUC as “the integrated true positive rate over all false positive rate values.”AUC takes a value between 0 and 1.
Table 6Results of evaluating after preprocessing phase
Missing values Sampling Accuracy (%) Precision (%) Recall (%) F-measure (%)
Noise & Outliers were detected and eliminated
Replace (AVG) Bootstrap 99.31 72.22 86.67 78.79
Impute (k = 5) 99.31 72.22 86.67 78.79
Table 7Results of evaluating feature selection methods
Feature selection method F-measure (%) Recall (%) Precision (%) Accuracy (%)
Backward elimination 99.31 77.78 95.45 85.71
We use k-fold cross validation to estimate the model’s accuracy or compare perfor-mances of two classification algorithms. This method divides a dataset into k folds of nearly equal sizes. Each fold is in turn used to test the model that provided with other 1 folds by a classification algorithm. The average of the k accuracies obtained from k-fold cross validation is taken as the performance of the corresponding classification algorithm (Wong 2015).
In this research, in order to enhance the model evaluation, we use a cross-validation method with k = 10. All of the tuples in the dataset are used for training and testing the model in this method.
The best results in terms of evaluation indicators are shown in Table 8. Fig. 3Decision tree model
NO YES
FN YES TP
TN FP
NO Actual class
Predicted class
Deployment phase
We presented the final report to the bank and the bank’s experts are now implementing the report.
Conclusion
We implemented the CRISP methodology for predicting customer churn in electronic banking services. The aim of the present study is to identify the features of churners from electronic banking services. Demographic variables (e.g., age, gender, career, and level of education), transaction data through electronic banking portals (e.g., ATM, mobile bank, telephone bank, internet bank, and USSD-based mobile banking), the length of the cus-tomer association, and cuscus-tomer complaints were extracted from the bank’s database.
Forward selection and backward elimination methods were applied for feature subset selection after data cleaning.
The backward elimination method performed better. This method showed that the career variable was redundant and so it was omitted from the dataset. The DT method was applied for the modeling of this dataset.
The results of the DT model showed the features of the churners. These groups of churners are given by the following:
1. If number of transactions through USSD-based mobile banking≤0.5 and length of customer association≤6.5 and number of transactions through internet bank≤1.5 and number of transactions through mobile bank≤0.5 and number of transactions through telephone bank≤1 and gender = 1→Churn
2. If number of transactions through USSD-based mobile banking≤0.5 and length of customer association≤6.5 and number of transactions through internet bank≤1.5 and number of transactions through mobile bank≤0.5 and number of transactions through telephone bank≤1 and gender = 0 and age≤35→Churn
3. If number of transactions through USSD-based mobile banking≤0.5 and length of customer association≤6.5 and number of transactions through internet bank≤1.5 and number of transactions through mobile bank≤0.5 and number of transactions through telephone bank≤1 and gender = 0 and 35< age≤41→Churn
4. If number of transactions through USSD-based mobile banking≤0.5 and length of customer association >6.5 and education level = high school diploma and age≤29.5→ Churn
5. If number of transactions through USSD-based mobile banking≤0.5 and length of customer association >6.5 and education level = Ph. D and age >53→Churn
From our literature review, use of data mining techniques for predicting customer churn is new in the electronic banking context. Data collection and feature selection for predicting customer churn in the electronic banking services context is one of the novel aspects of the present research.
Table 8Results of evaluation
Accuracy (%) Precision (%) Recall (%) F-measure (%) AUC
It is expected that, with a better understanding of the features of churners, bank managers can consider some strategies to prevent churn. These strategies should be used for customers whose features are growing more similar to the churner groups identified above. These strategies can include providing required facilities, improving the quality of services, identifying the needs of different groups, and increasing cus-tomer responsiveness.
Limitations and future research
The use of the bank’s database imposed some limitations on the present study. For example, we could examine only the factors that were recorded in the bank’s database. In addition, due to the large volume of data stored in the database and the associated privacy issues, it was time-consuming to extract all the data. Future research will further investi-gate the implementation results and will also identify customer requirements using differ-ent techniques and propose some methods to prevdiffer-ent them from churning. We will perform qualitative research to find the reasons for churn in the churner groups.
Acknowledgement in Cover letter (double blind review)
We would like to thank bank’s experts that extracted data from bank’s database.
Authors’contributions in Cover letter (double blind review)
AK reviewed the manuscript and gave recommendation for improvements. HG carried out the data analysis and wrote the manuscript. SMM reviewed the manuscript. All authors have read and approved the final manuscript.
Competing interests in Cover letter (double blind review) The authors declare that they have no competing interests.
Author details 1
Department of Industrial Engineering, Faculty of Engineering, University of Tehran, North Kargar, Tehran, Iran.
2Department of Management Business Administration, Payame Noor University, Damavand Branch, Tehran, Iran. 3
Department of Management Business Administration, Payame Noor University, West Tehran Branch, Tehran, Iran.
Received: 29 January 2016 Accepted: 13 August 2016
References
Anil Kumar D, Ravi V (2008) Predicting credit card customer churn in banks using data mining. Int J Data Anal Tech Strateg 1(1):4–28
Buckinx W, Van den Poel D (2005) Customer base analysis: partial defection of behaviourally loyal clients in a non-contractual FMCG retail setting. Eur J Oper Res 164:252–268
Chen SC, Huang MY (2011) Constructing credit auditing and control & management model with data mining technique. Expert Syst Appl 38:5359–5365
Chen K, Hu Y-H, Hsieh Y-C (2014) Predicting customer churn from valuable B2B customers in the logistics industry: a case study. IseB 13:475–494. doi:10.1007/s10257-014-0264-1
Clemes MD, Gan C, Zhang D (2010) Customer switching behaviour in the chinese retail banking industry. Int J Bank Mark 28(7):519–546
Deng X, Liu Q, Deng Y, Mahadevan S (2016) An improved method to construct basic probability assignment based on the confusion matrix for classification problem. Inf Sci 340–341:250–161
Farquad MAH, Ravi V, Raju SB (2014) Churn prediction using comprehensible support vector machine:An analytical CRM application. Appl Soft Comput 19:31–40
Gigliarano C, Figini S, Muliere P (2014) Making classifier performance comparisons when ROC curves intersect. Comput Stat Data Anal 77:300–312
Guo-en X, Wei-dong J (2008) Model of customer churn prediction on support vector machine. Syst Eng Theory Pract 28(1):71–77
Hadden J, Tiwaria A, Roy R, Ruta D (2005) Computer assisted customer churn management: State-of-the-art and future trends. Comput Oper Res 34:2902–2917
Han J, Kamber M, Pei J (2012) DATA MINING Concepts and Techniques, 3rd edn. Morgan Kaufmann, USA
Huang B, Kechadi MT, Buckley B (2012) Customer churn prediction in telecommunications. Expert Syst Appl 39:1414–1425 Keramati A, Ardabili SMS (2011) Churn analysis for an Iranian mobile operator. Telecommun Policy 35:344–356 Keramati A, Jafari-Marandi R, Aliannejadi M, Ahmadian I, Mozzafari M, Abbasi U (2014) Improved churn prediction in
telecommunication industry using data mining techniques. Appl Soft Comput 24:994–1012
Kumbhar VM (2011) Factors affecting the customer satisfaction in e-banking: some evidences from Indian banks. Manag Res Pract 3(4):1–14
Liébana-Cabanillas F, Nogueras R, Herrera LJ, Guillén A (2013) Analysing user trust in electronic banking using data mining methods. Expert Syst Appl 40:5439–5447
Lin C-S, Tzeng G-H, Chin Y-C (2011) Combined rough set theory and flow network graph to predict customer churn in credit card accounts. Expert Syst Appl 38:8–15
Maratea A, Petrosino A, Manzo M (2014) Adjusted F-measure and kernel scaling for imbalanced data learning. Inf Sci 257:331–341
Miguéis VL, Van den Poel D, Camanho AS, Falcão e Cunha J (2012) Modeling partial customer churn: On the value of first product-category purchase sequences. Expert Syst Appl 39:11250–11256
Nie G, Rowe W, Zhang L, Tian Y, Shi Y (2011) Credit card churn forecasting by logistic regression and decision tree. Expert Syst Appl 38:15273–15285
Risselada H, Verhoef PC, Bijmolt THA (2010) Staying power of churn prediction models. J Interact Mark 24:198–208 Saradhi VV, Palshikar GK (2011) Employee churn prediction. Expert Syst Appl 38:1999–2006
Seng J-L, Chen TC (2010) An analytic approach to select data mining for business decision. Expert Syst Appl 37:8042–8057 Sharma A, Panigrahi PK (2011) A neural network based approach for predicting customer churn in cellular network
services. Int J Comput Appl 27(11):26–31
Tsai C-F, Chen M-Y (2010) Variable selection by association rules for customer churn prediction of multimedia on demand. Expert Syst Appl 37:2006–2015
Tsai C-F, Lu Y-H (2009) Customer churn prediction by hybrid neural networks. Expert Syst Appl 36:12547–12553 Verbeke W, Martens D, Mues C, Baesens B (2011) Building comprehensible customer churn prediction models with
advanced rule induction techniques. Expert Syst Appl 38:2354–2364
Wong T-T (2015) Performance evaluation of classification algorithms by k-fold and leave-one-out cross validation. Pattern Recog 48:2839–2846
Yu X, Guo S, Guo J, Huang X (2011) An extended support vector machine forecasting framework for customer churn in e-commerce. Expert Syst Appl 38:1425–1430
Zan M, Shan Z, Li L, Ai-jun L (2007) A predictive model of churn in telecommunications based on data mining, IEEE International Conference on Control and Automation ThAl-2 Guangzhou., pp 809–813
Submit your manuscript to a
journal and benefi t from:
7Convenient online submission
7Rigorous peer review
7Immediate publication on acceptance
7Open access: articles freely available online
7High visibility within the fi eld
7Retaining the copyright to your article