Open Access
Methodology
Combining Google Earth and GIS mapping technologies in a dengue
surveillance system for developing countries
Aileen Y Chang*
1,2,3, Maria E Parrales
1, Javier Jimenez
4,
Magdalena E Sobieszczyk
2, Scott M Hammer
2, David J Copenhaver
3and
Rajan P Kulkarni*
3Address: 1Department of Vector-Borne Disease, Nicaraguan Ministry of Health, Managua, Nicaragua, 2Department of Infectious Disease, Columbia University, New York, NY, USA, 3Dengue Relief Foundation, Managua, Nicaragua and 4Department of Vector-Borne Disease, Nicaraguan Ministry of Health, Bluefields, Nicaragua
Email: Aileen Y Chang* - [email protected]; Maria E Parrales - [email protected]; Javier Jimenez - [email protected]; Magdalena E Sobieszczyk - [email protected]; Scott M Hammer - [email protected]; David J Copenhaver - [email protected]; Rajan P Kulkarni* - [email protected]
* Corresponding authors
Abstract
Background: Dengue fever is a mosquito-borne illness that places significant burden on tropical developing countries with unplanned urbanization. A surveillance system using Google Earth and GIS mapping technologies was developed in Nicaragua as a management tool.
Methods and Results: Satellite imagery of the town of Bluefields, Nicaragua captured from Google Earth was used to create a base-map in ArcGIS 9. Indices of larval infestation, locations of tire dumps, cemeteries, large areas of standing water, etc. that may act as larval development sites, and locations of the homes of dengue cases collected during routine epidemiologic surveying were overlaid onto this map. Visual imagery of the location of dengue cases, larval infestation, and locations of potential larval development sites were used by dengue control specialists to prioritize specific neighborhoods for targeted control interventions.
Conclusion: This dengue surveillance program allows public health workers in resource-limited settings to accurately identify areas with high indices of mosquito infestation and interpret the spatial relationship of these areas with potential larval development sites such as garbage piles and large pools of standing water. As a result, it is possible to prioritize control strategies and to target interventions to highest risk areas in order to eliminate the likely origin of the mosquito vector. This program is well-suited for resource-limited settings since it utilizes readily available technologies that do not rely on Internet access for daily use and can easily be implemented in many developing countries for very little cost.
Background
Dengue and dengue hemorrhagic fever (DF/DHF) cause significant morbidity and mortality in tropical urban
areas. Epidemics of this mosquito borne illness are on the rise worldwide due to increased international travel and unplanned urbanization combined with lack of effective
Published: 23 July 2009
International Journal of Health Geographics 2009, 8:49 doi:10.1186/1476-072X-8-49
Received: 27 May 2009 Accepted: 23 July 2009
This article is available from: http://www.ij-healthgeographics.com/content/8/1/49
© 2009 Chang et al; licensee BioMed Central Ltd.
mosquito control measures in tropical developing coun-tries. According to Gubler, there are an estimated 50–100 million dengue infections annually, 5 million DHF cases requiring hospitalization, and 20–25,000 deaths (mainly in children) [1]. As there is currently no effective vaccine for the virus, control measures rely heavily on vector reduction.
In Nicaragua, vector control begins at the municipality level where public health workers from the Ministry of Health survey homes to calculate the mosquito infesta-tion level per neighborhood and identify sites of potential larval development. Mosquito breeding sites can arise in any site with standing water and commonly occur in areas without running water because people often store large uncovered barrels of water around their homes for bath-ing and drinkbath-ing. In addition to areas around the home, communal areas such as churches and schools also house large barrels of standing water that lend themselves to lar-val development and these areas of community gathering can lead to increased transmission of the virus. Standing water is also commonly found in abandoned properties, garbage dumps, and cemeteries where cement flower vases are routine fixtures for graves. Recent studies on the dispersal distance of Aedes aegypti indicate that the mos-quito generally travels a short distance from its site of release, especially when released indoors or in a dense environment [2]. Mosquitoes released outdoors (with few structures nearby) generally traveled less than 100 m from the release site with the majority recaptured within 60 m, while those released indoors were almost always recap-tured within 50 m of the release site [2]. For Bluefields, due to the density of houses and potential larval breeding areas, vector control is focused within a 50 m radius of homes of dengue patients and other hot spots, as the vast majority of mosquitoes are likely to be found at this radius from an identified breeding area.
Nicaragua, like many other developing countries, must deal with the burden of unplanned urbanization. This lack of urban planning has resulted in cities without dependable electricity, running water, sewage systems, paved streets, or a reliable address system. All of these fac-tors represent significant challenges for efficient control of vector-borne disease. The lack of street names and house numbers, for example, makes it difficult to accurately and precisely localize vulnerable sites and deploy necessary resources in an outbreak situation. In this situation, tools for geo-referencing locations by satellite may prove useful because they permit observers at the administrative level to analyze spatial relationships between areas with high levels of mosquito infestation and the locations of sites with a predilection for larval development such as garbage dumps or cemeteries. Resources can then be allocated to perform targeted clean-up of mosquito breeding sites
found within garbage piles on an abandoned lot, rather than carrying out widespread fumigation of an entire neighborhood, which has been shown to be ineffective in the control of dengue [3-5]. In addition, it has been shown that the use of geo-referencing saves time in iden-tifying locations when directing different groups of public health workers to return to problem areas to perform con-trol interventions [6].
Though satellite imagery has been available for many years, its uptake had been limited due to cost and quality issues, particularly for public health officials in develop-ing countries [7]. The advent of new mappdevelop-ing technolo-gies such as Google Earth that offers free satellite imagery and aerial photos of most of earth's land surface has lead to the increased uptake of mapping technology for use rel-evant to health [8-10]. The quality and resolution of the maps offered varies greatly, with better quality maps gen-erally available for Europe and North America, and with cloud cover or shadows sometimes obscuring ground fea-tures [9]. However, the resolution is still adequate to iden-tify individual homes in urban areas of most developing nations, including Nicaragua, and thus the Google Earth maps are of sufficient resolution for identifying dengue cases and likely sites of larval development to a 50 m radius or better.
Aside from providing these satellite maps, Google Earth (and Google Earth Pro) has limited map manipulation or analysis functions [11]. ArcGIS 9 ArcMap is a powerful GIS software that is commonly used by public health pro-fessionals for generation of geographical data and infor-mation. Additionally, ArcGIS is already available to many developing countries participating in the Global Fund for Tuberculosis, Malaria, and AIDS program. Our system incorporates maps from Google Earth into ArcGIS soft-ware for further viewing and analysis.
This paper describes the development of a low-cost map-ping and georeferencing system which does not rely on continuous access to Internet and was employed first in Bluefields, Nicaragua and then introduced throughout the country as part of a nation-wide initiative. Depending on the resolution of the available satellite imagery, our expe-rience could be replicated in other parts of the world to aid disease surveillance and control efforts, particularly for vector borne disease.
Methods
Overviewinfestation per neighborhood block to provide adminis-trators at the Ministry of Health with a visual tool to easily identify areas most in need of intervention.
Creation of the Satellite Base-Map
The Nicaraguan Health System is directed by the Ministry of Health (MINSA) in Managua. Health management is further sub-divided into 17 administrative groups known as SILAIS (Local Systems for the Integral Attention to Health), and each SILAIS is responsible for a group of municipalities (of 152 total). Bluefields is a municipality on the Atlantic coast with 13,174 homes. The municipal-ity of Bluefields was first identified using Google Earth 4.3 (Google, Inc. Mountain View, CA, USA) satellite imagery and the zoom feature was used to create maps with a res-olution of 60 cm per pixel; individual homes can be iden-tified at this resolution. This map of Bluefields was then divided into a grid using Google Earth grid overlay func-tion and captured Jpeg images of each grid square at this resolution to create a mosaic with snapshots of the entire municipality.
A complete picture of Bluefields was reconstructed in Arc-GIS 9 ArcMap software (ESRI, Redlands, CA USA) using the snapshot Jpeg images. Each image was manipulated and centered to ensure that all images were properly aligned to create a fluid composite picture. The spatial relationships among the images were pegged using con-trol points at the perimeter of the complete picture, which were then saved as an Erdas Imagine (.img) format utiliz-ing the rectify function of the software. The purpose of capturing snapshots of the satellite images in Google Earth and then reconstructing the picture in ArcGIS was so that future users could work with the complete satellite map without the necessity for an Internet connection, as a stable connection can be difficult to obtain in Bluefields.
Next, Erdas Imagine 9.3 (Erdas Inc, Atlanta, Georgia, USA) was utilized to further manipulate the reconstructed picture to create a more fluid transition between the com-ponent snapshots. This software is not required for pro-duction of the map since the mosaic can be fully constructed in ArcMap; however, we found that this pro-gram allowed for enhanced quality of transitions between images. The component snapshot images were cropped and organized in a mosaic and their orientations relative to each other were saved in an .img format. At the comple-tion of this step, the satellite map of Bluefields was one composite image.
Geo-Referencing of the Composite Map
To geo-reference this composite map, we recorded GPS coordinates at each corner of the map using a Garmin Etrex Summit handheld GPS unit (Garmin, Inc., Olathe, Kansas, USA). Four locations, corresponding to the
cor-ners, were visually identified on the composite satellite map. We then travelled to each of those locations and col-lected the geo-referenced coordinates in UTM format using the GPS units with an error of 5–6 m for each point. Internal consistency of the map was ensured by accurately aligning the snapshot images such that georeferencing of the four corners was sufficient to georeference the com-posite map to an error of 5–6 m. This precision was con-firmed as points collected by GPS units coincided with the home visually identified as the patient's home on the base-map. The coordinates were then entered into the Garmin Mapsource program supplied with the GPS units and the subsequent layer of points was saved as a .dxf file. We then converted this .dxf file into a shapefile using Arc-GIS. Each geo-referenced point was subsequently aligned to its location on the satellite image, allowing the user to identify the geographic coordinates of a location by sim-ply moving the cursor over that area. The final geo-refer-enced image was saved as an .img file.
Neighborhoods and individual blocks were delineated within the final geo-referenced satellite image map using the polygon function in ArcGIS. The neighborhood boundaries were determined by the municipality of Blue-fields many years ago and previous public health data is available by neighborhood. Each neighborhood or block was represented with a different polygon. The polygons were saved in a separate layer and superimposed over the satellite image map. Within the attributes table of the pol-ygon layer, information regarding each individual neigh-borhood was recorded, including access and intermittency of running water, population density, and indices of infestation of the Aedes aegypti mosquito responsible for transmitting the dengue virus. Each of these categories in the attributes table represents a risk fac-tor for the transmission of dengue.
Collection of Data Points and Creation of the Final Satellite Map
In addition to the above information collected per neigh-borhood block, public health workers also marked the locations likely to have standing water that could lead to the development of Aedes aegypti larvae such as landfills, small garbage dumps, abandoned homes that could not be visited by public health workers for interventions, homes of suspected dengue cases, cemeteries, and schools.
The second method involved printing satellite maps of individual neighborhoods in black and white on 8 × 11 inch sheets of paper. Public health workers then noted locations of likely larval development sites on these paper maps using colored pens. We then created a new shapefile using ArcCatalog, which is an ArcGIS program that allows data access and spatial data management tools, and marked points on the computer image map to correspond to the locations identified on the paper maps. These points were then saved as a shapefile layer utilizing the UTM WGS 1984 16N format.
The final base map is a geo-referenced satellite map of Bluefields in ArcGIS with borders delineating the different neighborhoods. New maps can be created by editing the information in this template with locations of larval development sites or other relevant information to aid in decision making.
Dengue Fever and Dengue Hemorrhagic Fever (DHF) Case Reporting
Cases of dengue and DHF in Nicaragua are first identified clinically by a physician. Dengue is identified by the Min-istry of Health as a febrile illness characterized by head-ache, retro-orbital pain, myalgias, arthralgias, cutaneous eruptions, diarrhea, and a positive tourniquet test. DHF further includes hemorrhagic manifestations such as petechiae, epistaxis, metrorrhagia, and gingivorrhagia with evidence of pleural effusions, ascites, hemoconcen-tration 20% above normal, and thrombocytopenia with platelet count less than 100,000/m3 [12]. These cases
rep-resent suspected cases.
On the seventh day of the illness, blood samples are drawn and sent to Managua where a serologic ELISA is performed. If positive for IgM antibodies to the dengue virus, the case is reported as confirmed [12].
Since obtaining serological confirmation may take weeks, physicians fill out a form that includes the patient's address as soon as a suspected case is identified. Public health workers then visit the home to fumigate and place insecticide in standing water within a 50 m radius of the home. During this time, the location of the home can be geo-referenced. All authors have approved the visualiza-tion of exact dengue case locavisualiza-tions.
Determining Larval or Other Risk Indices
Public health workers in Nicaragua perform four cycles of entomologic surveillance for Aedes aegypti every year. Each cycle lasts for three months. During these cycles, the municipality is first surveyed for levels of infestation and then resources are directed and interventions are employed depending on the results of the entomologic survey. During their routine epidemiologic surveying,
public health workers in Bluefields collected data to calcu-late neighborhood-specific indices of larval infestation and density: the home index (discussed below), the Bre-teau index, the deposit index, and the neighborhood block index [12]. Neighborhoods were color coded to indicate a number of parameters, including levels of infes-tation, access to running water, or population density. Levels of infestation were measured by public health sur-veyors.
Ten percent of all of the homes in within each neighbor-hood block were surveyed for any sources of standing water. Surveillance of ten percent is dictated by the Nica-raguan Ministry of Health in order to provide an estimate of the level of infestation per municipality [12]. While sur-veying more than ten percent of the homes would provide a greater level of precision, surveillance is time consum-ing. For example, the municipality requires one month to survey ten percent of Bluefields, leaving only two months for interventions. In order to survey ten percent of Blue-fields, the number of houses in each neighborhood block was compiled and then multiplied by 0.10 and rounded to the nearest integer. This value represented the number of houses that were surveyed on that neighborhood block. Public health workers started surveillance at a home and then counted ten houses down for the next house, making sure to start at a different house during each cycle such that the same houses were not continually surveyed.
When a source was identified, it was inspected for mos-quito larvae. If larvae were found, the larvae were col-lected in an ethanol solution and all larvae were reviewed by an entomologist at the Ministry of Health to identify the species of the mosquito larvae. If the larvae were found to be Aedes aegypti larvae, then these homes were documented as positive for dengue larvae and added into the calculation of the home index for dengue larval infes-tation. The home index is calculated by summing all the homes with Aedes aegypti larvae discovered divided by the total number of homes surveyed multiplied by one hun-dred.
According to the risk levels set by the Nicaraguan Ministry of Health, optimal control is a home index of <1%, good control is a home index of <5%, alarm levels of infestation are indicated by a home index of <10%, and emergency levels of infestation are indicated by a home index of 10% or greater.
Population density was calculated using the Ministry of Health standard that the average home in Bluefields houses six persons. This number was then multiplied by the number of homes per neighborhood.
In ArcMap, these indices were entered into a table of one the of map layers that describes the attributes of individ-ual neighborhood blocks and these neighborhood blocks were color-coded, with graduating intensity of color rep-resenting areas with higher larval indices. In addition, public health workers collected information on the loca-tions of sites predisposed to larval development and the locations of the homes of dengue patients. Examples of sites predisposed to larval development included garbage dumps, areas without running water, collections of stand-ing water, and homes positive for mosquito larva. Refer-ence points such as churches, schools, and commercial buildings were also recorded because patients describe their addresses based on landmarks so such reference point documentation may aid public health workers in localizing patient homes for future interventions.
Finally, points representing likely larval development sites can be overlaid. Such a map conveys the spatial relation-ship between the specific likely larval development sites and the presence of dengue cases.
Results
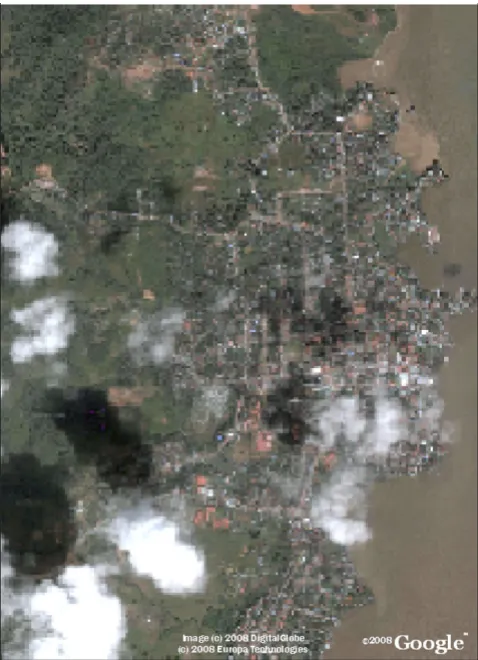
We created a geo-referenced satellite base map of Blue-fields using satellite imagery freely available from Google Earth, as described in the Methods section and shown in Figure 1. The map shows resolution of individual houses, with only certain areas obscured due to cloud cover. This base map was easily manipulated using ArcGIS and Erdas Imagine software without requiring further Internet access and was utilized as the starting point for further analysis and for the creation of the printed neighborhood maps; an example of the Beholden neighborhood is shown in Figure 2.
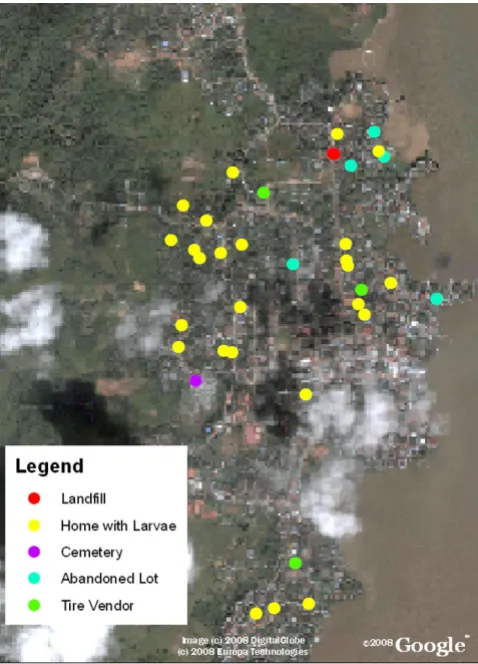
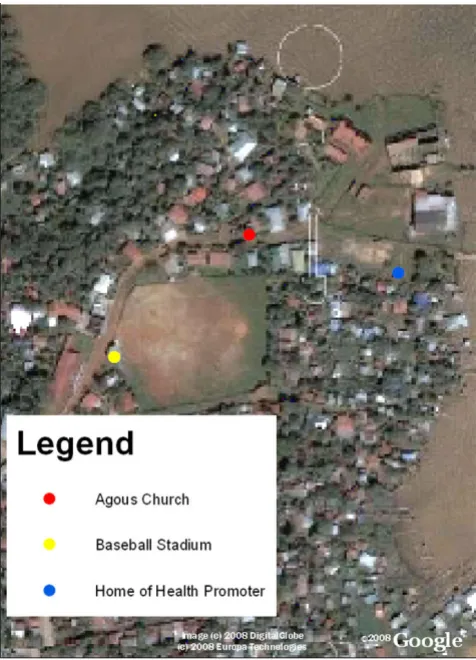
Data collected from the public health surveyors was then entered into the map as described above and utilized to calculate several indices of larval infestation (home index, Breteau index, deposit index, and neighborhood block index). Figure 3 provides further detail of information on locations containing features predisposed to larval devel-opment, such as the presence of cemeteries, landfills, homes positive for larvae, and abandoned lots, while Fig-ures 4 and 5 detail significant reference points (such as churches or schools) in Bluefields and its neighborhoods. Known and suspected dengue cases were also entered into the base map using ArcGIS. Figure 6 shows these cases overlaid onto the satellite base map with color-coded indices of infestation denoted by neighborhood.
Once information on the locations of larval development sites and dengue cases had been input on the map using the ArcGIS software, spatial patterns among the known dengue cases, mosquito larval indices, and the previously identified larval development sites were visually analyzed for patterns. The indices we examined were the home index, container index, Breteau index, and neighborhood block index [12]. Figure 6 illustrates that certain neighbor-hoods have a high home index of infestation. The loca-tions of the homes of cases are overlaid such that one can visually identify areas with high infestation and dengue cases. These areas tended to be neighborhoods with greater population density and significant unplanned urbanization leading to problems with water manage-ment. Using this spatial information, the Bluefields public health department was able to prioritize limited supplies of larvicide, insecticide, and human resources to the exact areas documented with the highest indices of infestation.
Bluefields, Nicaragua: Google Earth Satellite Imagery
Figure 1
Bluefields, Nicaragua: Google Earth Satellite
In addition, targeted control interventions were planned to directly address larval development sites in high index neighborhoods based upon the data collected.
Discussion
We have described the creation of an easy to implement system for creating spatial maps of dengue cases and the location of sites with predilection for larval development that uses the GIS mapping program ArcGIS available from the Global Fund. This can allow deployment of focused interventions in an efficient and cost-effective manner. Larval development sites and dengue cases could be marked either with GPS units when available or on printed maps generated from the satellite base map and then entered into ArcGIS for further analysis. Both meth-ods yielded data point accuracy within 5–10 m, though
the printed map method could only be utilized for those areas where ground features were not obscured by cloud cover or shadows.
To create the base maps, we utilized images from Google Earth. This is a useful resource for base-map creation because the imagery is open access and can be easily cap-tured and manipulated. Google Earth images are readily available for use without cost for such scholarly and not for profit purposes (including educational activities or scholarly publication) through the 'fair use' clause of the Google permission guidelines, provided that appropriate attribution is given by reprinting the copyright attribution text and Google logo [13]. Google was also notified of the use of imagery for this purpose.
An important consideration is resolution of the satellite imagery. As the Aedes aegypti mosquito has a dispersal of
Example of Printed Satellite Map for Data Collection in Neighborhood Beholden
Figure 2
Example of Printed Satellite Map for Data Collection in Neighborhood Beholden. Public health workers mark maps like this printed in black and white on 8.5 × 11 inch paper to denote the location of potential larval development sites during their routine epidemiologic surveillance. Each neighborhood block is denoted with its corresponding number.
Bluefields, Nicaragua with the locations of potential larval development sites overlaid
Figure 3
approximately 50 m when released in an urban environ-ment, it is useful to identify the likely indoor or closed-in breeding sites and range within which intervention is nec-essary, which in this case was within 50 m of a known dengue case or identified larval breeding area. The aerial maps in Google Earth had sufficient resolution to permit accurate mapping of structures within this radius. Although Google Earth has excellent resolution in Blue-fields, cloud cover obscures the aerial view in some neigh-borhoods. To address the problem of cloud cover in Bluefields, public health workers used the track function on the GPS devices to geo-reference streets and the point function to note homes that appeared obscured in the aer-ial views. This information was then laid over the cloud cover in ArcGIS to functionally complete the map in areas where the image was obscured. Also, map resolution
var-ies between different areas of the country or different parts of the world. Cloud cover and resolution was not a signif-icant problem in the images of Bluefields but this use of Google Earth imagery may not be possible in certain areas of the world due to poor resolution, especially if tracking vectors with a shorter range than Aedes aegypti. Fortu-nately, dengue fever is a primarily urban disease and Google Earth tends to have better resolution of urban areas [9].
Another consideration is that Google Earth imagery is not updated in real-time and the imagery may not represent new buildings or other developments placed after the cap-ture of the images. Therefore, it may be useful to record the date when the imagery was captured and update the map when new imagery is available.
The production of this map required the additional steps of image screen capture, formation of a digital mosaic of the images, and georeferencing of the images with hand-held GPS units. These steps could potentially be avoided
Bluefields, Nicaragua with the locations of reference points overlaid
Figure 4
Bluefields, Nicaragua with the locations of reference points overlaid. Reference points can be helpful in areas with unplanned urbanization to localize patient homes as the address systems may be underdeveloped. In Nicaragua, addresses are giving based on landmarks such as "the home two blocks towards the lake from the church" so we found it useful to collect information of common reference points in Bluefields.
Bluefields, Nicaragua close-up of reference points
Figure 5
if georeferenced images were already available (possibly as a donation from imagery providers) or possibly by writ-ing or obtainwrit-ing software to screen capture the whole image. However, should such georeferenced images or the screen capture software not be available, these steps are one option to allow for georeferencing and integration of available satellite images. Additionally, this method of constructing a base map can be employed using any type of digital imagery that an organization may have availa-ble, such as aerial photos. For example, this system may be used in the near future to georeference aerial photos of El Bluff, Nicaragua, which is a tiny island off the coast of Bluefields not picked up on Google Earth imagery but is a site of a significant number of dengue infections. Another benefit of performing one's own georeferencing is that the data point accuracy can be improved to a positional
accu-racy of 5–6 m. Google Earth has a positional accuaccu-racy of 39.7 m (root-mean-squared error). Developed countries have an improved root-mean-squared error of 24.1 m, however in developing countries the control points are significantly less accurate, particularly away from urban areas [14]. Therefore, in disease processes such as dengue where the vector is commonly limited to a 50 m radius or less, proper control may require creation of maps with greater data point accuracy than available through Google Earth, which can be developed using this process.
In this analysis, visual inspection was utilized to identify areas with dengue cases and high indices of infestation that require prioritized interventions. Visual inspection is intuitive and the maps provided administrators at the Ministry of Health sufficient information to target inter-ventions. Further spatial analysis can easily be performed to provide more information to guide interventions if nec-essary or as desired. For example, ArcGIS readily provides multiple statistical tools including cluster analysis and tools for measuring geographic distributions. Cluster analysis may be useful for further identification of loca-tions with groups of high indices or multiple cases. Tools are also available that allow one to identify a central point around which cases are distributed and the location of the most central case reported.
In addition, if an investigator would like to perform a more detailed spatial analysis of cases with statistics not available through the selected GIS software, a commonly used statistic for spatial temporal cluster analysis is the Knox test [15,16]. While these statistical methods can pro-vide additional information, we found that visual inspec-tion provided adequate informainspec-tion to guide interventions such as fumigation and insecticide distribu-tion.
Another consideration for the design of the mapping sys-tem was that in Nicaragua, few municipalities have access to Internet so it was critical that this system did not depend on this modality beyond the creation of the initial complete mosaic map at the central Ministry of Health. The final system delivered to the municipality was a series of saved images that could be transferred on CD and manipulated in ArcGIS. Thus, Internet access is not needed for the continued functioning of the mapping sys-tem.
One advantage of working in ArcGIS rather than Google Earth for the analysis of the maps is that ArcGIS is a pro-gram better suited for epidemiologic mapping and inter-pretation. With a few simple commands in ArcGIS, GPS input is represented as a shapefile, neighborhood blocks can be color-coded to indicate stratified levels of infesta-tion, and statistics can be performed. In addiinfesta-tion, there
Bluefields, Nicaragua with Suspected Cases from January 2009 overlaid on indices of infestation by neighborhood block
Figure 6
are a myriad of other functions that can be performed using ArcGIS in the analysis of disease patterns. Further-more, much of the infrastructure for the mapping of den-gue is already in place thanks to a five year project from 2000–2005 by the Global Fund for AIDS, Tuberculosis, and Malaria. This organization funds proposals to strengthen health systems in 123 developing and transi-tional countries worldwide. In Nicaragua, the Global Fund has been instrumental in setting up GIS for malaria surveillance, which included purchase of equipment such as ArcGIS, GPS devices, computers, and human resources development [17]. Thus, technology training and devices implemented by the Global Fund to control malaria may also be used for dengue control with minimal additional cost.
While ArcGIS can be an appropriate platform for mapping in developing countries that have already purchased the program and trained public health administrators in its use, it would be cost-prohibitive in any setting where the program was not already purchased or available through a mechanism such as the Global Fund as the program costs hundreds of dollars per license. There are numerous free or low-cost alternatives to high-end ArcGIS software that should be considered for the future of mapping in resource-limited settings [18]. These include SaTScan, a program that can be used to perform geographical surveil-lance of disease using space-time clustering [19], MapServer, an open-source platform for publishing spa-tial data and interactive mapping applications [20], and Quantum GIS, which can perform spatial analysis of shapefiles [21] These open source Web GIS software sys-tems now have the sophistication, stability, and user-friendliness to compete with commercial GIS products such as ArcGIS and can be utilized to create maps similar to ones described in this article; they will be particularly important for use in resource limited settings [18].
Nonetheless, the present use of ArcGIS already available to many developing countries through the Global Fund combined with Google Earth represents a drastic improve-ment from practices in the recent past. Previously, in Blue-fields, administrators were forced to guide interventions based solely on a table of the indices of infestation per entire neighborhood. Now, using aerial mapping of cases and likely larval development sites, high indices are color-coded and statistically analyzed per neighborhood block leading to greater spatial accuracy, in addition to precisely mapping larval development sites, homes of patients, and reference points. In addition, municipalities on the Atlan-tic coast often have difficulties securing funds from the central Ministry of Health for resources such as insecti-cide, gasoline for fumigation, and funds for contracting workers as it is difficult to communicate the extent of work being performed to Managua. By emailing maps of
the spatial progress of intervention efforts in addition to resource costs, administrators in Managua are better able understand what resources are needed.
Although the Ministry of Health has record of the approx-imate address of the homes of dengue cases it is important to map other locations of larval development as people often travel from their homes for work. Thus this mapping system represents a significant increase in the amount of information collected and the detail of its presentation, which can then be utilized to design and implement spe-cifically targeted interventions, ultimately saving time and money.
Currently, this system is being used to map a recent den-gue outbreak in Bluefields with 125 confirmed cases and approximately 600 suspected cases of dengue. In addition to demonstrating the location of dengue cases, mapping of intervention efforts has been important in communi-cating resource needs to the central Ministry of Health. Mapping of the area fumigated daily using gasoline and cipermetrina allows administrators at the central level in Managua to recognize the extent of the interventions being employed on a daily basis such that plans can be developed and resources sent accordingly. Figure 7 dem-onstrates the map of the pathway of a truck performing emergency spatial fumigation during a dengue epidemic that was sent to Managua to communicate intervention activities as a justification for further resource allocation.
The base maps created through the system described above are not limited to analysis of dengue but have broad potential uses for many diverse public health appli-cations. For instance, this system is currently being used by the Ministry of Health to map the locations of pharma-cies in an effort to elucidate deficienpharma-cies in access to med-ications for patients in Bluefields. In addition, the Ministry of Health has plans to partner with Enacal, the national water company, to map access to potable water to prevent a wide range of water-borne diseases. The sys-tem is also being used to map malaria, leishmaniasis, and recently influenza cases in Bluefields. Therefore, this map-ping program is not only useful for directing resources for dengue but can be applied towards the management of multiple diverse public health issues.
Conclusion
ideal for localizing cases and larval development sites, they are not necessary, and the use of printed maps is a low-cost solution that can easily be utilized for localizing likely larval development sites in order to reduce the inci-dence and burden of dengue of similar transmissible
dis-eases. The availability of these epidemiological tools will allow for interventions to be targeted specifically to areas of greatest need, conserving scarce resources towards the goal of reducing the burden of disease.
Abbreviations
DF: Dengue Fever; DHF: Dengue Hemorrhagic Fever; GIS: Geographic Information System; GPS: Global Positioning System; SILAIS: Local System for the Integral Attention to Health.
Competing interests
The authors declare that they have no competing interests.
Authors' contributions
AYC conceived the program with the creation of the base-map, creation of the study design, implementation of the mapping project, analysis of the data, and drafting of the manuscript. RPK contributed to the design and coordina-tion of the study, in addicoordina-tion to the analysis of data and drafting of the manuscript. MEP participated in the crea-tion of the base-map, creacrea-tion of the study design, imple-mentation of the mapping project, and analysis of the data. JJ contributed to the design and coordination of the study, secured the implementation of the mapping project, and performed analysis of data. MES contributed to the study design and revision of the manuscript. SMH contributed to the study design and revision of the manu-script. DJC assisted with data collection and coordination with MINSA. All authors have read and approved the final manuscript.
Acknowledgements
This work was supported by the partnership of Dengue Relief Foundation and the Nicaraguan Ministry of Health. From the Nicaraguan Ministry of Health, Dr. Francisco Acevedo, Dra. Louisa Amanda Campos, Lic. Jose Antonio Aguilar Garcia, Lic. Julio Rosales, Julissa T Quintero, Judy Martinez, and Lic. Rolando Francisco Lopez Ampea facilitated the creation of the pro-gram. The implementation was executed by Dr. Abraham Mayorga, Dra. Gina Hodgson, Benito Rigby, Ronney Novoa Joseph, and Florentine Arnoldo Downs Sambola. Data collection was performed by Orlando Alex-ander Murray Joseph, Carmen Lopez, Diego Cesar Aguilar Montago, Dale Pablo Cassanova, Hilario Huete Patron, Martha Flores, Sonia Rodes, Rodolfo Mendoza, Oel Cuadra, Ivan Pineda, Siniman William Hodgson, Harry Lopez, and Aldara Cuadra Rios.
Funding was granted from the Doris Duke Foundation to Aileen Y Chang. The funding organization played no part in the study design; in collection, analysis, and interpretation of data; in the writing of the manuscript; or in the decision to submit the manuscript for publication.
References
1. Gubler DJ: Dengue/dengue haemorrhagic fever: history and current status. Novartis Found Symp 2006, 277:3-16.
2. Harrington LC, Scott TW, Lerdthusnee K, Coleman RC, Costero A, Clark GG, Jones JJ, Kitthawee S, Kittayapong P, Sithiprasasna R, et al.:
Dispersal of the dengue vector Aedes aegypti within and between rural communities. Am J Trop Med Hyg 2005,
72(2):209-220.
Emergency Spatial Fumigation performed on 7/9/09 during a Dengue Epidemic
Figure 7
Publish with BioMed Central and every scientist can read your work free of charge
"BioMed Central will be the most significant development for disseminating the results of biomedical researc h in our lifetime."
Sir Paul Nurse, Cancer Research UK
Your research papers will be:
available free of charge to the entire biomedical community
peer reviewed and published immediately upon acceptance
cited in PubMed and archived on PubMed Central
yours — you keep the copyright
Submit your manuscript here:
http://www.biomedcentral.com/info/publishing_adv.asp
BioMedcentral 3. Castle T, Amador M, Rawlins S, Figueroa JP, Reiter P: Absence of
impact of aerial malathion treatment on Aedes aegypti dur-ing a dengue outbreak in Kdur-ingston, Jamaica. Rev Panam Salud Publica 1999, 5(2):100-105.
4. Gubler D: The emergence of epidemic dengue fever and den-gue hemorrhagic fever in the Americas: a case of failed pub-lic health popub-licy. Rev Panam Salud Publica 2005, 17(4):221-224. 5. Gubler DJ: Aedes aegypti and Aedes aegypti-borne disease
control in the 1990s: top down or bottom up. Charles Fran-klin Craig Lecture. Am J Trop Med Hyg 1989, 40(6):571-578. 6. Dwolatzky B, Trengove E, Struthers H, McIntyre JA, Martinson NA:
Linking the global positioning system (GPS) to a personal digital assistant (PDA) to support tuberculosis control in South Africa: a pilot study. Int J Health Geogr 2006, 5:34. 7. Herbreteau V, Salem G, Souris M, Hugot JP, Gonzalez JP: Thirty
years of use and improvement of remote sensing, applied to epidemiology: from early promises to lasting frustration.
Health Place 2007, 13(2):400-403.
8. Boulos MN: Web GIS in practice III: creating a simple interac-tive map of England's Strategic Health Authorities using Google Maps API, Google Earth KML, and MSN Virtual Earth Map Control. Int J Health Geogr 2005, 4:22.
9. Kamadjeu R: Tracking the polio virus down the Congo River: a case study on the use of Google Earth in public health plan-ning and mapping. Int J Health Geogr 2009, 8:4.
10. Lozano-Fuentes S, Elizondo-Quiroga D, Farfan-Ale JA, Fernandez-Salas I, Beaty BJ, Eisen L: Use of Google Earth to Facilitate GIS-Based Decision Support Systems for Arthropod-Borne Dis-eases. Advances in Disease Surveillance 2007, 4:91.
11. Lozano-Fuentes S, Elizondo-Quiroga D, Farfan-Ale JA, Lorono-Pino MA, Garcia-Rejon J, Gomez-Carro S, Lira-Zumbardo V, Najera-Vazquez R, Fernandez-Salas I, Calderon-Martinez J, et al.: Use of Google Earth to strengthen public health capacity and facili-tate management of vector-borne diseases in resource-poor environments. Bull World Health Organ 2008, 86(9):718-725. 12. Garcia TCM, Espino C, Bravo AMS, Aldigheri S, Zamora N, Jimenez
R, Corea R, Balmaceda A, Lugo E, Amador JJ, et al.: Indicadores Entomologicos. In Normas Nacionales de Prevencion, Manejo, y Con-trol de DengueVolume 1. Managua, Nicaragua: Ministerio Nacional de Salud; 2006:30-31.
13. Google Permissions [http://www.google.com/permissions/geogu idelines.html]
14. Potere D: Horizontal Positional Accuracy of Google Earth's High-Resolution Imagery Archive. Sensors 2008, 8:7973-7981. 15. Morrison AC, Getis A, Santiago M, Rigau-Perez JG, Reiter P:
Explor-atory space-time analysis of reported dengue cases during an outbreak in Florida, Puerto Rico, 1991–1992. Am J Trop Med Hyg 1998, 58(3):287-298.
16. Tran A, Deparis X, Dussart P, Morvan J, Rabarison P, Remy F, Polidori L, Gardon J: Dengue spatial and temporal patterns, French Guiana, 2001. Emerg Infect Dis 2004, 10(4):615-621.
17. Bennett S, Fairbank A: The System-Wide Effects of The Global Fund to Fight AIDS, Tuberculosis, and Malaria: A Concep-tual Framework. In Technical Report No 031Volume 19. Bethesda, MD: The Partners for Health Reformplus Project; 2003:1-55. 18. Boulos MN, Honda K: Web GIS in practice IV: publishing your
health maps and connecting to remote WMS sources using the Open Source UMN MapServer and DM Solutions MapLab. Int J Health Geogr 2006, 5:6.