Open Access
Research article
Correlation of microRNA levels during hypoxia with predicted
target mRNAs through genome-wide microarray analysis
Jennifer S Guimbellot
1,2, Stephen W Erickson
3, Tapan Mehta
3, Hui Wen
2,
Grier P Page
3, Eric J Sorscher
2,4and Jeong S Hong*
2,5Address: 1Departments of Genetics, University of Alabama at Birmingham, Birmingham, AL 35294, USA, 2Gregory Fleming James Cystic Fibrosis Research Center, University of Alabama at Birmingham, Birmingham, AL 35294, USA, 3Department of Biostatistics, University of Alabama at Birmingham, Birmingham, AL 35294, USA, 4Department of Medicine, University of Alabama at Birmingham, Birmingham, AL 35294, USA and 5Department of Cell Biology, University of Alabama at Birmingham, Birmingham, AL 35294, USA
Email: Jennifer S Guimbellot - [email protected]; Stephen W Erickson - [email protected]; Tapan Mehta - [email protected]; Hui Wen - [email protected]; Grier P Page - [email protected]; Eric J Sorscher - [email protected]; Jeong S Hong* - [email protected] * Corresponding author
Abstract
Background: Low levels of oxygen in tissues, seen in situations such as chronic lung disease, necrotic tumors, and high altitude exposures, initiate a signaling pathway that results in active transcription of genes possessing a hypoxia response element (HRE). The aim of this study was to investigate whether a change in miRNA expression following hypoxia could account for changes in the cellular transcriptome based on currently available miRNA target prediction tools.
Methods: To identify changes induced by hypoxia, we conducted mRNA- and miRNA-array-based experiments in HT29 cells, and performed comparative analysis of the resulting data sets based on multiple target prediction algorithms. To date, few studies have investigated an environmental perturbation for effects on genome-wide miRNA levels, or their consequent influence on mRNA output.
Results: Comparison of miRNAs with predicted mRNA targets indicated a lower level of concordance than expected. We did, however, find preliminary evidence of combinatorial regulation of mRNA expression by miRNA.
Conclusion: Target prediction programs and expression profiling techniques do not yet adequately represent the complexity of miRNA-mediated gene repression, and new methods may be required to better elucidate these pathways. Our data suggest the physiologic impact of miRNAs on cellular transcription results from a multifaceted network of miRNA and mRNA relationships, working together in an interconnected system and in context of hundreds of RNA species. The methods described here for comparative analysis of cellular miRNA and mRNA will be useful for understanding genome wide regulatory responsiveness and refining miRNA predictive algorithms. Published: 25 March 2009
BMC Medical Genomics 2009, 2:15 doi:10.1186/1755-8794-2-15
Received: 20 March 2008 Accepted: 25 March 2009
This article is available from: http://www.biomedcentral.com/1755-8794/2/15
© 2009 Guimbellot et al; licensee BioMed Central Ltd.
Background
MicroRNAs (miRNA) are approximately 22-nucleotide, non-coding RNA sequences important in the control of gene expression. They are involved in a variety of cellular processes, including development, cell differentiation, signaling, and tumorigenesis[1], and are believed to rep-resent 1% of the predicted genes in mammalian and nem-atode genomes[2,3]. Mammals in general (and primates in particular) appear to have a large number of miRNAs not found in other animal orders[2], suggesting that many functional miRNAs may have emerged during recent evo-lutionary periods. According to current functional and predictive models, each miRNA regulates multiple genes during differentiation and/or development at the tran-scription, translation, and posttranslational levels[1,4,5]. However, few of these targets and regulatory pathways have been experimentally validated, and the number of authentic (as opposed to predicted) miRNAs that exist in the mammalian genome as well as the actual number of their targets are not yet known.
Considerable effort has been directed toward understand-ing which mRNAs within the human genome are subject to regulation by miRNA-mediated repression. The miRGen Targets interface allows users to search either for targets or particular miRNA(s) that influence a particular gene. DIANA-microT[6], MiRanda[7], TargetScanS[5], and Pic-Tar[4] are four genome-wide prediction algorithms whose results are available through miRGEN http:// www.diana.pcbi.upenn.edu/miRGen.html[8-11], an inte-grated database of (i) positional relationships between animal miRNAs and genomic annotation sets, and (ii) animal miRNA targets according to combinations of widely used prediction programs. These algorithms can provide quite a variable picture of miRNA behavior, and it is difficult to assess which in silico predictive method is best for identifying true miRNA targets[12]. It is probable that the use of multiple programs combined with mRNA expression profiling will be necessary to address this ques-tion. As a result, we considered four different algorithms (PicTar, TargetScanS, miRanda(microrna.org), and miRanda(miRBase)) in this report when assessing the relationship between mRNA and miRNA expression.
Previous studies have evaluated the influence of a particu-lar miRNA on potential mRNA targets and found a high degree of correlation in specific tissues [13-15]. In general, these reports have examined the regulatory relationships between miRNAs and the genome wide transcriptome, with a focus on pathological conditions (such as cancer) rather than acute perturbations such as hypoxia, although hypoxia in particular has been shown to regulate discrete miRNAs [16-23]. Hypoxia results in a change in expres-sion of a significant portion of the human transcriptome. After oxygen restriction, we observed down-regulation of
hundreds of transcripts, including the cystic fibrosis trans-membrane conductance regulator (CFTR), in which we could not identify a consensus hypoxia regulatory motif (HRE, hypoxia regulatory element[24]; an indicator of transcriptional regulation by hypoxia inducible factor (HIF)). In the present study, we hypothesized that many of these transcripts may be down-regulated by miRNAs.
Kulshreshtha et al[22] recently demonstrated a functional link between hypoxia and microRNA expression, although the relationship to mRNA expression was not evaluated. We therefore investigated the effects of hypoxia on a model epithelia and found that 3125 unique genes were significantly altered. Of these, approximately 53% were down-regulated, presenting 1649 unique possible targets for miRNA-mediated repression. Expression data from a miRNA Bioarray (see Methods) was compared with the mRNA expression profile, and the strength of cor-relation against predicted targets with differentially expressed miRNAs was analyzed using computational techniques we developed specifically for this purpose. We found no compelling evidence that miRNA-mediated repression plays a major role in down-regulation of CFTR, and present evidence that the individual miRNA levels do not correlate well with their algorithm-predicted target mRNAs. However, the groups of miRNAs predicted to reg-ulate the same mRNA target were found to be co-regu-lated, indicating that a level of combinatorial control may exist.
Methods
Cell line and culture conditions
The HT29 (human colonic) cell line was obtained from ATCC http://www.atcc.org and seeded on 12-mm diame-ter Transwell fildiame-ters (Corning-Costar, Corning, NY). Cells were cultured in media (HT29: McCoy's 5a medium sup-plemented with 7% Fetal Bovine Serum (FBS)) for 5–7 days (media bathing both the apical and basolateral com-partments) at 37°C (5% CO2 – 95% air gas mixture).
Under these conditions, cells form polarized monolayers with transepithelial resistances of >1000 Ω·cm2. In some
in L/L culture, (ii) HRE-driven luciferase activity is increased, and (iii) well known genes activated under hypoxia such as VEGF are dramatically elevated. The assay represents a useful and commonly used test for observing changes in vitro due to hypoxia.
mRNA expression array
Total RNA was purified from HT29 cells using the mir -Vana™ miRNA Isolation Kit per manufacturer instructions (Ambion, Inc., Austin, TX), and RNA quality assessed before RNA labeling (2100 Bioanalyzer, Agilent, Palo Alto, CA). Detailed analysis procedures are presented in the Manufacturer's GeneChip Expression Technical Man-ual (Affymetrix, Santa Clara, CA). Briefly, 2 ug of total RNA from each sample was used to generate double strand cDNA by linear amplification using oligo dT-T7 primer and reverse transcriptase. Subsequently, biotin-labeled cRNA was synthesized by in vitro transcription (IVT) using 3'-Amplification Reagents for IVT labeling (Affymetrix, Santa Clara, CA) followed by cRNA fragmen-tation. The Affymetrix Human Genome U133 Plus 2.0 Array was used for hybridization. This array contains 54675 probes designed to over 47,000 transcripts and var-iants. Arrays were hybridized overnight at 45°C, and then washed, stained, and scanned on a GeneChip Scanner 3000 (Affymetrix, Inc., Santa Clara, CA). Gene expression levels were analyzed with GeneChip Operating Software (Affymetrix, Inc., Santa Clara, CA). Raw data were ana-lyzed using Microarray Suite, Version 5.0 software (Affymetrix, Santa Clara, CA). The raw data set is available through Gene Expression Omnibus under accession number GSE9234.
miRNA expression array
Total RNA was purified from HT29 cells using the mir -Vana™ miRNA Isolation Kit per manufacturer instructions (Ambion, Inc., Austin, TX) which efficiently purifies RNA as small as 10 nucleotides. Expression profiling was then performed using the mirVana miRNA Bioarrays V2 (Asur-agen, Inc., Austin, Texas) which contains probes for all mouse, rat, and human miRNAs (266, 238, 482 con-firmed miRNAs, respectively) in miRBase http://micro rna.sanger.ac.uk/. Samples for microRNA profiling studies were processed by Asuragen, Inc. (Austin, TX) and the microRNA enriched fraction obtained by passing total RNA through a flash PAGE™ Fractionator apparatus (Ambion, Inc., Austin, TX) and cleaned. The 3' ends of RNA molecules were tailed and labeled using the mir -Vana™ miRNA Labeling Kit (Ambion, Inc., Austin, TX). Amine-modified nucleotides were incorporated during the poly (A) polymerase mediated tailing reaction, and Cy3 succinimide esters (Amersham Biosciences (GE Healthcare), Piscataway, NJ) were conjugated to amine moieties on microRNAs. Hybridization to the mirVana miRNA Bioarrays (Ambion, Inc., Austin, TX) was
per-formed. The Cy3 fluorescence on the arrays was scanned at an excitation wavelength of 532 nm using a GenePix 4200AL scanner (Molecular Devices, Union City, CA). The fluorescent signal associated with the probes and local background was extracted using GenePix Pro (ver-sion 6.0, Molecular Devices, Union City, CA). The raw data set is available through Gene Expression Omnibus under accession number GSE9234.
mRNA expression array analysis
The raw microarray data obtained from Microarray Suite v5.0 software were analyzed using a two-sided t-test cor-rected for unequal variances (Welch test) to compare the mean expression level for each gene between the two groups. A Bayesian posterior probability of being a false positive result (expressed as the false discovery rate, FDR) was estimated for each probe set individually, based on the Welch t-test p-values and using a mixture model[30,31]. We focused on the genes among those most differentially expressed that had corresponding probe sets with a lower than 1% FDR, that is, with a pos-terior probability of being differentially expressed of 99%. These genes were annotated with their chromosomal loca-tions, UniGene number, LocusLink ID and Gene Ontol-ogy (GO) information (genes were grouped according to biological process, cellular component, or molecular function) using NetAffx resources[32]. We used Onto-Express (available at http://vortex.cs.wayne.edu/ Projects.html, last accessed in March 2007) [33] to calcu-late whether any of the GO terms were significantly over-represented among differentially expressed genes, as determined by a two-sided binomial test. The p-value cal-culation is only valid if the expression levels of the genes are independent, which is probably not the case in expres-sion studies; thus, the p-values reported for these analyses should only be considered as heuristic ranking statistics. The fold change represents the ratio between microarray probe expression values.
MiRNA expression array analysis
Thresholding and signal scaling were generated using algorithms selected by Asuragen. The background-adjusted fluorescent values generated by GenePix Pro were normalized for each microRNA using a variance sta-bilization method described by Huber et al[34], followed by a Welch two-sample t-test carried out for every gene; and a multiplicity correction was conducted to control FDR at 5% using a step-up approach, as described by Ben-jamini and Hochberg[35].
Results
Expression profiles of mRNA in HT29 cells
Data analysis was performed using three replicates of array data per group (within group Mean r2 = 0.996, range
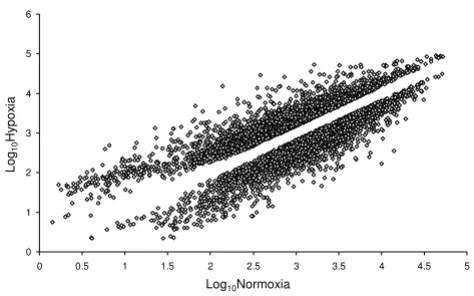
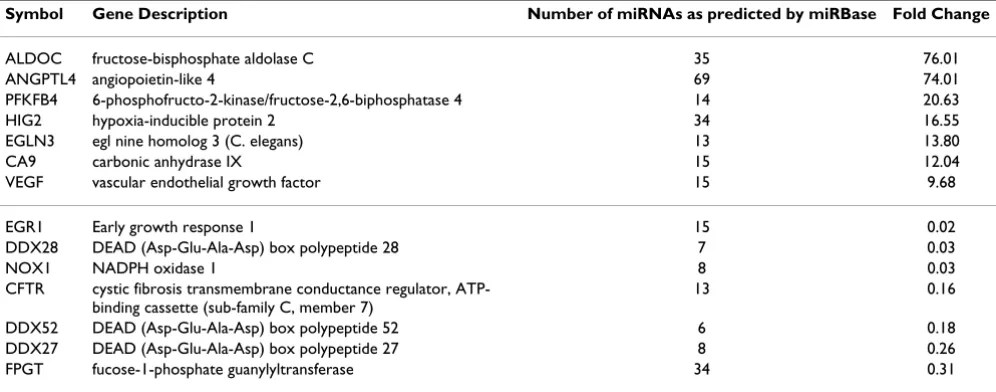
expressed between normoxic and hypoxic conditions if absolute expression changes were 1.5-fold or greater, a lower than 0.1% false discovery rate (FDR) was observed, and the p-value from a Welch two-sample t-test was less than 0.001. Over 8% of all probes satisfied these criteria (1999 probes up-regulated and 2099 down-regulated, see Figure 1). These probe sets map on to 1476 up- and 1649 down-regulated genes with a HUGO gene symbol, along with 208 probe sets that did not map to a HUGO identi-fier. Table 1 provides examples of selected genes known to be regulated by hypoxia with a broad biological signifi-cance, which are also predicted to contain target sites (in the 3'UTR) for miRNAs, according to the miRanda(micro-rna.org) target prediction database (for complete dataset of all genes altered by oxygen restriction in our studies, see GEO series GSE9234). Interestingly, the miRanda(mirorna.org) Target Database predicted that every 3'UTR in this set had target sites for between 4 and 69 miRNAs, although only 30% of the genome has been suggested to be regulated by miRNA-based mecha-nisms[1,4,5].
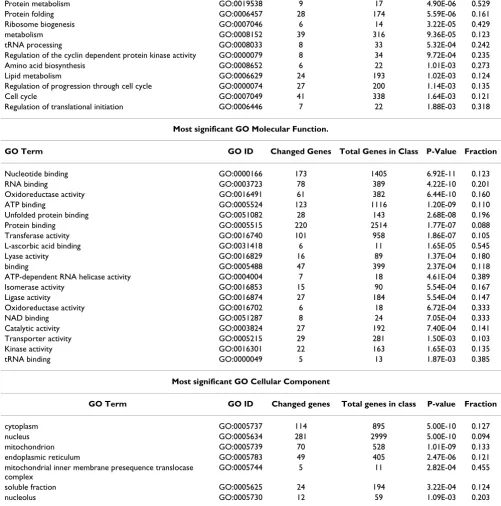
Over-represented GO Categories
We next analyzed our mRNA array data to identify various cellular processes affected by hypoxia according to Gene Ontology (GO) annotation[36]. GO is organized into three partially overlapping categories that consider three different aspects of each gene: biological processes, molec-ular functions, and cellmolec-ular component. To investigate whether any GO terms were significantly over-represented
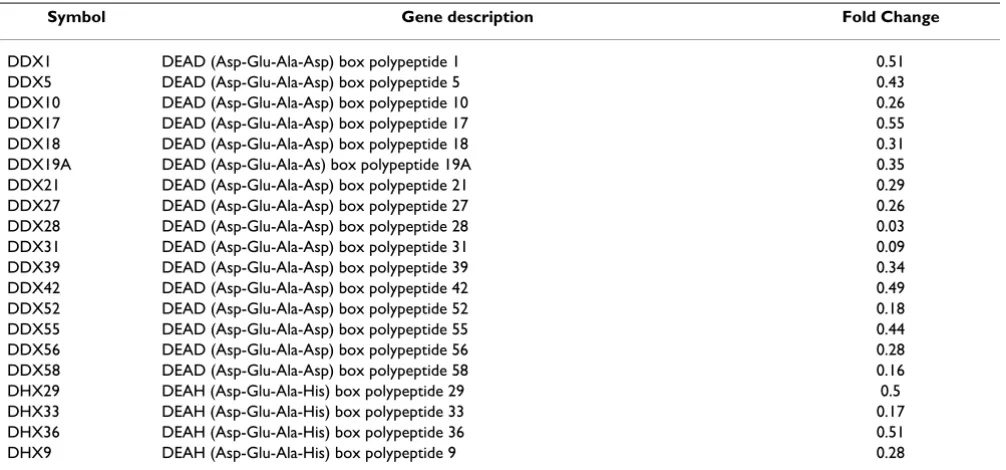
among the differentially expressed genes, we used the Onto-Express tool[33] to calculate statistical significance values for each category. Categories with the most signifi-cant corrected p-value are shown in Table 2. The highest fraction of differentially expressed genes among the bio-logical processes class included genes linked to choles-terol biosynthesis, protein metabolism, or ribosome biogenesis. Among the molecular function class, highly represented genes included those involved in L-ascorbic acid binding, ATP-dependent RNA helicase activity, oxi-doreductase activity, NAD binding, and tRNA binding. A high fraction of mitochondrial inner membrane prese-quence translocase complex proteins was found among the cellular components class. Only a small portion of GO terms in each category changed significantly (less than 1% of entire terms, p < 0.05), suggesting the hypoxia-response may be highly specialized. Taken together, all three cate-gories indicate considerable effects on glycolysis, transla-tion and protein metabolism, and RNA processing. Of note was one group of proteins particularly affected by hypoxia. At least 20 members of the DEAD box family were significantly down-regulated, 2 to 33 fold, and com-prised individual gene products in molecular function and biological process categories important in cellular pathways involving RNA (Table 3) [37,38]. These results suggest a substantial impact on RNA metabolism and activity by hypoxia.
miRNA expression profiles in HT29 cells
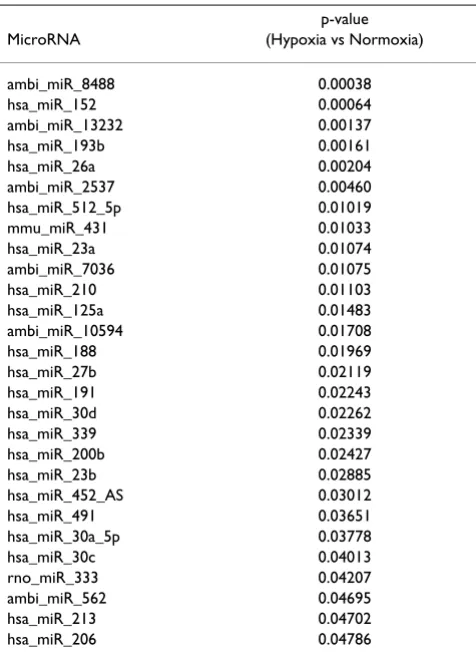
Unlike well-characterized hypoxia-mediated transcrip-tional activation[24], the general mechanisms underlying gene repression due to hypoxia are not well understood. We hypothesized that miRNAs may play an important role in the down-regulation of gene expression by hypoxia. We addressed this hypothesis by combining a comprehensive mRNA expression array with miRNA bio-array to evaluate not only the potential for a specific, hypoxic stress-induced miRNA profile, but also to corre-late the expression of specific miRNAs with their algo-rithm-predicted targets. The mirVana miRNA Bioarrays V2(Ambion, Inc., TX) used in this study contain probes for mouse, rat, and human miRNAs in miRBase. A hierar-chical cluster analysis, using average linkage and Pearson's correlation as the weight function, of all the significant miRNAs evaluated in three hypoxic and three normoxic conditions is shown in Figure 2, illustrative of miRNAs differentially expressed by hypoxia. Approximately 8% (53 miRNAs) of all human miRNAs tested (640 unique miRNAs) were significantly different in the hypoxic group compared to the normoxic group. Twenty-eight miRNAs (4%) were up-regulated in a statistically significant fash-ion (p < 0.05) by hypoxia and twenty-five miRNAs (4%) were significantly down-regulated (p < 0.05) (Tables 4 and 5). No correlation of target mRNAs as predicted by miRanda (microrna.org) with any particular GO term was
Differentially expressed mRNAs
Figure 1
Differentially expressed mRNAs. Comparison of changes in HT29 mRNA levels under hypoxic vs. normoxic conditions. Unique genes that were differentially expressed 1.5 fold or greater are shown on the log-scale scatter plot. Upper cloud indicates transcripts at increased levels under hypoxic conditions and lower cloud indicates those decreased under hypoxic conditions.
0 1 2 3 4 5 6
0 0.5 1 1.5 2 2.5 3 3.5 4 4.5 5
Log10 Normoxia
Log
10
Hyp
o
x
ia
Log
10
H
y
pox
ia
identified, supporting previous reports that miRNAs regu-late a wide variety of mRNAs and their action is not restricted to specific groups of genes[5,39].
Correlation of differentially expressed genes with the expression of their predicted regulatory miRNAs
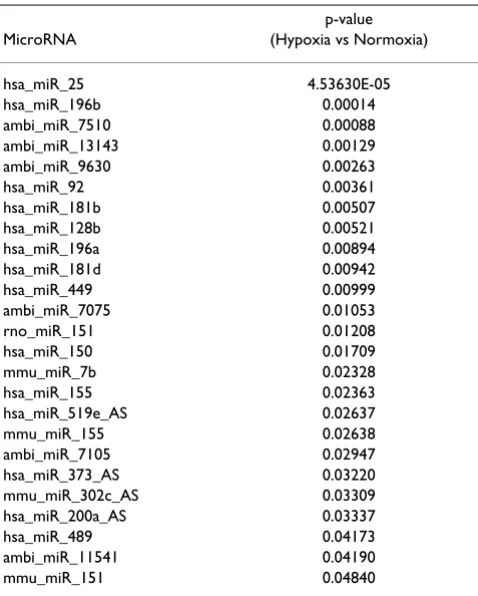
While it is well established that miRNAs play an impor-tant role governing gene expression, the correlation of mRNA and miRNA profiles across the entire genome and in response to an acute cellular perturbation (such as hypoxia) have not been thoroughly assessed. Accordingly, we next evaluated the extent to which the profile of miR-NAs observed during hypoxia was consonant with mRNA expression (i.e., the transcriptome response). The distri-bution of t-statistics for all probes on mRNA expression arrays was used as a reference distribution (dotted line), as shown in Figure 3. In comparison to the reference distri-bution, the thirteen most significant differentially expressed miRNAs (Tables 4 and 5) and twenty randomly selected non-significant miRNAs were analyzed. The dis-tribution of t-statistics for mRNA probes that are predicted targets of the given miRNAs were generated (solid lines, Figures 3a and 3b). Figure 3 depicts the distribution of mRNAs with one predicted target site for a given miRNA (microrna.org); a deviation from the reference curve (dot-ted lines) would be interpre(dot-ted as a significant relation-ship between the mRNA and miRNA arrays, as mediated via the target predictions. This methodological approach to investigating 'cause and effect' allows a visualization of mRNA/miRNA correlations. No consistent deviations, however, were observed in the combined t-statistics. As a further test of this finding, evaluations of individual miR-NAs were performed (representative examples in Figures 3c and 3d). No consistent deviations were noted in
t-sta-tistics for any single miRNA in either the significant or the non-significant miRNA group. Figure 3 illustrates the dis-tribution for miRanda-predicted targets, while Figure 4 through Figure 6 contain the results for PicTar, TargetS-canS, and miRBase, respectively. When all miRNAs that changed significantly during oxygen restriction were com-pared against mRNAs containing one target prediction site in the 3'UTR, none of the target prediction programs indi-cated a significant relationship between data from the mRNA and miRNA expression arrays. When the findings were evaluated using the most recent TargetScanS predic-tive method (i.e. a more stringent threshold [40] that includes only the highest ranked targets with a context score percentile of 85%), no consistent deviations were observed in the combined t-statistics (Figure 5).
Similar comparisons were made for mRNAs containing at least three target sites within each 3'UTR for the same miRNA (Figure 7). As in Figure 3, the 13 most significant differentially expressed miRNAs (Figure 7a) and 20 ran-domly selected, non-significant miRNAs (Figure 7b) were investigated. Certain miRNAs did exhibit some relation-ship with their predicted targets (indicated by arrows); however, miRNAs without statistically significant differ-ential expression also demonstrated a roughly compara-ble relationship (arrows, Figures 7c and 7d), suggesting that this observation occurred by chance.
Combinatorial regulation by groups of diverse miRNA species binding to different numbers of target sites within a single 3' UTR of a given gene has been hypothesized as a mechanism underlying miRNA-mediated gene repres-sion[4]. Therefore, we next compared expression under hypoxia or normoxia of all miRNAs predicted to target a
Table 1: Representative list of genes changed between hypoxia and normoxia including number of miRNAs predicted to have target sites in each gene (p ≤ 0.001).
Symbol Gene Description Number of miRNAs as predicted by miRBase Fold Change
ALDOC fructose-bisphosphate aldolase C 35 76.01
ANGPTL4 angiopoietin-like 4 69 74.01
PFKFB4 6-phosphofructo-2-kinase/fructose-2,6-biphosphatase 4 14 20.63
HIG2 hypoxia-inducible protein 2 34 16.55
EGLN3 egl nine homolog 3 (C. elegans) 13 13.80
CA9 carbonic anhydrase IX 15 12.04
VEGF vascular endothelial growth factor 15 9.68
EGR1 Early growth response 1 15 0.02
DDX28 DEAD (Asp-Glu-Ala-Asp) box polypeptide 28 7 0.03
NOX1 NADPH oxidase 1 8 0.03
CFTR cystic fibrosis transmembrane conductance regulator, ATP-binding cassette (sub-family C, member 7)
13 0.16
DDX52 DEAD (Asp-Glu-Ala-Asp) box polypeptide 52 6 0.18 DDX27 DEAD (Asp-Glu-Ala-Asp) box polypeptide 27 8 0.26 FPGT fucose-1-phosphate guanylyltransferase 34 0.31
Table 2: Most significant GO functions in three GO classes.
Most significant GO Biological Processes
GO Term GO ID Changed Genes Total Genes in Class P-Value Fraction
Cholesterol biosynthesis GO:0006695 12 20 7.04E-09 0.600 Nuclear mRNA splicing, via spliceosome GO:0000398 29 110 9.77E-09 0.264
glycolysis GO:0006096 14 39 1.16E-07 0.359
Protein biosynthesis GO:0006412 38 247 8.00E-07 0.154
transport GO:0006810 50 415 8.94E-07 0.120
Protein metabolism GO:0019538 9 17 4.90E-06 0.529 Protein folding GO:0006457 28 174 5.59E-06 0.161 Ribosome biogenesis GO:0007046 6 14 3.22E-05 0.429
metabolism GO:0008152 39 316 9.36E-05 0.123
tRNA processing GO:0008033 8 33 5.32E-04 0.242 Regulation of the cyclin dependent protein kinase activity GO:0000079 8 34 9.72E-04 0.235 Amino acid biosynthesis GO:0008652 6 22 1.01E-03 0.273 Lipid metabolism GO:0006629 24 193 1.02E-03 0.124 Regulation of progression through cell cycle GO:0000074 27 200 1.14E-03 0.135
Cell cycle GO:0007049 41 338 1.64E-03 0.121
Regulation of translational initiation GO:0006446 7 22 1.88E-03 0.318
Most significant GO Molecular Function.
GO Term GO ID Changed Genes Total Genes in Class P-Value Fraction
Nucleotide binding GO:0000166 173 1405 6.92E-11 0.123 RNA binding GO:0003723 78 389 4.22E-10 0.201 Oxidoreductase activity GO:0016491 61 382 6.44E-10 0.160 ATP binding GO:0005524 123 1116 1.20E-09 0.110 Unfolded protein binding GO:0051082 28 143 2.68E-08 0.196 Protein binding GO:0005515 220 2514 1.77E-07 0.088 Transferase activity GO:0016740 101 958 1.86E-07 0.105 L-ascorbic acid binding GO:0031418 6 11 1.65E-05 0.545 Lyase activity GO:0016829 16 89 1.37E-04 0.180
binding GO:0005488 47 399 2.37E-04 0.118
ATP-dependent RNA helicase activity GO:0004004 7 18 4.61E-04 0.389 Isomerase activity GO:0016853 15 90 5.54E-04 0.167 Ligase activity GO:0016874 27 184 5.54E-04 0.147 Oxidoreductase activity GO:0016702 6 18 6.72E-04 0.333
NAD binding GO:0051287 8 24 7.05E-04 0.333
Catalytic activity GO:0003824 27 192 7.40E-04 0.141 Transporter activity GO:0005215 29 281 1.50E-03 0.103 Kinase activity GO:0016301 22 163 1.65E-03 0.135
tRNA binding GO:0000049 5 13 1.87E-03 0.385
Most significant GO Cellular Component
GO Term GO ID Changed genes Total genes in class P-value Fraction
cytoplasm GO:0005737 114 895 5.00E-10 0.127
nucleus GO:0005634 281 2999 5.00E-10 0.094
mitochondrion GO:0005739 70 528 1.01E-09 0.133 endoplasmic reticulum GO:0005783 49 405 2.47E-06 0.121 mitochondrial inner membrane presequence translocase
complex
GO:0005744 5 11 2.82E-04 0.455
soluble fraction GO:0005625 24 194 3.22E-04 0.124
nucleolus GO:0005730 12 59 1.09E-03 0.203
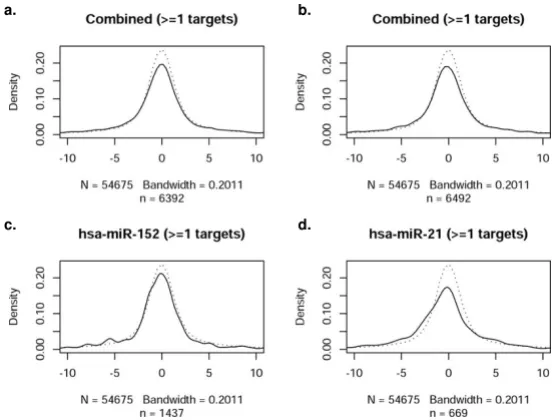
specific gene (termed a gene-specific miRNA group, Figure 8). This comparison evaluates whether specific groups of miRNAs (namely those predicted to target a specific gene) are significantly up- or down-regulated as a cluster. For each gene, a regression line (solid line, estimated best fit using the specific group of miRNAs indicated by red dots) was plotted and an ANOVA test performed to determine whether the regression line differed significantly from equality (dotted line). Figure 8a shows a histogram of the resulting p-values, indicating that a higher-than-expected number (expected result shown by dotted line) of gene-specific miRNA groups were regulated coordinately in association with a particular mRNA target.
A representative sample of statistically significant gene-specific miRNA groups is shown in Figures 8b–d. We chose to analyze three genes; CFTR, KIAA2026, and C16orf73. Selection of CFTR was based on our laboratory interest in regulation of that particular gene product. The other two genes shown in the figure (whose functions are not known) were selected because of highly significant p-values, indicating very strong co-regulation by gene-spe-cific miRNA groups. Scatterplots were identical by this method (black dots representing all miRNAs), indicating the group of miRNAs predicted to regulate expression of a particular gene of interest. Significant deviation from the line of equality (dotted line) indicates co-regulation of a cohort of miRNAs. The results presented here therefore provide some of the first evidence to suggest that miRNAs may be coordinately regulated in groups relevant to
spe-cific 3' UTRs. For example, Figure 8b shows predicted reg-ulation of CFTR mRNA expression by CFTR specific miRNAs (red dots, 9 predicted by miRanda(micro-rna.org)). The regression line indicates considerable devi-ation, suggesting that coordinated regulation of CFTR mRNA may exist by these specific miRNAs. CFTR mRNA levels were among the most significantly decreased under hypoxia based on the mRNA array (Table 1). Figure 8 shows results for miRanda-predicted targets. Results for PicTar, TargetScanS, and miRanda(miRBase) are provided in the Figures 9, 10, 11. All four algorithms indicate gene-specific groups of miRNAs reacted coordinately to hypoxia, as shown by the histograms of p-values. How-ever, different algorithms identified somewhat different gene-specific groups as being most strongly affected by hypoxia, as shown by the scatterplots (Figures 8b–d; and Figures 9, 10, 11).
Several mRNA changes were statistically significant due to pronounced differential expression of a single miRNA (for example Figure 10), a finding that may or may not be bio-logically relevant. In addition, while many mRNAs within a gene-specific miRNA group were found to be coordi-nately up-regulated, many others predicted to have target sites by miRanda(microrna.org) and other algorithms were not differentially expressed (Figure 8), suggesting that the definition of gene-specific miRNAs requires fur-ther refinement. Only a subset of genes with significantly regulated gene-specific miRNA groups were differentially expressed in our data set. The implication of these
find-Table 3: DEAD and DEAH helicases down-regulated in response to hypoxia.
Symbol Gene description Fold Change
DDX1 DEAD (Asp-Glu-Ala-Asp) box polypeptide 1 0.51 DDX5 DEAD (Asp-Glu-Ala-Asp) box polypeptide 5 0.43 DDX10 DEAD (Asp-Glu-Ala-Asp) box polypeptide 10 0.26 DDX17 DEAD (Asp-Glu-Ala-Asp) box polypeptide 17 0.55 DDX18 DEAD (Asp-Glu-Ala-Asp) box polypeptide 18 0.31 DDX19A DEAD (Asp-Glu-Ala-As) box polypeptide 19A 0.35 DDX21 DEAD (Asp-Glu-Ala-Asp) box polypeptide 21 0.29 DDX27 DEAD (Asp-Glu-Ala-Asp) box polypeptide 27 0.26 DDX28 DEAD (Asp-Glu-Ala-Asp) box polypeptide 28 0.03 DDX31 DEAD (Asp-Glu-Ala-Asp) box polypeptide 31 0.09 DDX39 DEAD (Asp-Glu-Ala-Asp) box polypeptide 39 0.34 DDX42 DEAD (Asp-Glu-Ala-Asp) box polypeptide 42 0.49 DDX52 DEAD (Asp-Glu-Ala-Asp) box polypeptide 52 0.18 DDX55 DEAD (Asp-Glu-Ala-Asp) box polypeptide 55 0.44 DDX56 DEAD (Asp-Glu-Ala-Asp) box polypeptide 56 0.28 DDX58 DEAD (Asp-Glu-Ala-Asp) box polypeptide 58 0.16 DHX29 DEAH (Asp-Glu-Ala-His) box polypeptide 29 0.5 DHX33 DEAH (Asp-Glu-Ala-His) box polypeptide 33 0.17 DHX36 DEAH (Asp-Glu-Ala-His) box polypeptide 36 0.51 DHX9 DEAH (Asp-Glu-Ala-His) box polypeptide 9 0.28
ings is that although miRNAs may be coordinately regu-lated, they do not predict expression changes of every predicted target.
Discussion
Cellular responses to hypoxia can occur through stabiliza-tion of HIF, a well-established transcripstabiliza-tional activator, and result in enhanced expression of a variety of related genes. Much less is known regarding hypoxia-dependent transcriptional repression. Our mRNA array data indicate that a large number of transcripts are robustly downregulated following oxygen restriction in human epithelial cells. One goal of the present study was to investigate the extent to which changes in miRNA could account for these variations in the cellular transcriptome. We hypothesized that miRNAs would play a role sup-pressing certain genes during hypoxia, and tested this by comparing expression data from miRNA and mRNA expression profiles investigated in parallel.
Recent studies describe hypoxia specific miRNA signa-tures in a variety of cell types [16-23]. A functional link between hypoxia and miRNA expression has therefore been observed by others, although the relationship
Bicluster of microRNA expression
Figure 2
Bicluster of microRNA expression. Hierarchical cluster-ing was carried out uscluster-ing correlation distance as the distance metric and average linkage between clusters to perform the analysis. This is a non-supervised method to illustrate poten-tial relationships between the miRNA expression profiles from different samples. Hierarchical clustering was carried out for all samples and miRNA. The top of the figure indi-cates relationships between the various samples. The left-hand side shows the relationships between the miRNA iden-tified on the right-hand side. The color of each cell reflects fold-change of the observed hybridization intensity relative to average hybridization intensity across all samples. Saturated green cells represent decrease in hybridization intensity, whereas saturated red cells represent an increase.
Table 4: MicroRNAs up-regulated by hypoxia (p ≤ 0.05).
p-value MicroRNA (Hypoxia vs Normoxia)
between mRNA and miRNA from a genome-wide per-spective has not been investigated previously. Kulshresh-tha and colleagues emphasized Kulshresh-that a spectrum of miRNAs can be induced during hypoxia, and at least some of these occur via a HIF-dependent mechanism. Ten miR-NAs reported previously as hypoxia-responsive were also identified in our experiments (e.g. miR23a, 23b, 27b, -30d, -191, -210, -213, -155, -200a, -181b) using a differ-ent method of oxygen deprivation (Tables 4 and 5). Inter-estingly, three miRNAs (miR-155, -200a, -181b) reported to be upregulated in other cell systems (reviewed in [16-23]) were noted to be repressed in colonic epithelia. These differences most likely relate to the various cell-types, growth conditions, or procedural aspects used in earlier studies.
The epithelial model of hypoxia described here represents a well-defined in vitro system for studying subacute (including transcriptional) effects of oxygen restriction [25-29]. We used the model to evaluate miRNA regulation of gene expression. We found changes in the epithelial transcriptome resulting from low oxygen, as well as fur-ther evidence for a potential signature of miRNAs induced by hypoxia [16-23]. However, in contrast to several extant models [13-15], we did not observe a significant correla-tion between mRNA expression levels and miRNAs on a genome-wide scale. Earlier studies have relied primarily
on particular tissue types and developmental stages from a variety of organisms, suggesting results most relevant to embryologic gene regulation. The present investigation of mRNA:miRNA association applied a novel analytical approach to widely available data visualization tools, and monitored miRNA and mRNA expression on a genome-wide basis, including the potential role of environmental stressors (found commonly in pathologic conditions) on miRNA-mediated regulation.
Our analysis incorporated four miRNA target predictions programs (MiRanda, PicTar, miRBase, TargetScan). When miRNA targets were compared to mRNA output, the data sets failed to indicate a significant relationship between expression arrays. In a very recent study, Baek et al. [40] reported that the top third TargetScan predictions (ranked by 'total context score') may correlate best with protein downregulation. In the present experiments, applying this stringent threshold and strict site conservation (after [40]) did not result in a stronger association. This included use of the most recent TargetScan algorithm (release 4.2; http://www.targetscan.org/) and restriction of targets to a context score of 85% or higher. Our results therefore indi-cate limitations of the currently available target prediction algorithms. While high stringency methods can be valua-ble for an individual miRNA [40], TargetScan/PicTar modifications do not appear to enhance the available algorithms in a broader, genomic context.
The lack of a significant and robust correspondence between mRNA levels and miRNA expression could repre-sent a lack of specificity and/or accuracy of miRanda or other target prediction algorithms. The observed magni-tude of miRNA expression changes (Figures 8b–d) in the present experiments is lower than observed for mRNA (Figure 1). In addition, the relatively small sample sizes used in this study could contribute to a lack of informa-tion, making it difficult to test the assumptions underly-ing the statistical method (such as normality), in a fashion that could impact results. MiRanda typically produces more potential targets than other programs, and a large number of false targets would seriously limit the compu-tational methods described here. We also note that the available programs have only partially overlapping pre-dicted targets for the same miRNA and produce smaller data sets than miRanda. Due to the differences among databases and because there are no clearly superior meth-ods, future studies of mRNA and miRNA regulation should consider analysis of multiple predictive algorithms rather than use of a single data analysis tool.
Although miRNAs can act to promote cleavage and subse-quent degradation of their mRNA targets, this may not be the only (or even primary) mechanism of miRNA action in mammalian epithelia. A strong consensus is not yet
Table 5: MicroRNAs down-regulated by hypoxia (p ≤ 0.05).
p-value MicroRNA (Hypoxia vs Normoxia)
available regarding the predominant pathway(s) that underly miRNA gene repression [41-44]. One explanation for our findings could relate to translational repression as a major action of miRNA in human cells. It has been shown that certain miRNAs bind their targets and prevent adequate translation. However, mRNA levels are not always affected by this process. A quantitative, proteomic approach to evaluate hypoxic protein expression in epi-thelia followed by in silico statistical correlation would be necessary to investigate this possibility. On the other hand, miRNA levels are also governed by DNA promoter elements, stability of miRNA, degradative pathways related to differential RNA editing, transport into the cyto-plasm, and/or deficient processing by Drosha. Alternative transcript splicing and polyadenylation can eliminate
miRNA regulatory sites from a message, and miRNA directed repression can be blocked by certain RNA bind-ing proteins. It seems less likely that common promoter element(s) or a single pathway (by itself) could explain the very large number of up- or down-regulated miRNAs noted as a result of oxygen restriction (Figure 1). Moreo-ver, translation of miRNA targets leads to secondary tran-scriptional and post-trantran-scriptional regulation that contributes to the observed mRNA profile. The diversity of potential regulatory sequences, difficulty predicting bio-logic regulation based solely on a consensus miRNA bind-ing site, and the increasbind-ingly apparent need for confirmation in living cells indicate that additional, cell-based studies should be used in the future to address tran-scriptome regulation by miRNA.
Correlation of miRNAs with at least one target site in miRanda-predicted target mRNA
Figure 3
Correlation of miRNAs with at least one target site in miRanda-predicted target mRNA. In each panel, the refer-ence distribution of t-statistics from all probes of the mRNA expression arrays is given by a dotted line. These are compared with the distribution of t-statistics for those probes that are predicted targets of given miRNAs, shown as a solid line. 'N' rep-resents the number of transcripts in the reference sample (dotted line), and therefore is the same in each plot. Sample size (n) is the number of genes predicted to have target(s) of given microRNA(s) (solid line), and therefore changes from plot to plot. Note that n depends on the number of predicted target probes contained within the dataset, either combined among all miR-NAs, or specific to an individual miRNA. The plotted distributions are Gaussian kernel density estimates (loosely, smoothed histograms), and the indicated bandwidth is in terms of the standard deviation of the smoothing kernel. The x-axis in each fig-ure reflects the t-statistics for the comparison between groups (dotted line represents random distribution). The y-axis repre-sents the density of observations at a given t-statistic value. a. Combined t-statistics for all significantly changed miRNAs with 1 site in the 3'UTR of predicted target miRNAs. b. Combined t-statistics for a set of non-significant miRNAs with 1 predicted tar-get site. c. Representative significantly changed miRNA compared to all of its predicted tartar-gets. d. Representative non-signifi-cantly changed miRNA compared to all of its predicted targets.
a. b.
Correlation of miRNAs with at least one target site in PicTar-predicted target mRNA
Figure 4
Correlation of miRNAs with at least one target site in PicTar-predicted target mRNA. a. Combined t-statistics for all significantly changed miRNAs with 1 site in the 3'UTR of predicted target mRNAs. b. Combined t-statistics for a set of non-significant miRNAs with 1 predicted target site. c. Representative non-significantly changed miRNA compared to all of its predicted targets. d. Representative non-significantly changed miRNA compared to all of its predicted targets.
a. b.
c. d.
Correlation of miRNAs with at least one target site in TargetScanS (with total context score)-predicted target mRNA
Figure 5
Correlation of miRNAs with at least one target site in TargetScanS (with total context score)-predicted target mRNA. a. Combined t-statistics for significantly changed miRNAs (top 15%) with 1 site in the 3'UTR of predicted target mRNAs. b. Combined t-statistics for a set of non-significant miRNAs with 1 predicted target site. c. Representative significantly changed miRNA compared to top 15% of its predicted targets. d. Representative non-significantly changed miRNA compared to top 15% of its predicted targets.
a. b.
Correlation of miRNAs with at least one target site in miRanda(miRBase)-predicted target mRNA
Figure 6
Correlation of miRNAs with at least one target site in miRanda(miRBase)-predicted target mRNA. a. Combined t-statistics for all significantly changed miRNAs with 1 site in the 3'UTR of predicted target mRNAs. b. Combined t-statistics for a set of non-significant miRNAs with 1 predicted target site. c. Representative significantly changed miRNA compared to all of its predicted targets. d. Representative non-significantly changed miRNA compared to all of its predicted targets.
a. b.
c. d.
Correlation of miRNAs with at least 3 target sites in miRanda-predicted target mRNA
Figure 7
Correlation of miRNAs with at least 3 target sites in miRanda-predicted target mRNA. Same as Figure 3, except that probes identified as targets of a miRNA are required to have at least three target sites in the 3'UTR region according to the miRanda(microrna.org) target prediction software. Arrows indicate deviation from the reference graph.
a. b.
miRNA expression arrays represent a relatively new tech-nology, and potential issues exist with regard to data acquisition. The correlation of biological replicates in our studies was >0.99, which indicates the technology is pre-cise, although accuracy is undefined. In addition, we ran-domized the order of miRNA and mRNA extraction to minimize non-biological, confounding variables. The goal of identifing a method to predict levels of mRNAs based on miRNA profiling, regardless of the underlying regulatory mechanism, was strengthened by correlation against predicted mRNA targets across the entire transcrip-tome. While previous studies have evaluated effects of a single miRNA after high level recombinant overexpres-sion, the present experiments allowed us to study the dynamics of miRNA and mRNA regulation in parallel with a common physiologic insult (oxygen deprivation). This approach avoided potential variables introduced by overexpression of foreign DNA elements or otherwise manipulating the cellular genome.
The present findings suggest that correlation between miRNAs and their predicted targets based primarily on the
number of consensus sites in the 3'UTR may be overly simplistic. Combinatorial analysis reveals much more sig-nificant agreement between specific genes and their pre-dicted miRNA regulators as a group; however, this too may reflect a one-dimensional view of miRNA activity. Based on evidence presented here that entire (GO) func-tional categories of mRNAs are regulated in parallel by hypoxia (Table 2), higher order miRNA groupings may exist along functional or developmental lines that respond as networks. In either case, the present experi-ments provide a means by which other predicted target lists – either currently available or under development – may be optimized to yield a better correlation between miRNA levels and gene expression.
The observation that a gene-specific group of miRNAs may work in concert to repress CFTR mRNA during hypoxia also points to a novel mechanism of regulation. Previous experiments have failed to establish a direct role for HIF during the pronounced inhibition of CFTR that occurs during oxygen deprivation. Moreover, very few gene products are believed to be down-regulated in a
Correlation of specific genes with predicted groups of miRNAs (miRanda, microrna.org)
Figure 8
Correlation of specific genes with predicted groups of miRNAs (miRanda, microrna.org). The expression levels in hypoxia and normoxia of each gene specific miRNA group were plotted. Significant deviation of the regression line (solid) from the line of equality (dotted line) indicates co-regulation of the group. Panel a shows histogram of the p-values for miRNA groups of all coding genes represented in the study for miRanda. Frequency on y-axis refers to the number of genes involved. Panels b-d depict CFTR, KIAA2026, and C16orf73 as examples of mRNA regulation by gene-specific miRNA groups. The red dots indicate gene-specific miRNAs for each given gene; this includes 9 miRNAs predicted by miRanda(microrna.org) for CFTR, 28 each for KIAA2026 and C16orf73.
a. b.
c. d.
Fre
que
nc
y
p-value Normoxia mean log-intensity
Hy
p
o
x
ia
m
ean l
o
g-i
n
ten
s
it
y
Hy
p
o
x
ia
m
ean l
o
g-i
n
ten
s
it
y
Hy
p
o
x
ia
m
ean l
o
g-i
n
ten
s
it
y
direct fashion by HIF. If a cohort of miRNAs target CFTR and coordinately suppress its message, this could repre-sent an important and novel example of miRNA based repression following an environmental stress. The find-ings may also help explain in vivo suppression of CFTR mRNA during low oxygen exposure[45,46], and suggest a role for miRNAs governing levels of hundreds of gene products following hypoxic insult (Figures 2 and 8).
Conclusion
Our results suggest that the expected inverse relationship between miRNA and target mRNA may be a rare event. Several previous studies [13-15] have indicated a clear cor-relation between a specific miRNA and suppression of a target mRNA. These earlier studies in some cases were based on marked overexpression of a particular miRNA, followed by expression studies of the mRNAs of interest. However, our experiments suggest that under physiologi-cal conditions in human epithelium, miRNA acts in a more subtle fashion distinct from that of marked
overex-pression. In addition, the physiologic impact of miRNAs on cellular transcription appears to result from a multifac-eted network of miRNA and mRNA relationships, work-ing together in an interconnected system and in context of hundreds of other RNA species. It may be that target pre-diction algorithms and expression profiling techniques do not yet adequately represent the complexity of miRNA-mediated gene repression, and new methods may be required to truly understand these systemic aspects.
Competing interests
The authors declare that they have no competing interests.
Authors' contributions
JSG and JSH performed the experimental steps, data acquisition, and wrote the manuscript. HW assisted the experimental setup. SWE, TM, and GPP conducted data analysis. EJS supervised the project. All authors read and approved the final manuscript.
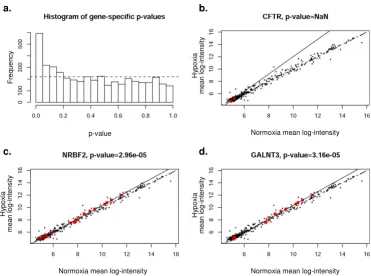
Correlation of specific genes with predicted groups of miRNAs (PicTar)
Figure 9
Correlation of specific genes with predicted groups of miRNAs (PicTar). The expression levels in hypoxia and nor-moxia of each gene specific miRNA group were plotted. Significant deviation of the regression line (solid) from the line of equality (dotted line) indicates co-regulation of the group. Panel a shows histogram of the p-values for miRNA groups of all coding genes represented in the study for PicTar. Frequency on y-axis refers to the number of genes involved. Panels b-d depict CFTR, NRBF2, and GALNT3 as examples of mRNA regulation by gene-specific miRNA groups. The red dots indicate gene specific miRNAs for each given gene.
a. b.
c. d.
Fre
que
nc
y
p-value Normoxia mean log-intensity
Hy
p
o
x
ia
m
ean l
o
g-i
n
ten
s
it
y
Hy
p
o
x
ia
m
ean l
o
g-i
n
ten
s
it
y
Normoxia mean log-intensity Normoxia mean log-intensity
Hy
p
o
x
ia
m
ean l
o
g-i
n
ten
s
it
Correlation of specific genes with predicted groups of miRNAs (TargetScanS)
Figure 10
Correlation of specific genes with predicted groups of miRNAs (TargetScanS). Panel a shows histogram of the p-values for miRNA groups of all coding genes represented in the study for TargetScanS. Frequency on y-axis refers to the
number of genes involved. Panels b-d depict CFTR, KIAA1468, and ARID4B as examples of mRNA regulation by gene-specific
miRNA groups. The red dots indicate gene specific miRNAs for each given gene.
a. b.
c. d.
Fre
que
nc
y
p-value Normoxia mean log-intensity
Hy
p
o
x
ia
m
ean l
o
g-i
n
ten
s
it
y
Hy
p
o
x
ia
m
ean l
o
g-i
n
ten
s
it
y
Normoxia mean log-intensity Normoxia mean log-intensity
Hy
p
o
x
ia
m
ean l
o
g-i
n
ten
s
it
y
Correlation of specific genes with predicted groups of miRNAs (miRanda/miRBase)
Figure 11
Correlation of specific genes with predicted groups of miRNAs (miRanda/miRBase). Panel a shows histogram of the p-values for miRNA groups of all coding genes represented in the study for miRanda/miRBase. Frequency on y-axis refers
to the number of genes involved. Panels b-d depict CFTR, NRBF2, and LARP1 as examples of mRNA regulation by
gene-spe-cific miRNA groups. The red dots indicate gene spegene-spe-cific miRNAs for each given gene.
a. b.
c. d.
Fre
que
nc
y
p-value Normoxia mean log-intensity
Hy
p
o
x
ia
m
ean l
o
g-i
n
ten
s
it
y
Hy
p
o
x
ia
m
ean l
o
g-i
n
ten
s
it
y
Normoxia mean log-intensity Normoxia mean log-intensity
Hy
p
o
x
ia
m
ean l
o
g-i
n
ten
s
it
Acknowledgements
This work was supported by Cystic Fibrosis Foundation (R464) and U.S. National Institutes of Health (P30DK072482, F30ES014987, U54 AT100949, 5T32HL072757-04 to SWE).
References
1. Zhang B, Wang Q, Pan X: MicroRNAs and their regulatory roles
in animals and plants. J Cell Physiol 2007, 210:279-289.
2. Bentwich I, Avniel A, Karov Y, Aharonov R, Gilad S, Barad O, Barzilai
A, Einat P, Einav U, Meiri E, et al.: Identification of hundreds of
conserved and nonconserved human microRNAs. Nat Genet
2005, 37:766-770.
3. Berezikov E, Cuppen E, Plasterk RH: Approaches to microRNA
discovery. Nat Genet 2006, 38(Suppl):S2-7.
4. Krek A, Grun D, Poy MN, Wolf R, Rosenberg L, Epstein EJ,
MacMe-namin P, da Piedade I, Gunsalus KC, Stoffel M, Rajewsky N:
Combi-natorial microRNA target predictions. Nat Genet 2005,
37:495-500.
5. Lewis BP, Shih IH, Jones-Rhoades MW, Bartel DP, Burge CB:
Predic-tion of mammalian microRNA targets. Cell 2003, 115:787-798.
6. Kiriakidou M, Nelson PT, Kouranov A, Fitziev P, Bouyioukos C,
Mourelatos Z, Hatzigeorgiou A: A combined
computational-experimental approach predicts human microRNA targets.
Genes Dev 2004, 18:1165-1178.
7. Enright AJ, John B, Gaul U, Tuschl T, Sander C, Marks DS:
Micro-RNA targets in Drosophila. Genome Biol 2003, 5:R1.
8. Griffiths-Jones S: The microRNA Registry. Nucleic Acids Res 2004,
32:D109-111.
9. Griffiths-Jones S, Grocock RJ, van Dongen S, Bateman A, Enright AJ:
miRBase: microRNA sequences, targets and gene nomencla-ture. Nucleic Acids Res 2006, 34:D140-144.
10. Ambros V, Bartel B, Bartel DP, Burge CB, Carrington JC, Chen X,
Dreyfuss G, Eddy SR, Griffiths-Jones S, Marshall M, et al.: A uniform
system for microRNA annotation. Rna 2003, 9:277-279.
11. Megraw M, Sethupathy P, Corda B, Hatzigeorgiou AG: miRGen: a
database for the study of animal microRNA genomic organ-ization and function. Nucleic Acids Res 2007, 35:D149-155.
12. Sethupathy P, Megraw M, Hatzigeorgiou AG: A guide through
present computational approaches for the identification of mammalian microRNA targets. Nat Methods 2006, 3:881-886.
13. Farh KK, Grimson A, Jan C, Lewis BP, Johnston WK, Lim LP, Burge
CB, Bartel DP: The widespread impact of mammalian
MicroR-NAs on mRNA repression and evolution. Science 2005,
310:1817-1821.
14. Sood P, Krek A, Zavolan M, Macino G, Rajewsky N:
Cell-type-spe-cific signatures of microRNAs on target mRNA expression.
Proc Natl Acad Sci USA 2006, 103:2746-2751.
15. Stark A, Brennecke J, Bushati N, Russell RB, Cohen SM: Animal
MicroRNAs confer robustness to gene expression and have a significant impact on 3'UTR evolution. Cell 2005,
123:1133-1146.
16. Camps C, Buffa FM, Colella S, Moore J, Sotiriou C, Sheldon H, Harris
AL, Gleadle JM, Ragoussis J: hsa-miR-210 Is induced by hypoxia
and is an independent prognostic factor in breast cancer. Clin
Cancer Res 2008, 14:1340-1348.
17. Donker RB, Mouillet JF, Nelson DM, Sadovsky Y: The expression
of Argonaute2 and related microRNA biogenesis proteins in normal and hypoxic trophoblasts. Mol Hum Reprod 2007,
13:273-279.
18. Fabbri M, Garzon R, Andreeff M, Kantarjian HM, Garcia-Manero G,
Calin GA: MicroRNAs and noncoding RNAs in hematological
malignancies: molecular, clinical and therapeutic implica-tions. Leukemia 2008, 22:1095-1105.
19. Fasanaro P, D'Alessandra Y, Di Stefano V, Melchionna R, Romani S,
Pompilio G, Capogrossi MC, Martelli F: MicroRNA-210 Modulates
Endothelial Cell Response to Hypoxia and Inhibits the Receptor Tyrosine Kinase Ligand Ephrin-A3. J Biol Chem 2008,
283:15878-15883.
20. Giannakakis A, Sandaltzopoulos R, Greshock J, Liang S, Huang J,
Hasegawa K, Li C, O'Brien-Jenkins A, Katsaros D, Weber BL, et al.:
miR-210 links hypoxia with cell cycle regulation and is deleted in human epithelial ovarian cancer. Cancer Biol Ther
2007, 7:255-264.
21. Kulshreshtha R, Davuluri RV, Calin GA, Ivan M: A microRNA
com-ponent of the hypoxic response. Cell Death Differ 2008,
15:667-671.
22. Kulshreshtha R, Ferracin M, Wojcik SE, Garzon R, Alder H,
Agosto-Perez FJ, Davuluri R, Liu CG, Croce CM, Negrini M, et al.: A
micro-RNA signature of hypoxia. Mol Cell Biol 2007, 27:1859-1867.
23. Zhang L, Volinia S, Bonome T, Calin GA, Greshock J, Yang N, Liu CG,
Giannakakis A, Alexiou P, Hasegawa K, et al.: Genomic and
epige-netic alterations deregulate microRNA expression in human epithelial ovarian cancer. Proc Natl Acad Sci USA 2008,
105:7004-7009.
24. Liu Y, Cox SR, Morita T, Kourembanas S: Hypoxia regulates
vas-cular endothelial growth factor gene expression in endothe-lial cells. Identification of a 5' enhancer. Circ Res 1995,
77:638-643.
25. Dickman KG, Mandel LJ: Glycolytic and oxidative metabolism in
primary renal proximal tubule cultures. Am J Physiol 1989,
257:C333-340.
26. Ohno K, Maier P: Cultured rat hepatocytes adapt their cellular
glycolytic activity and adenylate energy status to tissue oxy-gen tension: influences of extracellular matrix components, insulin and glucagon. J Cell Physiol 1994, 160:358-366.
27. Werrlein RJ, Glinos AD: Oxygen microenvironment and
respi-ratory oscillations in cultured mammalian cells. Nature 1974,
251:317-319.
28. Sahai A, Cole LA, Clarke DL, Tannen RL: Rocking promotes
dif-ferentiated properties in LLC-PK cells by improved oxygen-ation. Am J Physiol 1989, 256:C1064-1069.
29. Stevens KM: Oxygen requirements for liver cells in vitro.
Nature 1965, 206:199.
30. Allison DB, Gadbury G, Heo M, Fernandez JR, Lee C-K, Prolla TA,
Weindruch R: A mixture model approach for the analysis of
microarray gene expression data. Comput Stat Data Anal 2002,
39:1-20.
31. Gadbury G, Page G, Edwards J, Kayo T, Prolla TA, Weindruch R,
Per-mana PA, Mountz JD, Allison DB: Power and sample size
estima-tion in high dimensional biology. Stat Methods Med Res 2004,
13:325-338.
32. Liu G, Loraine AE, Shigeta R, Cline M, Cheng J, Valmeekam V, Sun S,
Kulp D, Siani-Rose MA: NetAffx: Affymetrix probesets and
annotations. Nucleic Acids Res 2003, 31:82-86.
33. Khatri P, Draghici S, Ostermeier GC, Krawetz SA: Profiling gene
expression using onto-express. Genomics 2002, 79:266-270.
34. Huber W, von Heydebreck A, Sultmann H, Poustka A, Vingron M:
Variance stabilization applied to microarray data calibration and to the quantification of differential expression.
Bioinfor-matics 2002, 18(Suppl 1):S96-104.
35. Benjamini Y, Hochberg Y: Controlling the false discovery rate: a
practical and powerful approach to multiple testing. J Roy Stat
Soc B 1995, 57:289-300.
36. Ashburner M, Ball CA, Blake JA, Botstein D, Butler H, Cherry JM,
Davis AP, Dolinski K, Dwight SS, Eppig JT, et al.: Gene ontology:
tool for the unification of biology. The Gene Ontology Con-sortium. Nat Genet 2000, 25:25-29.
37. Chu VB, Herschlag D: Unwinding RNA's secrets: advances in
the biology, physics, and modeling of complex RNAs. Curr
Opin Struct Biol 2008, 18:305-314.
38. Jankowsky E, Fairman ME: RNA helicases – one fold for many
functions. Curr Opin Struct Biol 2007, 17:316-324.
39. John B, Enright AJ, Aravin A, Tuschl T, Sander C, Marks DS: Human
MicroRNA targets. PLoS Biol 2004, 2:e363.
40. Baek D, Villen J, Shin C, Camargo FD, Gygi SP, Bartel DP: The
impact of microRNAs on protein output. Nature 2008,
455:64-71.
41. Bartel DP: MicroRNAs: target recognition and regulatory
functions. Cell 2009, 136:215-233.
42. Cannell IG, Kong YW, Bushell M: How do microRNAs regulate
gene expression? Biochem Soc Trans 2008, 36:1224-1231.
43. Eulalio A, Huntzinger E, Izaurralde E: Getting to the root of
miRNA-mediated gene silencing. Cell 2008, 132:9-14.
44. Kozak M: Faulty old ideas about translational regulation
paved the way for current confusion about how microRNAs function. Gene 2008, 423:108-115.
45. Guimbellot JS, Fortenberry JA, Siegal GP, Moore B, Wen H, Venglarik
C, Chen Y-F, Oparil S, Sorscher EJ, Hong JS: Role of oxygen in
Publish with BioMed Central and every scientist can read your work free of charge "BioMed Central will be the most significant development for disseminating the results of biomedical researc h in our lifetime."
Sir Paul Nurse, Cancer Research UK
Your research papers will be:
available free of charge to the entire biomedical community
peer reviewed and published immediately upon acceptance
cited in PubMed and archived on PubMed Central
yours — you keep the copyright
Submit your manuscript here:
http://www.biomedcentral.com/info/publishing_adv.asp
BioMedcentral
46. Mairbaurl H, Schwobel F, Hoschele S, Maggiorini M, Gibbs S, Swenson
ER, Bartsch P: Altered ion transporter expression in bronchial
epithelium in mountaineers with high-altitude pulmonary edema. J Appl Physiol 2003, 95:1843-1850.
Pre-publication history
The pre-publication history for this paper can be accessed here: