www.earth-syst-sci-data.net/8/651/2016/ doi:10.5194/essd-8-651-2016
© Author(s) 2016. CC Attribution 3.0 License.
An explicit GIS-based river basin framework for aquatic
ecosystem conservation in the Amazon
Eduardo Venticinque1, Bruce Forsberg2, Ronaldo Barthem3, Paulo Petry4, Laura Hess5, Armando Mercado6, Carlos Cañas6, Mariana Montoya6, Carlos Durigan7, and Michael Goulding8
1Universidade Federal do Rio Grande do Norte (UFRN), Dept. Ecologia, 59072-970, Natal, RN, Brazil 2Instituto Nacional de Pesquisas da Amazônia (INPA), Av. André Araújo 2936, Caixa Postal 478, Manaus,
AM, 69060-001, Brazil
3Museu Paraense Emilio Goeldi (Belém, Pará, Brazil), Caixa Postal 399, Belém, PA, 66040-170, Brazil 4The Nature Conservancy (TNC), 4245 N. Fairfax Drive, Arlington VA22203, USA & Harvard University,
Cambridge, MA 02138, USA
5Earth Research Institute, University of California, Santa Barbara, California 93106-3060 USA 6Wildlife Conservation Society (WCS), Av. Roosevelt No. 6360 Miraflores – Lima, Peru
7Wildlife Conservation Society (WCS), CP 4306, 69083-970, Manaus, Brazil 8Wildlife Conservation Society (WCS), 2300 Southern Boulevard, Bronx, NY 10460, USA
Correspondence to:Eduardo Venticinque ([email protected]) and Bruce Forsberg ([email protected])
Received: 10 May 2016 – Published in Earth Syst. Sci. Data Discuss.: 20 July 2016 Revised: 8 October 2016 – Accepted: 31 October 2016 – Published: 23 November 2016
Abstract. Despite large-scale infrastructure development, deforestation, mining and petroleum exploration in the Amazon Basin, relatively little attention has been paid to the management scale required for the protection of wetlands, fisheries and other aspects of aquatic ecosystems. This is due, in part, to the enormous size, multi-national composition and interconnected nature of the Amazon River system, as well as to the absence of an adequate spatial model for integrating data across the entire Amazon Basin. In this data article we present a spatially uniform multi-scale GIS framework that was developed especially for the analysis, management and monitoring of various aspects of aquatic systems in the Amazon Basin. The Amazon GIS-Based River Basin Frameworkis accessible as an ESRI geodatabase at doi:10.5063/F1BG2KX8.
1 Introduction
1.1 Amazon Basin system
The Amazon is the largest river basin in the world. Its strict hydrographical area covers 6.3 million km2 (Milliman and Farnsworth, 2011), and when the Tocantins Basin and es-tuarine coastal areas are included to define the Amazon re-gion, the total area is 7.287 million km2. The average dis-charge of the Amazon River at its mouth is approximately 206 000 m3s−1, contributing approximately 17 % of all river water reaching the world’s oceans, at least 4 times that of the Congo, the second largest tributary (Richey et al., 1986; Callede et al., 2004, 2010). Two of the Amazon River’s
character-ized by lake-like waterbodies where water depth prevents the establishment of forest but where large rooted and floating herbaceous communities develop, especially along whitewa-ter rivers that receive nutrients from the Andes (Junk, 1970; Piedade et al., 2010) and are under the strong influence of seasonal inundation pulses, which are monomodal for most of the lowland region and range from 5 to 15 m depending on the exact location but can be bimodal near the Equator or with numerous spikes in or near the Andes. Flooding in the easternmost part of the Amazon floodplain is tidally influ-enced though river discharge prevents an invasion of saltwa-ter except during the lowest wasaltwa-ter period in the Marajó Bay area (Barthem and Schwassmann, 1994). Due to a backwater effect caused by the temporally different contributions of the southern and northern tributaries, the Amazon River and the lower courses of most of its tributaries remain in flood longer than expected from the tributary flood pulses alone (Meade et al., 1991). During the high-water period the lower courses of the tributary basins also become functionally a part of the Amazon main stem and the latter, although not a basin, be-haves as an ecologically distinct hydrological unit.
The spatial and temporal variability in the river flood pulse and its influence on inundation patterns in floodplain envi-ronments play a fundamental role in sustaining the diversity and productivity of floodplain biota and the livelihoods of human populations throughout the Amazon. Infrastructural development, including plans to construct new dams, roads, and hydrovias across the basin, together with accelerating land use and climate change, threaten to disrupt this com-plex hydro-ecological system, with predictable negative con-sequences for the biota and river-dwelling populations that depend on its integrity. The conservation and management of the natural resources and services provided by this ecosystem will require a uniform hydrological framework, covering the entire Amazon region, specifically adapted for this objective.
1.2 Actual spatial framework
River basins are the most natural spatial units of aquatic ecosystems and are also the units generally used by the agencies or authorities (Agência/Autoridad Nacional de Águas/Agua – ANAs) charged with managing waters in Amazonian countries. The ANAs have traditionally used a basin coding system based on the work of Otto Pfafstet-ter, usually called the Pfafstetter Coding System (PfafstetPfafstet-ter, 1989), and the basins delineated in this system are referred to as Pfafstetter basins (or Otto basins, in Brazil). Each delin-eated basin is assigned an identification number that estab-lishes a hierarchical and sequential arrangement of basins, often with a larger basin divided into at least nine smaller units (Verdin and Verdin, 1999). The Pfafstetter methodol-ogy was applied to the Amazon Basin in the HydroSHEDS product, which includes 12 basin levels (Lehner and Grill, 2013) and has also been applied to North American river basins (Verdin and Verdin, 1999). Pfafstetter Basin
classifi-cations, especially those used by the ANAs, will undoubt-edly continue to be the geographical basis for water use management in Amazonian countries, but complementary classifications, adapted for specific local objectives, such as the development of the Strategic Plan of Hydrological Re-sources of the Right Margin of the Rio Amazonas have also been adopted (Agência-Nacional-de-Águas-(Brasil) – ANA, 2012). The Pfafstetter methodology and most other basin classifications, used to date in the Amazon, have not con-sidered the main stem and its associated floodplains as a hydrological unit. These areas contain the most productive river and wetland habitats and should thus be managed in the same way as large tributary basins. By including the main channel and surrounding floodplains of the Amazon River and it largest tributaries as discrete sub-basins in a regional basin hierarchy, we have produced a new spatially explicit integrated river basin framework, specifically adapted for the management and conservation of the Amazon fluvial ecosys-tem.
The digital river networks currently available for the Ama-zon region also lack some aspects essential for the man-agement of aquatic ecosystems. The HydroSHEDS prod-uct (http://hydrosheds.cr.usgs.gov/index.php), the most ac-curate and regionally uniform river network that was avail-able previous to the present work, lacks lower-order streams which are important habitats for many aquatic organisms; an equally uniform but higher-resolution vector product was thus needed to include these habitats. Ecologically and ge-ographically important attributes such as stream order, river name, river length and water type are also needed for a spa-tially robust conservation and management framework.
Accelerating land use, infrastructure development and re-source exploitation present a growing threat to the integrity of the Amazon River ecosystem (Castello and Macedo, 2016). TheAmazon GIS-Based River Basin Framework pre-sented here, including an ecologically consistent basin hi-erarchy and a spatially uniform, high-resolution, classified river drainage network, should help by providing a spatial basis to increase the scope of management and conservation efforts to meet the challenges of large-scale impacts.
1.3 Data
Two types of hydrological data are included in this spatial framework for the Amazon Basin.
area, including main stem floodplain sub-basins, thus al-lowing data analyses at variable scales.
2. Line: a new high-density drainage network containing important geographical attributes, including stream or-der (1–11th oror-der), tributary name (6–11th oror-der), river type (6–11th order) and distance above the Amazon River mouth (4–11th order).
2 Materials and methods
2.1 Acquisition and correction of DEM (digital elevation model)
To obtain a spatially uniform and high-resolution stream net-work and drainage basin hierarchy for the Amazon Basin, flow direction and flow accumulation patterns were derived from the 90 m resolution SRTM-DEM, which was the most accurate DEM available for the South American continent. The near-global Shuttle Radar Topography Mission (SRTM) digital elevation data set (Farr et al., 2007) was developed by NASA and the US National Geospatial-Intelligence Agency for the entire Earth using stereo C-band imagery acquired by the space shuttleEndeavourin February of 2000, which corresponds to the early rising water period in the central Amazon region, when the Amazon main stem begins its 10– 12 m annual flood cycle. The data product has a spatial res-olution of 3 arcsec, approximately 90 m in the Amazon re-gion, and a vertical accuracy of 1 m locally and 4 m globally. Like most DEMs derived from synthetic aperture radar, the SRTM-DEM contains regions where useable data were not obtained (voids) and also regions where spatial variation in elevations are close to the vertical accuracy of the product, and consequently poorly represented. These latter areas in-clude large lakes, river channels and wetlands. Furthermore, the SRTM DEM is not a “bare earth” DEM, but represents the elevation of a scattering centroid that varies as a func-tion of vegetafunc-tion height and density (Carabajal and Hard-ing, 2005). For our analysis, we used the version 4.1 DEM available through CGIAR-CSI (Lehner et al., 2006). This “void-filled” DEM was provided in 6000×6000 pixel pan-els which we mosaicked using the “mosaic tool” in ArcGis 10.1 (ESRI, 2012) to produce a uniform DEM covering all of South America above 22◦south latitude.
Three additional modifications of the SRTM-DEM mosaic were performed before flow direction patterns were analyzed to improve the quality of the final drainage network. First, we manually modified the DEM at one location in the headwa-ters of the Caquetá River in Colombia where the river passed through a channel in a large rock formation that was so nar-row that it was not represented in the DEM. To ensure that water “flowed” through this point in the final stream network, it was necessary to “excavate” the channel digitally so that it was wider than the 90 m resolution of the DEM image. This was done by changing the elevation values of the rock
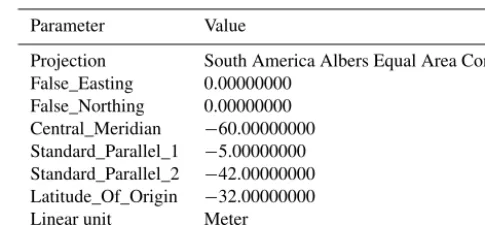
forma-Table 1.Parameter configuration of projection used for all calcula-tions of area and length in this database.
Parameter Value
Projection South America Albers Equal Area Conic False_Easting 0.00000000
False_Northing 0.00000000 Central_Meridian −60.00000000 Standard_Parallel_1 −5.00000000 Standard_Parallel_2 −42.00000000 Latitude_Of_Origin −32.00000000 Linear unit Meter
tion in the DEM to those of the river channel. In the second modification, the DEM was “reconditioned” to ensure that the main river channels followed a more precise path as they crossed the extensive floodplains in the central Amazon low-lands. This was done by lowering the elevation of all cells in the DEM along channels≥7th order in the lower resolution HydroSHEDS stream product (Lehner et al., 2008). Finally, a “Fill Sinks” procedure was used to fill any remaining depres-sions in the reconditioned DEM which might impede water flow. This was done by raising the elevation values of all cells completely surrounded by higher elevation cells.
All GIS analyses were performed in ArcGis 10.1 (ESRI, 2012) and Arc Hydro 2.0 (Arc Hydro, 2011).
2.2 Area of basins and length of river calculations For all calculations of area of the basins, length of rivers and distance to the mouth we used the Albers projection with the following parameter configuration (Table 1).
2.3 Drainage network development
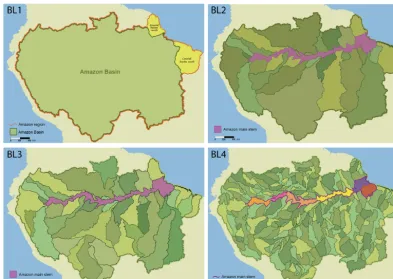
Figure 1.Cartographic representation of the first four levels of the classification of the Amazon and adjacent coastal basins (south and north): BL1, BL2, BL3 and BL4. BL: basin level.
with the flow direction raster to create an ordered stream raster. This was done by replacing the nonzero values in the stream raster with values of stream order as defined by Strahler (1957). This ordered stream raster was then vec-torized to produce a single high-resolution stream network shapefile for the entire Amazon Basin containing a stream or-der attribute. The calculated stream oror-der varied from 1st to 11th order in this product, which is probably underestimated by 1 order, since the drainage areas of first-order streams, de-fined by Strahler (1957) as permanent streams with no per-manent upstream tributaries, tend to vary from 10 to 50 ha in the central Amazon Basin. Assuming that this is correct, the smallest streams in the stream network developed here would be approximately 2nd order and the Amazon River main channel near its mouth would be 12th order. The order included in the attribute table of the final shapefile was the value generated originally by the stream order tool. Three different stream network shapefiles were created from this high-resolution product, containing streams from 1st to 11th order, 6 to 11th order and 7 to 11th order, respectively. Trib-utary names, derived from existing databases, were added to the 6–11th-order river network. The shapefile containing 1– 11th-order streams was filtered to remove anomalous first- to third-order streams which were generated on open water sur-faces and wetlands due to the inaccuracy of the DEM and the flow direction raster that was generated from it. These
anomalies consisted of spurious low-order stream segments, generated predominantly in low-relief wetland environments where variation in elevation was either extremely low (open water environments) or due primarily to variations in vegeta-tion height. The filter eliminated first- to third-order streams present in the wetland mask and stream segments adjacent to and intersecting the mask that were delimited by BL7 basins. While most of the anomalous segments were removed by the filter, some are still apparent at higher resolutions. The length (km) of each segment in the full-resolution network was cal-culated with the South America Albers Equal Area Conic projection. All GIS analyses were performed in ArcGis 10.1 (ESRI, 2012) and Arc Hydro 2.0 (Arc Hydro, 2011).
2.4 Development of basin hierarchy
Seven different scales or hierarchical levels were delineated in our basin hierarchy, denominated basin level 1 (BL1) to basin level 7 (BL7) (Figs. 1 and 2).
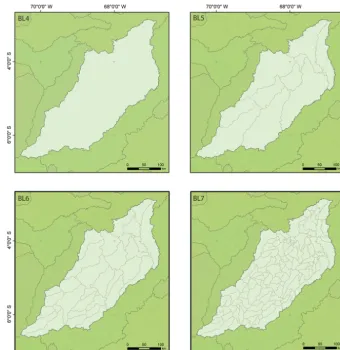
Figure 2.Cartographic representation of Amazon Basin classification levels 4, 5, 6 and 7.
– Basin level 1 (BL1),regional basins– divides the work-ing area into three drainage polygons: one large polygon containing the Amazon and Tocantins river basins and two smaller ones containing the northern and southern coastal basins draining directly into the Atlantic.
– Basin level 2 (BL2), major Amazon tributary basins – delimits all tributary basins larger than 100 000 km2 (main basins) whose main stems flow into the Amazon River main channel, as well as an Amazon River main stem polygon that consists of the open waters of the Amazon River, its floodplain and adjacent small trib-utary basins (Fig. 3).
– Basin level 3 (BL3),major tributary basins– delimits all basins larger than 100 000 km2, including those that do not flow directly into the Amazon River main chan-nel, all tributary basins larger than 10 000 km2and less than 100 000 km2that flow into the Amazon River main stem, and a single central floodplain drainage polygon.
– Basin level 4 (BL4), minor tributary basins– delim-its all tributary basins greater than 10 000 km2and less
than 100 000 km2. Floodplain drainages include all trib-utaries with basins less than 10 000 km2flowing toward the floodplain at high water.
– Basin levels 5–7, minor sub-basins – the remaining three basin levels, BL5, BL6 and BL7, were created by subdividing BL4 basins into drainage subunits with threshold sizes of 5000, 1000 and 300 km2, respectively.
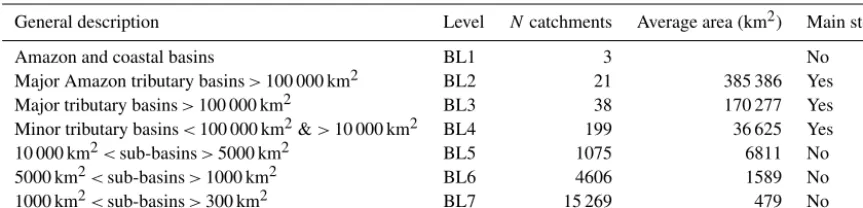
Table 2.General description of catchments system for Amazon region.
General description Level Ncatchments Average area (km2) Main stem Amazon and coastal basins BL1 3 No Major Amazon tributary basins>100 000 km2 BL2 21 385 386 Yes Major tributary basins>100 000 km2 BL3 38 170 277 Yes Minor tributary basins<100 000 km2&>10 000 km2 BL4 199 36 625 Yes 10 000 km2<sub-basins>5000 km2 BL5 1075 6811 No 5000 km2<sub-basins>1000 km2 BL6 4606 1589 No 1000 km2<sub-basins>300 km2 BL7 15 269 479 No
and segmented stream rasters developed at these scales, using a “catchment grid delineation” tool. The segmented stream rasters were generated from stream raster files created with these thresholds and the flow direction raster, using a “stream segmentation” tool. This tool separated stream raster reaches between confluences into separate segments and attributed the cells in each segment a unique identifying code. The flow direction raster was then used to aggregate the drainage cells associated with each segment. These raster sub-basins were then transformed into separate polygons using a “catch-ment polygon processing” tool. This tool delineated the lim-its of each raster sub-basin. Sub-basin areas in each shapefile ranged between its defining stream raster threshold and the stream raster threshold of the next basin level. General char-acteristics and statistics for each basin level are summarized in Table 2. All GIS analyses were performed in ArcGis 10.1 (ESRI, 2012) and Arc Hydro 2.0 (Arc Hydro, 2011).
2.5 Definition of floodplain drainage polygons
Large river floodplains play an important role in the Amazon, sustaining aquatic primary production and fish yields in the region. At high water, when the inundated area of floodplains is greatest, many small tributaries are completely flooded, al-tering regional drainage patterns. Many of these tributaries which are independent of the main channel at low water are “captured” by flooding and incorporated in the main stem drainage at high water. Due to their ecological importance, we prioritized these high water drainage patterns in the de-lineation of floodplain drainage polygons. The drainage ar-eas of major tributary floodplains were delineated initially at the BL4 level with the drainage network derived from the DEM and then adjusted manually with a wetland mask to better represent high water drainage patterns. The wetland mask used to identify floodplain environments was gener-ated by Hess et al. (2015a, b) from the analysis of JERS-1 L-band radar imagery covering most of the lowland Ama-zon Basin acquired during both low- and high-water periods. Detailed methods are provided in the original reference. Wet-lands were defined as areas that were inundated during either of both periods together with areas adjacent to flooded areas which displayed landforms consistent with floodplain
geo-morphology. Tidal wetlands in the lower Amazon and To-cantins rivers that were missing from this product were de-lineated here using a similar methodology and then annexed to the larger Amazon Basin mask. The final wetland mask, together with the BL5 and BL7 sub-basin shapefiles, was used to identify and delimit the floodplain drainages of ma-jor tributaries. Floodplain drainages were defined to include all main stem floodplain wetlands identified with the mask plus all upland sub-basins less than 10 000 km2that flowed directly into them. All tributary wetland drainage polygons were attributed with the name of the associated major trib-utary. The floodplain drainage associated with the Amazon River main stem was further divided into four areas based on geomorphology (Dunne et al., 1998), habitat distribution (Hess et al., 2015a) and fisheries.
Once all major floodplain drainages were delineated, vec-tored data and metadata were added and then aggregated as polygons to the BL4 shapefile and as attributes to the BL5, BL6 and BL7 shapefiles.
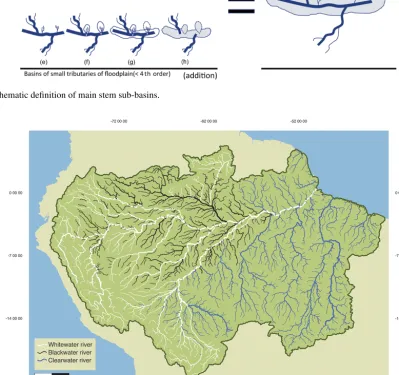
2.6 Classification of river type
Figure 3.Schematic definition of main stem sub-basins.
Figure 4.Cartographic representation of Amazon River type classification.
near some urban areas. It should be noted that both meth-ods are qualitative and subject to error. Apparent water color refers to the color of light reflected from the water surface and, for the three classes defined here, depends primarily on the concentrations of suspended sediments and dissolved or-ganic carbon (DOC), either of which can vary considerably in the same river over time. Existing field observations and satellite acquisitions are limited and do not accurately reflect the full temporal variability in these parameters. The classifi-cation provided here should therefore be considered prelimi-nary until more frequent observations of water color or mea-surements of DOC and suspended sediments become
avail-able. The resulting preliminary classification of river types based on water color is shown in Fig. 4.
2.7 Definition and mapping of fish spawning nodes Many migratory characiform fish species spawn at the confluences of whitewater and blackwater or clearwater rivers (Goulding, 1980, 1988; Ribeiro and Petrere-Jr., 1990; Araujo-Lima and Ruffino, 2004).
conflu-Figure 5.Cartographic representation of important confluence areas for spawning, derived from the intersection of spawning nodes and sub-basins or main stem drainages important for commercial fishing.
ence in the 6–11th-order river network into a point. Next a buffer of 1000 m around each point was generated in or-der to define the confluence areas where spawning takes place. For each buffer area a spatial join was applied for the following information: order and type of tributary and order and type of river into which tributary flows. Impor-tant confluence areas for spawning were then derived from the intersection of spawning nodes and sub-basins or main stem drainages important for commercial fishing. Two shape-files with confluence nodes were generated: (1) “NodesGen-eral”, where the nodes represent all confluences between rivers above sixth order, independent of water color, and (2) “Nodes_MainStemFishRegion”, where the nodes repre-sent the confluences of all tributaries above sixth order with the main stems of the Amazon river and its principal white-water tributaries. These whitewhite-water main stem confluences are the most important for commercial fishing activities. The TRIB-SIZE field in the attribute tables of the “NodesGen-eral” and “Nodes_MainStemFishRegion” shapefiles refers to the minimum order of the smallest tributary in the conflu-ence, “Big’ being>7th order and “Small” being≤7th order. The resulting distribution of fish spawning zones is indicated in Fig. 5.
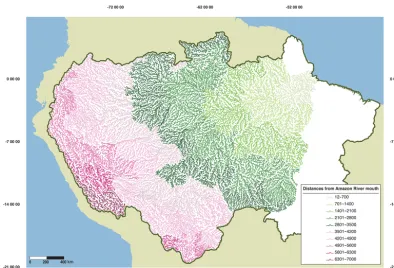
2.8 River distances
Distances along the river network from the mouth of the Amazon River to specific points in the river system can be
important for characterizing spawning routes and calculating the resident time and velocities of fish larvae/juvenile dur-ing downstream migrations and other materials in the system. Distances from the Amazon’s mouth to all stream segments between 4th and 11th order were calculated using the Bar-rier Analysis Tool (BAT) extension for ArcMap 10.1 devel-oped for the Nature Conservancy (software developer: Dun-can Hornby of the University of Southampton’s GeoData Institute). The tool uses point data to divide a routed river network (polylines with from-node and to-node coding) into connected networks from which a direct path distance cal-culation can then be made. The data provide distances not only to specific points from the Amazon River mouth but also to distant regions (Fig. 6). Distance values and stream order were included as segment attributes in the final river network shapefile.
3 Data availability
Interested researchers can access the data and metadata at doi:10.5063/F1BG2KX8 (Venticinque et al., 2016).
4 Conclusions
Figure 6.Cartographic representation of river distances from Amazon River mouth.
including the Amazon Basin and Amazon region as a whole. Its architecture is appropriate for use in the monitoring and management of aquatic ecosystems, especially within an in-tegrated river basin management framework at distinct spa-tial scales. The principal data products provided in the GIS include the following:
1. A multi-level basin hierarchy specifically designed for the conservation and management of river basins and floodplain environments at a variety of basin and sub-basin scales.
2. A high-resolution, spatially uniform, ordered drainage network for the Amazon Basin and its adjacent coastal basins (coastal north, coastal south and Tocantins).
3. A first approximation of river types based on water color as a proxy for distinct chemical characteristics, included as an attribute for 6–11th-order tributaries.
4. Estimates of the distance of individual stream segments from the mouth of the Amazon River, included as an attribute for 4–11th-order streams in the Amazon basin.
5. A point shapefile indicating confluences (nodes) of dif-ferent river types that are critical spawning zones for migrating fish species.
This regional hydrological database provides a coherent framework for the integration and analysis a wide array of
spatial data, critical for management and conservation of this valuable fluvial ecosystem.
Author contributions. Michael Goulding coordinated the gen-eral development of this GIS framework; Eduardo Venticinque and Bruce Forsberg processed the data to generate the hydrog-raphy and basins; and Eduardo Venticinque, Bruce Forsberg, Ronaldo B. Barthem, Michael Goulding, and Paulo Petry prepared the manuscript with contributions from Armando Mercado, Car-los Cañas, Mariana Montoya and CarCar-los Durigan. Laura Hess pre-pared the wetland mask for the Tocantins Basin and the estuary to complete the wetland mask for most of the Amazon Basin.
(Funbio, Brazil and previously the Gordon and Betty Moore Foundation) and Enrique Ortiz (the Andes-Amazon Fund and previously the Gordon and Betty Moore Foundation). We also thank the Museu Paraense Emilio Goeldi (MPEG) and the Instituto Nacional de Pesquisas da Amazônia (INPA) for their support. For fisheries data we are indebted to the following institutions and their respective individuals: Instituto de Desenvolvimento Sustentável Mamirauá, Brazil (Helder Queiroz, Pollianna Santos Ferraz); the Colônia de Pescadores de Porto Velho, Brazil; the Dirección Regional de la Producción (DIREPRO), Peru; Eletronorte – Centrais Elétricas do Norte do Brasil S/A, Brazil; the Ministério da Agricultura, Pecuária e Abastecimento (MAPA), Brazil; the Ministério da Pesca e Aquicultura (MPA), Brazil; and the Projeto Manejo dos Recursos Naturais da Várzea (Provárzea), Brazil and Junior Chuctaya (Museo de Historia Natural, Universidad Nacional Mayor de San Marcos). Meteorological data were supplied by the Servicio Nacional de Meteorología e Hidrología del Perú (SENAMHI). Financial support was provided by the David and Lucile Packard Foundation (grant # 2013-38757 & #2014-39828) – https://www.packard.org/; Ward Woods (grant # 309519) ; Wildlife Conservation Society (WCS) – http://www.wcs.org/; the Nature Conservancy (TNC) – http://www.nature.org; and the Gordon and Betty Moore Foundation (grant # 500) – https://www.moore.org/. E. M. Venticinque received a productivity grant from the Conselho Nacional de Pesquisas – CNPq (309458/2013-7). L. Hess received support from NASA’s Land-Cover and Land-Use Change program (NNX12AD27G).
Edited by: D. Carlson
Reviewed by: A. Schäfer and one anonymous referee
References
Agência-Nacional-de-Águas-(Brasil) – ANA: Plano Estratégico de Recursos Hídricos dos Afluentes da Margem Direita do rio Ama-zonas: Resumo Executivo, Agência Nacional de Águas (ANA, Brasil), Brasília, 144 pp., 2012.
Araujo-Lima, C. A. R. M. and Ruffino, M. L.: Migratory fishes of the Brazilian Amazon, in: Migratory Fishes of South America: Biology, Fisheries and Conservation Status, edited by: Carols-field, J., Harvey, B., Ross, C., and Baer, A., 62–75, World Fish-eries Trust/World Bank/IDRC, 2004.
Arc Hydro Tools: Tutorial Version 2.0. ESRI, 380 New York Street, Redlands, USA, 2011.
Barthem, R. B. and Schwassmann, H. O.: Amazon river influence on the seasonal displacement of the salt wedge in the Tocantins River Estuary, Brazil, 1983–1985, Boletim do Museu Paraense Emílio Goeldi (Zoologia), 10, 119–130, 1994.
Callede, J., Guyot, J., Ronchail, J. L., Hote, Y., Niel, H., and Oliveira, E.-S.: Evolution du d’ebit de l’Amazone à Obidos de 1903 à 1999, Hydrolog. Sci. J, 49, 85–98, 2004.
Callede, J., Cochonneau, G., Ronchail, J., Alves, V., Guyot, J., Guimaraes, V., and Oliveira, E.-D.: Les apports en eau de l’Amazone a l’Ocean Atlantique, Rev. Sci. l’Eau, 23, 247–273, 2010.
Carabajal, C. C. and Harding, D. J.: .ICESat validation of SRTM C-band Digital Elevation Models, Geophys. Res. Lett., 32, L22S01, doi:10.1029/2005GL023957, 2005.
Castello, L. and Macedo, M. N.: Large-scale degradation of Amazo-nian freshwater ecosystems, Glob. Change Biol., 22, 990–1007, 2016.
Cunha, C. N. D., Piedade, M. T. F., and Junk, W.: Classificação e Delineamento das Áreas Úmidas Brasileiras e de Seus Macro-habitats, EdUFMT, Cuiabá, 2015.
Dunne, T., Mertz, L. A. K., Meade, R. H., Richey, J. E., and Fors-berg, B. R.: Exchange of sediment between the channel and floodplain of the Amazon River, Brazil Geological Society of America Bulletin, 110, 450–467, 1998.
ESRI: ArcGIS Desktop: Release 10.1. Redlands, CA: Environmen-tal Systems Research Institute, 2012.
Farr, T. G., Rosen, P. A., Caro, E., Crippen, R., Duren, R., Hens-ley, S., Kobrick, M., Paller, M., Rodriguez, E., Roth, L., Seal, D., Shaffer, S., Shimada, J., Umland, J., Werner, M., Oskin, M., Bur-bank, D., and Alsdorf, D.: The shuttle radar topography mission, Rev. Geophys., 45, 1–33, 2007.
Goulding, M.: The Fishes And The Forest : Explorations in Ama-zonian Natural History, University of California Press, Berkeley & Los Angeles, 1980.
Goulding, M.: Ecology and management of migratory food fishes of the Amazon Basin, in: Tropical Rainforests: Diversity and Con-servation, edited by: Almeda, F. and Pringle, C. M., California Academy of Sciences, 71–86, San Francisco, 1988.
Hess, L. L., Melack, J. M., Affonso, A. G., Barbosa, C., Gastil-Buhl, M., and Novo, E. M.: Wetlands of the lowland Amazon basin: Extent, vegetative cover, and dual-season inundated area as mapped with JERS-1 Synthetic Aperture Radar, Wetlands, 35, 745–756, 2015a.
Hess, L. L., Melack, J. M., Affonso, A. G., Barbosa, C. C. F., Gastil-Buhl, M., and Novo, E. M. L. M.: LBA-ECO LC-07 Wetland Extent, Vegetation, and Inundation: Lowland Amazon Basin. ORNL DAAC, Oak Ridge, Tennessee, USA, doi:10.3334/ORNLDAAC/1284, 2015b.
Junk, W. J.: Investigations on the ecology and production-biology of the floating meadows (Paspalo-Echinochloetum) on the middle Mmazon. Part I: The floating vegetation and its ecology, Amazo-niana, 2, 449–495, 1970.
Junk, W., Piedade, M. T. F., Lourival, R., Wittmann, F., K., P., Lac-erda, L. D., Bozelli, R. L., Esteves, F. A., Nunes da Cunha, C., Maltchik, L., and Schöngart, J.: Definição e classificação das Áreas Úmidas (AUs) brasileiras: base científica para uma nova política de proteção e manejo sustentável, Cuiabá, CPP/INAU, 2012.
Lehner, B. and Grill G.: Global river hydrography and network rout-ing: baseline data and new approaches to study the world’s large river systems, Hydrol. Process., 27, 2171–2186, 2013.
Lehner, B., Verdin, K., and Jarvis, A.: HydroSHEDS, Hy-droSHEDS, Technical Documentation, 1, 1–27, 2006.
Lehner, B., Verdin, K., and Jarvis, A.: New global hydrography de-rived from spaceborne elevation data, EOS T. Am. Geophys. Un., 89, 93–94, 2008.
Mathews, G. V. T.: The Ramsar Convention on Wetlands: Its History and Development, Ramsar Convention Bureau, Gland, Switzer-land, 90 pp., 2013.
Melack, J.: Aquatic ecosystems, in: The Large-scale Biosphere At-mosphere Experiment in Amazonia, edited by: Nagy, L., Fors-berg, B., and Artaxo, P., Ecological Studies, Springer, Berlin, 2016.
Melack, J. and Hess, L.: Remote sensing of the distribution and ex-tent of wetlands in the Amazon Basin in: Amazonian Floodplain Forests: Ecophysiology, Biodiversity and Sustainable Manage-ment, edited by: Junk, W. J., Piedade, M. T. F., Wittmann, F., Schöngart, J., and Parolin, P., Springer Verlag, New York, 2010. Milliman, J. D. and Farnsworth, K. L.: River Discharge to the Coastal Ocean: A Global Synthesis, Cambridge University Press, Cambridge, 2011.
Pfafstetter, O.: Classificação de Bacias Hidrográficas – Metodologia de Codificação, Rio de Janeiro, 1–19, 1989.
Piedade, M. T. F., Junk, W., D‘Ângelo, S. A., Wittmann, F., Schön-gart, J., Barbosa, K. M. D. N., and Lopes, A.: Aquatic herba-ceous plants of the Amazon floodplains: State of the art and research needed, Acta Limnologica Brasiliensia, 22, 165–178, doi:10.4322/actalb.02202006, 2010.
Ribeiro, M. C. L. B. and Petrere-Jr., M.: Fisheries ecology and man-agement of the jaraqui (Semaprochilodus taeniurus,S. insignis) in Central Amazonia, Regulated Rivers: Research & Manage-ment, 5, 195–215, 1990.
Richey, J. E., Meade, R. H., Salati, E., Devol, A. H., and Santos, U.: Water discharge and suspended sediment concentrations in the Amazon River: 1982–1984, Water Resour. Res., 22, 756–764, 1986.
Sioli, H.: Hydrochemistry and geology in the Brazilian Amazon re-gion, Amazoniana, 1, 267–277, 1968.
Strahler, A. N.: Quantitative analysis of watershed geomorphology, EOS T. Am. Geophys. Un., 38, 913–920, 1957.
Venticinque, E., Forsberg, B., Barthem, R. B., Petry, P., Hess, L., Mercado, A., Canas, C., Montoya, M., Durigan, C., and Goulding, M.: SNAPP Western Amazon Group – Amazon Aquatic Ecosystem Spatial Framework, KNB Data Repository, doi:10.5063/F1BG2KX8, 2016.