R E S E A R C H A R T I C L E
Open Access
Effects of a dietary supplement on golf drive
distance and functional indices of golf
performance
Tim N Ziegenfuss
1*, Scott M Habowski
1, Robert Lemieux
2, Jennifer E Sandrock
1, A William Kedia
1,
Chad M Kerksick
3and Hector L Lopez
1Abstract
Background:Limited research exists examining the impact of nutrition on golfing performance. This study’s purpose was to determine the impact of daily supplementation with an over-the-counter dietary supplement on golf performance.
Methods:Healthy men (30.3 ± 6.9 y, 183.1 ± 5.6 cm, 86.7 ± 11.9 kg), with a 5–15 handicap were assigned in a double-blind, placebo-controlled manner to ingest for 30 days either a placebo (PLA, n = 13) or a dietary
supplement containing creatine monohydrate,coffea arabicafruit extract, calcium fructoborate and vitamin D
(Strong Drive™, SD, n = 14). Subjects ingested two daily doses for the first two weeks and one daily dose for the remaining two weeks. Participants followed their normal dietary habits and did not change their physical activity patterns. Two identical testing sessions in a pre/post fashion were completed consisting of a fasting blood sample, anthropometric measurements, 1-RM bench press, upper body power and golf swing performance using their driver and 7-iron. Data were analyzed using two-way mixed factorial ANOVAs and ANCOVA when baseline differences were present. Statistical significance was establisheda prioriat p≤0.05.
Results:ANCOVA revealed significantly greater (post-test) best drive distance (p = 0.04) for SD (+5.0% [+13.6 yards], ES = 0.75) as well as a tendency (p = 0.07) for average drive distance to increase (+8.4% [+19.6 yards], ES = 0.65), while no such changes were found with PLA (−0.5% [−1.2 yards], ES = 0.04 and +1.3% [+2.8 yards], ES = 0.08, respectively). Both groups experienced significant increases in body mass and 1-RM bench press (p < 0.001). No other significant group × time interactions were found. For the SD group only, within-group analysis confirmed significant improvements in set 1 average (+8.9%, p = 0.001) and peak velocity (+6.8%, p < =0.01). No changes were noted for reported adverse events, pain inventories, quality of life or any measured blood parameter.
Conclusions:SD supplementation for 30 days significantly improved best drive distance more than placebo. Supplementation was well tolerated and did not result in any clinically significant changes in markers of health or adverse events/side effect profiles.
Keywords:Golf, Performance, Creatine, Drive distance, Velocity, Driver
* Correspondence:tz@appliedhealthsciences.org 1
The Center for Applied Health Sciences, 4302 Allen Road, Ste 120, Stow, OH 44224, USA
Full list of author information is available at the end of the article
Introduction
The sport of golf requires an intricate mix of physical, emotional and cognitive factors to achieve optimal per-formance [1]. The swing itself is a complex pattern of coordinated biomechanical movements that impact both the accuracy and distance with which the ball is struck. In its purest sense, the golf swing is a movement cen-tered mostly upon the production of power; conse-quently, swings are considered to be largely anaerobic in nature [1].
As the popularity of golf rises, the development of er-gogenic approaches have produced a seemingly endless array of clubs and other pieces of equipment intended to help improve performance. In light of the physical and cognitive challenges brought forth by golf, nutritional approaches may impact performance, but minimal effort, to date, has been made in this area.
The lack of nutritional considerations within the sport of golf is somewhat surprising. Currently, nutritional guidelines center upon prudent management of fluid and carbohydrate levels, but other demands found in golf present the need for additional nutritional concerns. For example, under certain environmental conditions the ex-tended duration to complete a round of golf (~3–4 hours) can promote dehydration, reduced energy levels and mental fatigue [1]. When these factors are considered collectively, it makes intuitive sense that a nutritional formulation that can improve anaerobic performance and increase a golfer’s focus and attention may impact performance. In this respect, one of the only published studies to examine the impact of a nutritional agent on golfing performance utilized phosphatidylserine sup-plementation to lower the stress hormone cortisol and improve shot-making during simulated golf swings [2]. SuperDrive™(Purity Products, Plainview, NY) is a com-mercially available dietary supplement that combines creatine monohydrate, coffee arabica fruit extract, calcium fructoborate and vitamin D and is marketed to the golfing community to aid in performance and re-covery from musculoskeletal complications associated with participation in golf [1].
Creatine monohydrate is one of the most popular and effective dietary supplements due to its ability to improve strength, power, lean mass and explosive performance. Creatine supplementation protocols are well established to significantly increase intramuscular levels of phospho-creatine and total phospho-creatine which, in the vast majority of studies, result in measureable improvements in a wide variety of high-intensity activities [3-8]. However, to our knowledge, no research is available that has examined the impact of creatine supplementation on golfing perform-ance. In light of the fact that the golf swing is an anaerobic event [1], it is logical that creatine supplementation may have the potential to improve golf swing power.
Coffea arabica is a fruit extract (CoffeeBerry®) that is derived from the same plant as traditional coffee, thus making caffeine the primary active ingredient found within the extract. For years, scientific research has sup-ported the use of caffeine as an ergogenic aid, primarily known for its positive impact on executive functions such as focus, attention and concentration, stimulation of fatty acid mobilization, improvements in endurance performance [9], and various direct effects on muscle function [10,11]. From a physical perspective, caffeine is known to antagonize adenosine receptors, thereby inhibit-ing the negative impact of adenosine on neurotransmission, arousal, and pain perception [12] in addition to reducing ratings of perceived exertion [13]. Beyond physical benefits, caffeine can also operate to enhance a number of cognitive aspects. Caffeine is commonly used and accepted for its ability to promote wakefulness as well as enhance focus and concentration, all attributes that would be of particular benefit to a golfer, while also preventing both peripheral and central manifestations of fatigue [10]. An excellent review by Glade summarized available literature on caffeine’s impact of cognitive functioning and reported that caffeine in doses in modest amounts (30–50 mg) are able to favorably impact mental energy, but typical doses of 100 –150 mg are needed to positively impact assessments of cognitive functioning [10]. Similarly, Einother and investigators expertly summarized the lit-erature and concluded that caffeine favorably impacts both simple and complex tasks through both attention enhancement and optimized executive function [14].
literature utilized a two-week double-blind, placebo-controlled supplementation approach on 116 osteopor-otic patients and concluded that calcium fructoborate supplementation improved inflammatory markers for all groups [20].
Another ingredient that continues to get attention regarding its ability to favorably impact bone health [21] and healthy muscle metabolism [22-24] is vitamin D. The average adult American diet contains only 150–300 IU of vitamin D per day while recommended levels are 600–800 IU, despite multiple studies indicat-ing that higher daily amounts may be optimal [21,25]. Currently, the Endocrine Society recommends 1,500 – 2,000 IU/day, with other reports recommending between 400 – 1,000 IU/day. To date, the impact of supple-mentation with vitamin D (either in isolation or as part of a multi-ingredient formula) on golf performance is unknown.
The primary purpose of this preliminary, proof-of-concept investigation was to examine the impact of a nutritional formulation containing creatine, coffea
arabica fruit extract (CoffeeBerry®), calcium fructoborate (FruiteX-B®) and vitamin D on functional indices of golf swing performance, and upper-body strength/power. Sec-ondary purposes were to assess changes in indices of qual-ity of life, pain and standard blood-based markers of clinical safety and health.
Methods
Overview of research design
This study was completed as a randomized, double-blind, placebo-controlled trial. Over a 30 day period, eligible study participants who first signed an IRB-approved in-formed consent document were assigned in a randomized, double-blind, placebo-controlled fashion to ingest either a dietary supplement or a placebo. In an identical fashion, two daily supplement (or placebo) doses were ingested during the first two weeks and one daily dose was ingested during the final two weeks for 30 days total. Prior to test-ing, all study participants were instructed to refrain from heavy exercise for 48 hours and observe a 12 hour fast. To enhance reliability and minimize a learning effect, subjects were familiarized to all experimental procedures prior to testing. Participants then completed two identical testing sessions consisting of a fasting blood sample, anthropo-metric assessments, resting heart rate and blood pressure, muscular strength and power assessments, golf swing performance, and quality of life, pain and adverse event questionnaires. To determine indications of clinical safety, fasting blood samples were collected and ana-lyzed for complete blood counts, clinical chemistry panels and other indicators of health and safety along with resting levels of heart and blood pressure. To as-sess changes in strength and power and evaluate the
impact of supplementation, bench press 1-RM was deter-mined along with bench press throw power, respectively. In addition to these accepted laboratory methods of upper body strength and power, functional performance was also assessed using three-dimensional analysis of a series of golf swings using participants’ 7-iron and driver. Finally and as a general means to assess the impact of supplemen-tation on potential changes in musculoskeletal health, self-assessments of pain, quality of life and other adverse outcomes were gleaned from all study participants.
Subjects
to using anabolic steroids, growth hormone, insulin-like growth factor (IGF)-1, or other hormone medication in-cluding oral contraceptives during the previous 12 months were also excluded, as were smokers and those with orthopedic limitations or injuries.
Procedures
Testing protocol
All study participants were first familiarized to all ex-perimental procedures prior to completing their first testing session. Prior to arriving for all testing sessions, study participants were instructed to refrain from physic-ally taxing exercise for 48 hours and to observe a 12 hour fast. Upon arrival for the initial testing session, physical activity and health history were determined using stan-dardized questionnaires. Subjects then had their resting heart rate and blood pressure determined using an auto-mated sphygmomanometer, standing height determined using a wall-mounted stadiometer, and body mass de-termined using a calibrated scale (Seca Medical Scale, Hanover, MD). On separate days thereafter, study par-ticipants completed a 1-RM test on the bench press, an upper-body power test (bench press throws) and an as-sessment of their golf swing performance.
Supplementation protocol
In a double-blind, placebo-controlled fashion, study par-ticipants were instructed to ingest either a powdered dietary supplement containing creatine, coffea arabica fruit extract (CoffeeBerry®), calcium fructoborate (Frui-teX-B®) and vitamin D (Strong Drive™, SD, n = 14) or an isocaloric placebo (PLA, n = 13). A representative Sup-plement Facts label of the investigational product is shown in Figure 1. Irrespective of group assignment, all study participants were instructed to take each serving of their assigned supplement with eight ounces of cold water. For the first two weeks of the study, one serving was consumed twice per day (with breakfast and lunch). During the final two weeks of the study, study participants consumed only one serving per day of their assigned sup-plement (with breakfast). This protocol was employed to match manufacturer guidelines; the protocol also corre-sponded with previous creatine supplementation literature showing effective increases in intramuscular creatine and phosphocreatine levels [3,6]. To ensure complete blinding, all study supplements were in powder form of similar color, texture and flavor while also being packaged in coded generic containers. Compliance to the supplemen-tation protocol was monitored by having study partici-pants complete a supplementation log. In addition, study participants were required to return their empty supple-ment containers and were reminded of details associated with the study protocols with weekly text messages and/or
emails. Participants were instructed to refrain from using other supplemental courses of caffeine or creatine.
Blood collection and analysis
Whole blood and serum samples were collected using standard phlebotomy techniques on day 0 and day 30 of the study protocol. Whole blood samples were collected into K2-EDTA treated vacutainer tubes and upon collec-tion were slowly inverted ten consecutive times prior to immediate refrigeration. Serum samples were collected in non-treated tubes and allowed to clot for 30 minutes at room temperature prior to being centrifuged (Horizon mini E Centrifuge, Drucker Diagnostics, Port Matilda, PA) for 15 minutes at 3200 rpm. Serum was extracted from all samples and aliquots were pipetted into cryovial storage tubes. All blood samples were analyzed for clinical chemistry analysis (plasma glucose, blood urea nitrogen [BUN], creatinine, aspartate aminotransaminase [AST], alanine aminotransaminase [ALT], creatine kinase, lactate dehydrogenase, total bilirubin, alkaline phosphatase [ALP], triacylglycerol [TG], total cholesterol [TC], LDL, HDL, uric acid, sodium, potassium, total protein, albumin, globulin, iron, complete blood cells, and platelet count) using automated clinical chemistry analyzers (LabCorp, Dublin, OH branch). All samples from the same day were batch analyzed with test-retest reliabilities commonly reported using internal quality control data from clinical laboratories and associated automated analyzers within a range of 3–5% [26].
Muscular strength and power determination
On day 0 and day 30, maximal upper body muscle strength was estimated by 1-RM bench press testing using protocols adapted from the National Strength and Conditioning Association [27]. Only upper-body strength was assessed in this study due to previous experience in our lab and others indicating greater reliability of upper-body vs. lower-upper-body testing [28]. It is recognized that the bench press exercise acts primarily in the sagittal plane whereby the golf swing occurs through multiple planes at a wide range of accelerations and decelerations. In this respect, Marta and colleagues published a review of EMG studies involving the golf swing and they re-ported that the pectoralis muscle group experienced a great deal of activity during the golf swing movement [29]. Thus, our analytical approach in this styd was to combine a standardized, well-accepted measure of upper-body strength and power (1RM bench press and bench throws) along with a three-dimensional analysis of golf swing performance (described below) to assess the potential impact of nutritional supplementation. After a general warm-up of three to five minutes of light activity consisting of upper body ergometry and static stretching of the involved musculature, the subject performed a warm-up set of ten repetitions with only the bar, followed by eight repetitions at approximately 50% of their estimated 1-RM, followed by one set of three repeti-tions at 70% of their perceived 1-RM. Thereafter, study participants performed single repetition lifts at progres-sively increasing loads until 1-RM was determined. No more than five maximal attempts were completed in one testing session.
Upper body power production (average power [AP], average velocity [AV], peak power [PP], peak velocity [PV]) was assessed using the bench press exercise using a Tendo unit interfaced to a standard Smith machine rack. Previous studies have successfully incorporated the use of a Tendo into their study design [30] and Stock and colleagues [31] recently published data to indicate it is a reliable means of assessment. The unit consists of a position transducer that measures the rate of linear dis-placement providing velocity and acceleration in addition to power production. After 1RM determination, subjects rested for five minutes and completed three sets of three explosive repetitions (i.e. bench throws) with a load equal to 40% of their actual 1-RM on the bench press. Interset rest periods were strictly standardized at 90 seconds each. The reliability of our procedures using these procedures is similar to that previously reported [28,31].
Golf swing performance
On day 1 and day 30, golf swing performance was mea-sured using a three-dimensional (3-D) swing analysis system (TRACKMAN PRO, Brighton, MI) by a NCAA
Division I golf coach. Study participants completed a series of 10 successive swings using their 7-iron and driver. Although a wide variety of data is captured with this system (e.g. club delivery, ball launch, flight data) for the purpose of this study we chose to focus on peak and average club head speed, ball speed, as well as average and best distance for each club. Reliability was determined by having five representative participants complete five swings using both the 7-iron and driver clubs. Intraclass correlation coefficient and standard error of measurement using the 7-iron were calculated for ball speed (ICC3,1: 0.934, SEM: 10.99 miles/hour), club speed (ICC3,1: 0.991, SEM: 2.42 miles/hour) and total distance (ICC3,1: 0.862, SEM: 41.74 yards). Identical measurements were made using the driver for ball speed (ICC3,1: 0.975, SEM: 3.26 miles/hour) , club speed (ICC3,1: 0.990, SEM: 2.28 miles/ hour) and total distance (ICC3,1: 0.967, SEM: 8.46 yards). All calculations and assumptions were made according to Weir 2005 [32].
Qualitative assessments
Study participants were asked to maintain their normal patterns of exercise and habitual physical activity. Assess-ment of physical activity was completed on day 0, day 1 and day 30 using the Yale Physical Activity Survey prior to the study protocol and again on the last day of testing [33]. The Brief Pain Inventory and Quality of Life (SF-12, version 2) were also administered on day 1 and day 30.
Dietary intake
No dietary restrictions or prescriptions were made as part of this study protocol. Subjects recorded their dietary in-take over a three day period (two week days, one weekend day) according to instructions given by a research dietitian on day 0 and day 30. Each subject’s baseline diet was ana-lyzed by NutriBase IX software (CyberSoft, Inc., Phoenix, AZ) to determine average energy and macronutrient con-tent as well as distribution. Additional three-day dietary records were collected and analyzed in an identical fash-ion at the end of the supplementatfash-ion protocol (day 30). Twenty-four hours prior to post-testing on day 30, study participants duplicated their dietary intake using diet re-cords from day 0.
Statistical analyses
Normality was determined on all data using the Shapiro-Wilk statistics and visual inspection of standardized skew-ness and kurtosis scores. When the sphericity assumption was not met, the Huynh-Feldt correction was applied. Any non-normally distributed data were log-transformed prior to analysis. A p-value of less than or equal to 0.05 was used for determination of statistical significance. Trends were identified as p-values between 0.051 and 0.10. All statistical analyses were completed using SPSS software, version 21 (Cary, NC).
Results
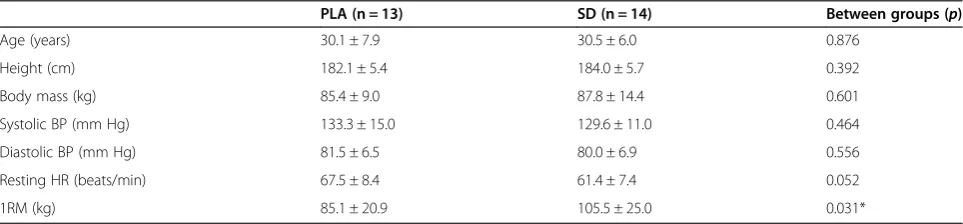
Of the 45 people screened for this study, 30 met inclu-sion criteria and were randomized to the study protocol. Reasons for excluding participants included not achiev-ing an adequate golf handicap score, takachiev-ing medications for blood pressure and not wanting to cease current sup-plement use. Of the 30 people randomized into the protocol, three participants were dropped because one did not arrive for post-testing while two others failed to show for their final golf swing performance test. Thus, 27 people completed the study. Descriptive characteris-tics and baseline demographics are found in Table 1. No significant differences (p > 0.05) were found at baseline between groups for age, height, body mass, systolic blood pressure, or diastolic blood pressure. Resting heart rate values at baseline tended to be greater in the PLA group (PLA: 67.5 ± 8.4 vs. SD: 61.4 ± 7.4 beats/ min, p = 0.052). In response to the intervention, no significant group × time interaction (p > 0.05) effects were revealed for body mass, systolic blood pressure, diastolic blood pressure or resting heart rate.
Data from maximal strength and power assessments are found in Table 2. Significant baseline differences (p < 0.05) were found for maximal strength and peak power production during all sets of the bench throws. As a result, ANCOVA was used to determine statistical differences for these variables during post-testing. Both the PLA and SD groups experienced similar significant increases in body mass (data not shown) and 1RM bench press across time (p < 0.001 in both groups) with
but no between-group differences were present via ANCOVA (p = 0.86). Using ANCOVA, no between group differences (p > 0.05) were found for peak power produc-tion during all sets that were completed (Table 2). Using 2x2 mixed factorial ANOVA, no significant group × time interaction were found for peak velocity during set 2 and set 3 while the peak velocity tended (p = 0.07) to change for set 1 peak velocity (Table 2). Additionally, the SD group experienced a significant within-group increase (delta: 0.079 ± 0.089 miles/hour, p = 0.005; ES = 0.62) in peak velocity during the 1stset of bench throws. In con-trast, within-group changes in the PLA group for peak velocity during set 1 of bench throws were not significant (delta: 0.015 ± 0.086, p = 0.55; ES = 0.11).
Golf performance data are shown in Table 3. Using 2×2 mixed factorial ANOVA, no significant (p > 0.05) group × time interaction effect was found for best 7-iron club speed, best 7-iron ball speed and best 7-iron distance. There was a significant difference at baseline (p < 0.05) in best driver distance, best driver club speed, and best driver ball speed, thus ANCOVA was used to compare post-test values for these variables. No between-group differences were noted for best driver club speed and best driver ball speed, but a significant difference was found for best driver distance (Table 3 and Figure 2) and there was a tendency for average driver distance to be different (PLA: 2.7 ± 25.2 vs. SD: 13.6 ± 24.5 yards, p = 0.07). In the SD group, a trend (delta: 13.6 ± 29.0 yards, p = 0.10, ES = 0.75) was identified for best drive distance. No within-group changes were seen in the PLA group for any of the golf performance parameters with the excep-tion of a tendency for an increase in best 7-iron distance (+6.9 ± 13.2 yards, p = 0.08, ES = 0.31).
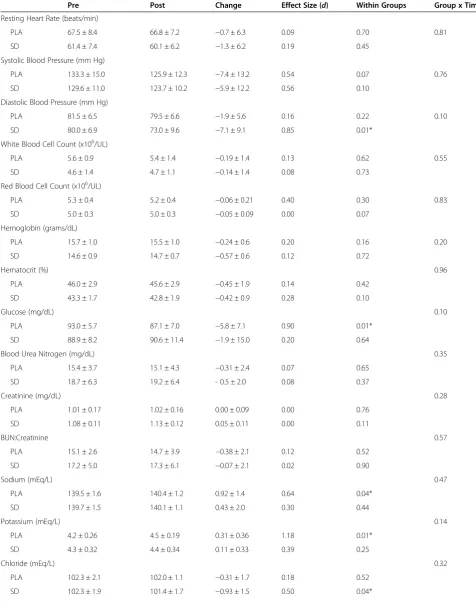
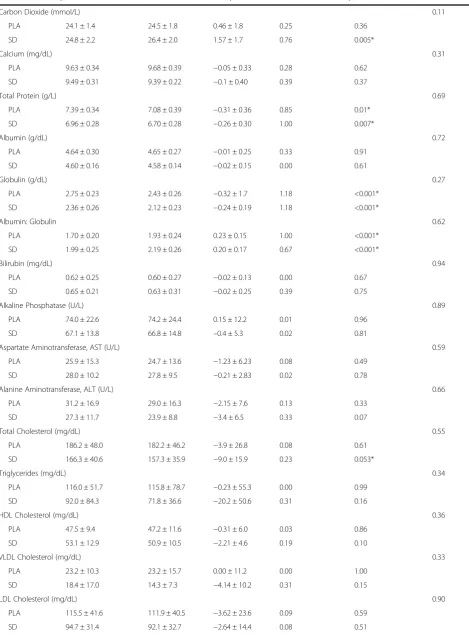
No significant group × time interaction effects were revealed for the following blood variables (Table 4): red blood cell count, hemoglobin, hematocrit, glucose, blood urea nitrogen (BUN), creatinine, BUN: creatinine, so-dium, potassium, chloride, carbon dioxide, calcium, total protein, albumin, globulin, albumin: globulin, bilirubin, alkaline phosphatase, alanine aminotransferase, aspartate aminotransferase, total cholesterol, triglycerides, HDL
Table 1 Baseline anthropometric and hemodynamic characteristics of study participants
PLA (n = 13) SD (n = 14) Between groups (p)
Age (years) 30.1 ± 7.9 30.5 ± 6.0 0.876
Height (cm) 182.1 ± 5.4 184.0 ± 5.7 0.392
Body mass (kg) 85.4 ± 9.0 87.8 ± 14.4 0.601
Systolic BP (mm Hg) 133.3 ± 15.0 129.6 ± 11.0 0.464
Diastolic BP (mm Hg) 81.5 ± 6.5 80.0 ± 6.9 0.556
Resting HR (beats/min) 67.5 ± 8.4 61.4 ± 7.4 0.052
1RM (kg) 85.1 ± 20.9 105.5 ± 25.0 0.031*
cholesterol, VLDL cholesterol, LDL cholesterol, vitamin D (25-hydroxy D) and C-reactive protein. Only a small number of blood variables experienced changes or seemed to exhibit within-group changes over time. In all situations, the magnitude of change was within clinically accepted normative ranges for these variables. Specific-ally, in the SD group significant changes (p < 0.05) were noted in diastolic blood pressure, carbon dioxide, and total cholesterol while in the PLA group significant changes were noted in sodium, potassium, and glucose. Both groups experienced significant changes in total protein, globulin, and albumin: globulin ratio. No signifi-cant group × time interaction effects were reported for any of the pain indices, physical activity or enjoyment scales (Table 5, p > 0.05).
Discussion
Golf is a unique sport that requires a challenging com-bination of physical, mental and emotional attributes. Nutritional formulations developed to enhance these attributes are lacking, but multiple ingredients are avail-able that have been examined scientifically which may improve golfing performance. The primary findings from
the present study were that, over a 4-week period of supplementation, a blend of ingredients found in SD (e.g. creatine monohydrate, coffea arabica fruit extract [CoffeeBerry®], calcium fructoborate [FruiteX-B®], and vitamin D) significantly increased best drive distance and tended to improve average driver distance (p = 0.07) more so than the placebo group. In addition, both groups experienced significant improvements in bench press strength while the SD also experienced significant improve-ments in peak power and peak velocity production after the first set of bench press throws while no such changes were observed in the placebo group. Supplementation was well tolerated and no safety concerns/side effects were noted.
Although this study was not designed to determine the mechanisms underpinning any observed changes with SD supplementation, one or more of the ingredients in the formula were likely responsible for the observed changes. For example, a number of previous investiga-tions using creatine monohydrate at the dosage provided in this study (10 grams/day × first two weeks, 5 grams/ day × last two weeks) have routinely reported improve-ments in strength, upper-body performance, power and overall exercise capacity [3,7]. Thus, even though we did
Table 2 Upper-body maximal strength and power characteristics
Intervention Comparison of change (p)
Pre Post Change Effect size (d) Within groups Group × Time
Bench press 1RM (kg)
PLA 85 ± 21 89 ± 22 3.8 ± 3.0 0.18 <0.01* 0.86§
SD 106 ± 25† 109 ± 25 3.7 ± 2.9 0.15 <0.01*
Bench Press Throws Peak Power Set 1 (watts)‡
PLA 396 ± 91 410 ± 105 14.5 ± 43.8 0.16 0.26 0.35§
SD 487 ± 124 517 ± 124 28.6 ± 26.7 0.23 <0.01*
Bench Press Throws Peak Velocity Set 1 (m/s)‡
PLA 1.20 ± 0.13 1.22 ± 0.12 0.015 ± 0.086 0.11 0.55 0.07
SD 1.17 ± 0.13 1.25 ± 0.11 0.079 ± 0.089 0.62 0.02*
Bench Press Throws Peak Power Set 2 (watts)‡
PLA 401 ± 86 422 ± 108 21.4 ± 44.7 0.25 0.11 0.36§
SD 504 ± 124 513 ± 129 8.7 ± 38.8 0.07 0.42
Bench Press Throws Peak Velocity Set 2 (m/s)‡
PLA 1.21 ± 0.10 1.24 ± 0.16 0.025 ± 0.132 0.26 0.52 0.86
SD 1.22 ± 0.15 1.24 ± 0.10 0.016 ± 0.096 0.11 0.53
Bench Press Throws Peak Power Set 3 (watts)‡
PLA 400 ± 95 416 ± 97 15.5 ± 36.8 0.16 0.15 0.75§
SD 515 ± 118 523 ± 126 8.5 ± 40.3 0.07 0.44
Bench Press Throws Peak Velocity Set 3 (m/s)‡
PLA 1.21 ± 0.10 1.24 ± 0.12 0.032 ± .109 0.31 0.31 0.61
SD 1.25 ± 0.14 1.27 ± 0.09 0.012 ± 0.093 0.08 0.63
not collect muscle phosphagen data it is likely that the observed non-significant improvements in upper-body power and velocity primarily stemmed from the creatine monohydrate contained in SD. Future studies should utilize three groups to confirm this hypothesis (i.e. pla-cebo vs. SD formula vs. creatine control).
Another potential candidate for performance enhance-ment in the SD formula is caffeine. As a dietary supple-ment, caffeine has successfully been used for years at doses of 3–6 mg/kg of body mass to improve both cognitive and physical aspects of exercise performance [10,11]. In the present study, no assessments of focus or concentration
Table 3 Golf performance using repeated measures ANOVA
Intervention Comparison of change (p)
Pre Post Change Effect size (d) Within groups Group × Time
Best 7 Iron Club Speed (miles/hour)
PLA 86.7 ± 8.9 88.0 ± 4.6 1.39 ± 4.9 0.15 0.32 0.50
SD 92.1 ± 4.8 92.5 ± 5.2 0.44 ± 1.7 0.09 0.34
Best 7 Iron Ball Speed (miles/hour)
PLA 113.8 ± 12.9 115.4 ± 8.8 1.51 ± 7.5 0.11 0.79 0.44
SD 120.8 ± 6.3 120.5 ± 6.9 −0.25 ± 3.9 0.04 0.80
Best Distance 7 Iron (yards)
PLA 162 ± 24 169 ± 21 6.9 ± 13 0.31 0.08 0.93
SD 174 ± 15 181 ± 13 7.4 ± 18 0.53 0.14
Best Driver Club Speed (miles/hour)
PLA 104.5 ± 9.3 104.9 ± 6.5 0.45 ± 4.6 0.05 0.73 0.46§
SD 110.4 ± 5.1 110.1 ± 5.7 −0.31 ± 3.6 0.06 0.76
Best Driver Ball Speed (miles/hour)
PLA 147.5 ± 13.8 148.6 ± 9.5 1.1 ± 7.5 0.09 0.61 0.17§
SD 158.9 ± 6.6 159.1 ± 7.9 0.19 ± 7.6 0.03 0.93
Best Driver Distance (yards)
PLA 260.0 ± 30.4 258.8 ± 29.6 −1.2 ± 18.6 0.04 0.82 0.04§
SD 269.9 ± 18.5 283.5 ± 23.1 13.6 ± 29.0 0.75 0.10
Values are mean ± SD.§
= Group differences assessed using ANCOVA with respective baseline scores as the covariate due to significant difference between groups at baseline.
230 240 250 260 270 280 290 300 310 320
t s o P e
r P
B
e
s
t Dr
iv
er
D
ist
anc
e
(y
ard
s)
§
Table 4 Hemodynamic, whole blood and clinical chemistry markers of health and safety
Intervention Comparison of change (p)
Pre Post Change Effect Size (d) Within Groups Group x Time
Resting Heart Rate (beats/min)
PLA 67.5 ± 8.4 66.8 ± 7.2 −0.7 ± 6.3 0.09 0.70 0.81
SD 61.4 ± 7.4 60.1 ± 6.2 −1.3 ± 6.2 0.19 0.45
Systolic Blood Pressure (mm Hg)
PLA 133.3 ± 15.0 125.9 ± 12.3 −7.4 ± 13.2 0.54 0.07 0.76
SD 129.6 ± 11.0 123.7 ± 10.2 −5.9 ± 12.2 0.56 0.10
Diastolic Blood Pressure (mm Hg)
PLA 81.5 ± 6.5 79.5 ± 6.6 −1.9 ± 5.6 0.16 0.22 0.10
SD 80.0 ± 6.9 73.0 ± 9.6 −7.1 ± 9.1 0.85 0.01*
White Blood Cell Count (x106/UL)
PLA 5.6 ± 0.9 5.4 ± 1.4 −0.19 ± 1.4 0.13 0.62 0.55
SD 4.6 ± 1.4 4.7 ± 1.1 −0.14 ± 1.4 0.08 0.73
Red Blood Cell Count (x106/UL)
PLA 5.3 ± 0.4 5.2 ± 0.4 −0.06 ± 0.21 0.40 0.30 0.83
SD 5.0 ± 0.3 5.0 ± 0.3 −0.05 ± 0.09 0.00 0.07
Hemoglobin (grams/dL)
PLA 15.7 ± 1.0 15.5 ± 1.0 −0.24 ± 0.6 0.20 0.16 0.20
SD 14.6 ± 0.9 14.7 ± 0.7 −0.57 ± 0.6 0.12 0.72
Hematocrit (%) 0.96
PLA 46.0 ± 2.9 45.6 ± 2.9 −0.45 ± 1.9 0.14 0.42
SD 43.3 ± 1.7 42.8 ± 1.9 −0.42 ± 0.9 0.28 0.10
Glucose (mg/dL) 0.10
PLA 93.0 ± 5.7 87.1 ± 7.0 −5.8 ± 7.1 0.90 0.01*
SD 88.9 ± 8.2 90.6 ± 11.4 −1.9 ± 15.0 0.20 0.64
Blood Urea Nitrogen (mg/dL) 0.35
PLA 15.4 ± 3.7 15.1 ± 4.3 −0.31 ± 2.4 0.07 0.65
SD 18.7 ± 6.3 19.2 ± 6.4 - 0.5 ± 2.0 0.08 0.37
Creatinine (mg/dL) 0.28
PLA 1.01 ± 0.17 1.02 ± 0.16 0.00 ± 0.09 0.00 0.76
SD 1.08 ± 0.11 1.13 ± 0.12 0.05 ± 0.11 0.00 0.11
BUN:Creatinine 0.57
PLA 15.1 ± 2.6 14.7 ± 3.9 −0.38 ± 2.1 0.12 0.52
SD 17.2 ± 5.0 17.3 ± 6.1 −0.07 ± 2.1 0.02 0.90
Sodium (mEq/L) 0.47
PLA 139.5 ± 1.6 140.4 ± 1.2 0.92 ± 1.4 0.64 0.04*
SD 139.7 ± 1.5 140.1 ± 1.1 0.43 ± 2.0 0.30 0.44
Potassium (mEq/L) 0.14
PLA 4.2 ± 0.26 4.5 ± 0.19 0.31 ± 0.36 1.18 0.01*
SD 4.3 ± 0.32 4.4 ± 0.34 0.11 ± 0.33 0.39 0.25
Chloride (mEq/L) 0.32
PLA 102.3 ± 2.1 102.0 ± 1.1 −0.31 ± 1.7 0.18 0.52
Table 4 Hemodynamic, whole blood and clinical chemistry markers of health and safety(Continued)
Carbon Dioxide (mmol/L) 0.11
PLA 24.1 ± 1.4 24.5 ± 1.8 0.46 ± 1.8 0.25 0.36
SD 24.8 ± 2.2 26.4 ± 2.0 1.57 ± 1.7 0.76 0.005*
Calcium (mg/dL) 0.31
PLA 9.63 ± 0.34 9.68 ± 0.39 −0.05 ± 0.33 0.28 0.62
SD 9.49 ± 0.31 9.39 ± 0.22 −0.1 ± 0.40 0.39 0.37
Total Protein (g/L) 0.69
PLA 7.39 ± 0.34 7.08 ± 0.39 −0.31 ± 0.36 0.85 0.01*
SD 6.96 ± 0.28 6.70 ± 0.28 −0.26 ± 0.30 1.00 0.007*
Albumin (g/dL) 0.72
PLA 4.64 ± 0.30 4.65 ± 0.27 −0.01 ± 0.25 0.33 0.91
SD 4.60 ± 0.16 4.58 ± 0.14 −0.02 ± 0.15 0.00 0.61
Globulin (g/dL) 0.27
PLA 2.75 ± 0.23 2.43 ± 0.26 −0.32 ± 1.7 1.18 <0.001*
SD 2.36 ± 0.26 2.12 ± 0.23 −0.24 ± 0.19 1.18 <0.001*
Albumin: Globulin 0.62
PLA 1.70 ± 0.20 1.93 ± 0.24 0.23 ± 0.15 1.00 <0.001*
SD 1.99 ± 0.25 2.19 ± 0.26 0.20 ± 0.17 0.67 <0.001*
Bilirubin (mg/dL) 0.94
PLA 0.62 ± 0.25 0.60 ± 0.27 −0.02 ± 0.13 0.00 0.67
SD 0.65 ± 0.21 0.63 ± 0.31 −0.02 ± 0.25 0.39 0.75
Alkaline Phosphatase (U/L) 0.89
PLA 74.0 ± 22.6 74.2 ± 24.4 0.15 ± 12.2 0.01 0.96
SD 67.1 ± 13.8 66.8 ± 14.8 –0.4 ± 5.3 0.02 0.81
Aspartate Aminotransferase, AST (U/L) 0.59
PLA 25.9 ± 15.3 24.7 ± 13.6 −1.23 ± 6.23 0.08 0.49
SD 28.0 ± 10.2 27.8 ± 9.5 −0.21 ± 2.83 0.02 0.78
Alanine Aminotransferase, ALT (U/L) 0.66
PLA 31.2 ± 16.9 29.0 ± 16.3 −2.15 ± 7.6 0.13 0.33
SD 27.3 ± 11.7 23.9 ± 8.8 −3.4 ± 6.5 0.33 0.07
Total Cholesterol (mg/dL) 0.55
PLA 186.2 ± 48.0 182.2 ± 46.2 −3.9 ± 26.8 0.08 0.61
SD 166.3 ± 40.6 157.3 ± 35.9 −9.0 ± 15.9 0.23 0.053*
Triglycerides (mg/dL) 0.34
PLA 116.0 ± 51.7 115.8 ± 78.7 −0.23 ± 55.3 0.00 0.99
SD 92.0 ± 84.3 71.8 ± 36.6 −20.2 ± 50.6 0.31 0.16
HDL Cholesterol (mg/dL) 0.36
PLA 47.5 ± 9.4 47.2 ± 11.6 −0.31 ± 6.0 0.03 0.86
SD 53.1 ± 12.9 50.9 ± 10.5 −2.21 ± 4.6 0.19 0.10
VLDL Cholesterol (mg/dL) 0.33
PLA 23.2 ± 10.3 23.2 ± 15.7 0.00 ± 11.2 0.00 1.00
SD 18.4 ± 17.0 14.3 ± 7.3 −4.14 ± 10.2 0.31 0.15
LDL Cholesterol (mg/dL) 0.90
PLA 115.5 ± 41.6 111.9 ± 40.5 −3.62 ± 23.6 0.09 0.59
were made to evaluate changes as a result of supplementa-tion because of the relatively low dose of caffeine in the test product (i.e. 50 mg or ~ 0.6 mg/kg body mass for these subjects). In addition, the last dose of SD (or placebo) was taken 24-hours prior to day 30 testing. Thus, we consider it unlikely that the caffeine contained in thecoffea arabica fruit extract (CoffeeBerry®) of SD played a major role in the results. It is worth mentioning we cannot completely dis-count the potential effects that other unique ingredients in CoffeeBerry® (e.g., various chlorogenic acids and plant phenolics), may have had on these results.
Finally, data surrounding boron and vitamin D con-tinue to lend support towards these nutrients and their ability to mitigate pain [20] as well as improve bone [21] and muscle health [23]. Findings from the present study did not reveal improved outcomes associated with self-reported pain, fatigue or weakness levels as assessed be-fore and after the four week supplementation period. We speculate that the primary reason for these findings was associated with the existing joint and bone health of our study participants. For example, our study partici-pants were otherwise healthy, middle-aged men who golfed on a regular basis and as a result were maintain-ing a basic level of physical activity. When compared to the study participants in other published trials showing improvements in self-reported pain [19-21,24], partici-pants from the present study were younger, healthier and had minimal baseline levels of pain. The lack of change found in serum levels of 25-hydroxy vitamin D as a result of supplementation was not entirely unexpected. Given the moderate dose (1,000 IU/day), the time of year the study was conducted (late Fall), and general latitude of the study location (Kent, OH = 41.15°N), it is our contention that the majority of supplemented vitamin D was quickly absorbed by peripheral tissues.
From an adverse event and/or clinical safety perspective, the SD supplement was well tolerated with no significant group × time interactive changes in any of the measured clinical markers (Tables 4 and 5). A few variables did experience significant within-group changes (e.g., diastolic blood pressure, glucose, sodium, potassium, carbon diox-ide, albumin: globulin ratio, total protein and globulin, etc.), but in all such circumstances, both groups changes remained within clinical accepted normative values.
The strengths of the present study are that it was a double-blind, placebo-controlled investigation using a “free-living” approach. Thus, the findings are applicable to many consumers who golf but do not follow a rigid diet or exercise program. To date, extremely limited re-search is available exploring the potential impact of vari-ous nutritional agents on golf performance, with one of the only published accounts reporting an improvement in stress hormone levels and shot-making after phospha-tidylserine supplementation [2]. The disadvantages of the present study primarily revolve around the pilot na-ture of the investigation and the lack of female subjects. The authors recognize that the relatively small number of subjects and short supplementation period (4 weeks) likely hindered the ability to uncover significant effects in some outcome measures, particularly since the partic-ipants were relatively young and healthy and were not required to follow a particular exercise training program or dietary regimen. It is also important to discuss other considerations related to our data and findings. For example, the positive outcome surrounding best drive distance is likely impacted by a number of other factors that we weren’t able to be measured in our study design including, but not limited to: club head acceleration at the point of impact with the ball, club head deceleration through the zone of impact, rotational power, improved accuracy of club head placement relative the ball, club face angle at ball strike, and musculoskeletal range of motion. Two additional factors are upper-body strength and power that were measured in the present study by determining bench press 1RM and sagittal plane power development during bench press throws. The authors recognize that performance of the bench press exercise may be viewed by some as having very little carryover to golf swing performance, but these parameters were chosen due to their high reliability of measurement and as being valid and commonly used measures of maximal strength and power in the sports science literature. Additionally, it is important to highlight that Marta and colleagues indicate that the pectoralis major, deltoid, and latissimus dosi are the most active muscle groups during the golf swing movement, particularly during the acceleration phase [29]. A three-dimensional analysis of golf swing performance using two common clubs was
Table 4 Hemodynamic, whole blood and clinical chemistry markers of health and safety(Continued)
Vitamin D (as 25(OH)D, ng/mL) 0.46
PLA 21.5 ± 5.2 23.3 ± 5.0 1.78 ± 3.94 0.35 0.13
SD 35.1 ± 29.0 40.9 ± 45.4 3.95 ± 19.0 0.15 0.27
C-Reactive Protein (mg/L) 0.64
PLA 1.41 ± 0.90 1.19 ± 0.65 −0.22 ± 0.6 0.25 0.19
SD 1.46 ± 1.57 1.03 ± 1.11 −0.43 ± 1.5 0.36 0.29
Table 5 Pain and quality of life data
Intervention Comparison of change (p)
Pre Post Change Effect size (d) Within groups Group × Time
Worst Pain
PLA 1.62 ± 2.60 1.38 ± 2.14 −0.23 ± 1.09 0.08 0.46 0.52
SD 0.79 ± 1.31 0.93 ± 1.33 0.14 ± 1.79 0.08 0.77
Least Pain
PLA 0.31 ± 0.63 0.31 ± 0.85 0.00 ± 0.58 0.00 1.00 0.50
SD 0.36 ± 0.74 0.14 ± 0.53 −0.21 ± 0.97 0.49 0.43
Average Pain
PLA 1.38 ± 1,89 1.15 ± 1.52 −0.23 ± 0.83 0.12 0.34 0.97
SD 0.79 ± 1.12 0.57 ± 1.09 −0.21 ± 1.53 0.18 0.61
Pain Level Now
PLA 0.69 ± 1.44 0.69 ± 1.32 0.00 ± 1.68 0.00 1.00 0.48
SD 0.43 ± 0.94 0.07 ± 0.27 −0.36 ± 0.74 0.45 0.10
Relief
PLA 13.8 ± 34.0 6.2 ± 22.2 −7.7 ± 27.7 0.26 0.34 0.53
SD 16.4 ± 33.9 18.6 ± 37.0 −2.1 ± 49.0 0.06 0.87
Current Activity 0.88
PLA 0.54 ± 1.13 0.31 ± 0.85 −0.23 ± 1.4 0.20 0.55
SD 0.50 ± 1.34 0.36 ± 0.74 −0.14 ± 1.7 0.10 0.75
Current Mood 0.45
PLA 0.31 ± 0.75 0.15 ± 0.38 −0.15 ± 0.69 0.16 0.44
SD 0.14 ± 0.53 0.21 ± 0.60 −0.07 ± 0.83 0.18 0.75
Walking 0.08
PLA 0.38 ± 1.12 0.85 ± 1.81 −0.46 ± 0.97 0.27 0.11
SD 0.21 ± 0.43 0.14 ± 0.53 −0.07 ± 0.47 0.22 0.58
Normal Work 0.67
PLA 0.31 ± 0.63 0.23 ± 0.60 −0.07 ± 0.76 0.17 0.72
SD 0.43 ± 0.94 0.21 ± 0.58 −0.21 ± 0.89 0.26 0.39
Sleep Quality 0.48
PLA 0.46 ± 1.1 0.45 ± 1.1 0.00 ± 1.0 0.00 1.00
SD 0.43 ± 1.1 0.14 ± 0.4 −0.29 ± 1.1 0.36 0.34
Yale P1 0.26
PLA 5471 ± 4118 5954 ± 4705 - 483 ± 2436 0.11 0.49
SD 6376 ± 6967 5175 ± 2238 −1200 ± 4755 0.22 0.36
Yale P2 0.77
PLA 85.5 ± 34.3 64.3 ± 26.1 −21.2 ± 45.6 0.70 0.12
SD 114.9 ± 57.6 86.5 ± 52.5 −28.4 ± 76.8 0.52 0.19
PCS 0.35
PLA 52.6 ± 7.1 56.0 ± 2.8 3.4 ± 5.7 0.63 0.05
SD 53.9 ± 4.3 55.5 ± 2.7 1.6 ± 4.0 0.45 0.17
MCS 0.59
PLA 55.5 ± 4.2 53.6 ± 6.5 −1.87 ± 6.58 0.35 0.33
SD 56.1 ± 5.1 55.3 ± 3.5 −0.82 ± 2.85 0.18 0.30
employed as a measurement method of golfing perform-ance. While much more practical, this measurement method only reports on final performance and thus does not allow for a clearer understanding of what aspects of performance SD may have improved according to our findings, particularly as they relate to best drive distance. In this respect, it is important for the reader to understand other factors may have impacted our observed outcomes related to best driver distance.
Conclusions
This preliminary investigation yielded significantly greater improvements in best drive distance (~13.6 yards) and a tendency for average driver distance to improve in healthy male golfers consuming SD for four weeks. Careful inter-pretation of these data is encouraged due to their prelim-inary nature and need to be followed-up with a larger and longer investigation.
Competing interests
The authors declare that they have no competing or financial interests concerning the outcome of this investigation. The sponsor of this study, Purity Products (Plainview, NY) provided an independent research grant and donated the study product (SD) and placebo, but had no role in the collection, analyses, or interpretation of the data.
Authors’contributions
AWK provided medical oversight, subject screening, subject recruitment and assisted with data collection and manuscript preparation. TNZ and HLL designed the study, secured funding for project, assisted with data analysis and manuscript preparation. JES and SMH carried out subject recruitment, data collection, coordination of the study and compliance. RLA coordinated and assisted with all golf simulations and performance assessments. CMK assisted with data analysis and prepared the manuscript. All authors read and approved the final manuscript.
Acknowledgements
The authors would like to thank the subjects who participated in the study and the sponsor (Purity Products). The presentation of results of this study does not constitute endorsement by the any of the investigators, the universities they represent, The Center for Applied Health Sciences, or the journal in which it is published.
Author details
1The Center for Applied Health Sciences, 4302 Allen Road, Ste 120, Stow, OH 44224, USA.2Strength and Conditioning, Athletics Department, Kent State University, Kent, OH 44240, USA.3School of Sport, Recreation and Exercise Sciences, Lindenwood University, St. Charles, MO 63301, USA.
Received: 25 July 2014 Accepted: 18 December 2014
References
1. Smith MF. The role of physiology in the development of golf performance. Sports Med. 2010;40(8):635–55.
2. Jager R, Purpura M, Geiss KR, Weiss M, Baumeister J, Amatulli F, Schroder L, Herwegen H. The effect of phosphatidylserine on golf performance. J Int Soc Sports Nutr. 2007;4(1):23.
3. Buford TW, Kreider RB, Stout JR, Greenwood M, Campbell B, Spano M, Ziegenfuss T, Lopez H, Landis J, Antonio J. International Society of Sports Nutrition position stand: creatine supplementation and exercise. J Int Soc Sports Nutr. 2007;4:6.
4. Greenhaff PL. Muscle creatine loading in humans: Procedures and functional and metabolic effects. In: 6th International Conference on Guanidino Compounds in Biology and Medicine: 2001. Cincinnati, OH; 2001.
5. Greenhaff PL, Bodin K, Soderlund K, Hultman E. Effect of oral creatine supplementation on skeletal muscle phosphocreatine resynthesis. Am J Physiol. 1994;266(5 Pt 1):E725–30.
6. Hultman E, Soderlund K, Timmons JA, Cederblad G, Greenhaff PL. Muscle creatine loading in men. J Appl Physiol. 1996;81(1):232–7.
7. Kreider RB. Effects of creatine supplementation on performance and training adaptations. Mol Cell Biochem. 2003;244(1–2):89–94. 8. Kreider RB, Ferreira M, Wilson M, Grindstaff P, Plisk S, Reinardy J,
Cantler E, Almada AL. Effects of creatine supplementation on body composition, strength, and sprint performance. Med Sci Sports Exerc. 1998;30(1):73–82.
9. Astorino TA, Roberson DW. Efficacy of acute caffeine ingestion for short-term high-intensity exercise performance: a systematic review. J Strength Cond Res. 2010;24(1):257–65.
10. Glade MJ. Caffeine-Not just a stimulant. Nutrition. 2010;26(10):932–8. 11. Goldstein ER, Ziegenfuss T, Kalman D, Kreider R, Campbell B, Wilborn C,
et al. International society of sports nutrition position stand: caffeine and performance. J Int Soc Sports Nutr. 2010;7(1):5.
12. Davis JK, Green JM. Caffeine and anaerobic performance: ergogenic value and mechanisms of action. Sports Med. 2009;39(10):813–32.
13. Doherty M, Smith PM. Effects of caffeine ingestion on rating of perceived exertion during and after exercise: a meta-analysis. Scand J Med Sci Sports. 2005;15(2):69–78.
14. Einother SJ, Giesbrecht T. Caffeine as an attention enhancer: reviewing existing assumptions. Psychopharmacology. 2013;225(2):251–74.
15. Armstrong TA, Spears JW, Crenshaw TD, Nielsen FH. Boron supplementation of a semipurified diet for weanling pigs improves feed efficiency and bone strength characteristics and alters plasma lipid metabolites. J Nutr. 2000;130(10):2575–81.
16. Hooshmand S, Chai SC, Saadat RL, Payton ME, Brummel-Smith K, Arjmandi BH. Comparative effects of dried plum and dried apple on bone in postmenopausal women. Br J Nutr. 2011;106(6):923–30.
17. Scorei RI, Rotaru P. Calcium fructoborate–potential anti-inflammatory agent. Biol Trace Elem Res. 2011;143(3):1223–38.
18. Scorei R, Cimpoiasu VM, Iordachescu D. In vitro evaluation of the antioxidant activity of calcium fructoborate. Biol Trace Elem Res. 2005;107(2):127–34.
19. Miljukovic ND, Miljkovic DA, Ercegan GM. Osteoarthritis and Calcium Fructo Borate Supplementation: An Open-Label Pilot Study. Yugoslavia: University of Novi Sad; 2002.
20. Scorei R, Mitrut P, Petrisor I, Scorei I. A double-blind, placebo-controlled pilot study to evaluate the effect of calcium fructoborate on systemic inflammation and dyslipidemia markers for middle-aged people with primary osteoarthritis. Biol Trace Elem Res. 2011;144(1–3):253–63.
21. Price CT, Langford JR, Liporace FA. Essential Nutrients for Bone Health and a Review of their Availability in the Average North American Diet. Open Orthopaedics J. 2012;6:143–9.
22. Eglia L. Vitamin D and its role in skeletal muscle. Curr Opin Clin Nutr Metab Care. 2009;12(6):628–33.
23. Hamilton B. Vitamin D and human skeletal muscle. Scand J Med Sci Sports. 2010;20(2):182–90.
24. Sato Y, Iwamoto J, Kanoko T, Satoh K. Low-dose vitamin D prevents muscular atrophy and reduces falls and hip fractures in women after stroke: a randomized controlled trial. Cerebrovasc Dis. 2005;20(3):187–92.
25. Calvo MS, Whiting SJ, Barton CN. Vitamin D fortification in the United States and Canada: current status and data needs. Am J Clin Nutr.
2004;80(6 Suppl):1710S–6.
26. Cuka S, Dvornik S, Drazenovic K, Mihic J. Evaluation of the Dade Behring Dimension RxL clinical chemistry analyzer. Clin Lab. 2001;47(1–2):35–40. 27. Baechle TR, Earle RW. Essentials of Strength Training and Conditioning.
Champaign, IL: Human Kinetics; 2000.
28. Alemany JA, Pandorf CE, Montain SJ, Castellani JW, Tuckow AP, Nindl BC. Reliability assessment of ballistic jump squats and bench throws. J Strength Cond Res. 2005;19(1):33–8.
29. Marta S, Silva L, Castro MA, Pezarat-Correia P, Cabri J. Electromyography variables during the golf swing: a literature review. J Electromyogr Kinesiol. 2012;22(6):803–13.
31. Stock MS, Beck TW, DeFreitas JM, Dillon MA. Test-retest reliability of barbell velocity during the free-weight bench-press exercise. J Strength Cond Res. 2011;25(1):171–7.
32. Weir JP. Quantifying test-retest reliability using the intraclass correlation coefficient and the SEM. J Strength Cond Res. 2005;19(1):231–40. 33. Kruskall LJ, Campbell WW, Evans WJ. The Yale Physical Activity Survey for
older adults: predictions in the energy expenditure due to physical activity. J Am Diet Assoc. 2004;104(8):1251–7.
Submit your next manuscript to BioMed Central and take full advantage of:
• Convenient online submission
• Thorough peer review
• No space constraints or color figure charges
• Immediate publication on acceptance
• Inclusion in PubMed, CAS, Scopus and Google Scholar
• Research which is freely available for redistribution