R E S E A R C H A R T I C L E
Open Access
Adenosine mediates functional and
metabolic suppression of peripheral and
tumor-infiltrating CD8
+
T cells
Beatris Mastelic-Gavillet
1†, Blanca Navarro Rodrigo
1†, Laure Décombaz
2, Haiping Wang
1, Giuseppe Ercolano
3,
Rita Ahmed
1, Leyder Elena Lozano
2, Angela Ianaro
3, Laurent Derré
4, Massimo Valerio
4, Thomas Tawadros
4,
Patrice Jichlinski
4, Tu Nguyen-Ngoc
1, Daniel E. Speiser
2, Grégory Verdeil
2, Nicolas Gestermann
2, Olivier Dormond
5,
Lana Kandalaft
1, George Coukos
1, Camilla Jandus
1, Christine Ménétrier-Caux
6,7, Christophe Caux
6,7, Ping-Chih Ho
1,
Pedro Romero
2, Alexandre Harari
1and Selena Vigano
1*Abstract
Background:Several mechanisms are present in the tumor microenvironment (TME) to impair cytotoxic T cell responses potentially able to control tumor growth. Among these, the accumulation of adenosine (Ado)
contributes to tumor progression and represents a promising immunotherapeutic target. Ado has been shown to impair T cell effector function, but the role and mechanisms employed by Ado/Ado receptors (AdoRs) in
modulating human peripheral and tumor-infiltrating lymphocyte (TIL) function are still puzzling.
Methods:CD8+T cell cytokine production following stimulation was quantified by intracellular staining and flow cytometry. The cytotoxic capacity of tumor infiltrating lymphocytes (TILs) was quantified by the chromium release assay following co-culture with autologous or anti-CD3-loaded tumor cell lines. The CD8+T cell metabolic fitness was evaluated by the seahorse assay and by the quantification of 2-NBDG uptake and CD71/CD98 upregulation upon stimulation. The expression of AdoRs was assessed by RNA flow cytometry, a recently developed technology that we validated by semiquantitative RT-PCR (qRT-PCR), while the impact on T cell function was evaluated by the use of selective antagonists and agonists. The influence of Ado/AdoR on the PKA and mTOR pathways was evaluated by phosphoflow staining of p-CREB and p-S6, respectively, and validated by western blot.
Results:Here, we demonstrate that Ado signaling through the A2A receptor (A2AR) in human peripheral CD8+T cells and TILs is responsible for the higher sensitivity to Ado-mediated suppression of T central memory cells. We confirmed that Ado is able to impair peripheral and tumor-expanded T cell effector functions, and we show for the first time its impact on metabolic fitness. The Ado-mediated immunosuppressive effects are mediated by increased PKA activation that results in impairment of the mTORC1 pathway.
Conclusions:Our findings unveil A2AR/PKA/mTORC1 as the main Ado signaling pathway impairing the immune
competence of peripheral T cells and TILs. Thus, p-CREB and p-S6 may represent useful pharmacodynamic and efficacy biomarkers of immunotherapies targeting Ado. The effect of Ado on T cell metabolic fitness reinforces the importance of the adenosinergic pathway as a target for next-generation immunotherapy.
Keywords:Adenosine, CD8 T cells, Metabolism, mTOR, TILs
© The Author(s). 2019Open AccessThis article is distributed under the terms of the Creative Commons Attribution 4.0 International License (http://creativecommons.org/licenses/by/4.0/), which permits unrestricted use, distribution, and reproduction in any medium, provided you give appropriate credit to the original author(s) and the source, provide a link to the Creative Commons license, and indicate if changes were made. The Creative Commons Public Domain Dedication waiver (http://creativecommons.org/publicdomain/zero/1.0/) applies to the data made available in this article, unless otherwise stated.
* Correspondence:[email protected]
†Beatris Mastelic-Gavillet and Blanca Navarro Rodrigo contributed equally to
this work.
1Department of Oncology, Ludwig Institute for Cancer Research Lausanne,
Lausanne University Hospital and University of Lausanne, Lausanne, Switzerland
Background
Recently, it was discovered that activated T cells undergo a pronounced mTOR-mediated metabolic switch [1–3], and failure to reprogram metabolic activities leads to a hy-poresponsive state, including exhaustion and anergy [4,5]. In the tumor microenvironment (TME), multiple mecha-nisms such as overexpression of immune checkpoint mol-ecules [6] and loss of nutrients [7,8] were recently shown to impair T cell metabolic fitness, thus impairing immune control of tumor growth [9, 10]. However, it remains largely unexplored whether and how immunosuppressive molecules, such as adenosine (Ado), impair T cell func-tions by subverting their metabolic activity.
Extracellular Ado is produced by the sequential de-phosphorylation of ATP catalyzed by two cell surface ectonucleotidases, CD39 and CD73. In the TME, the ATP released by cell death, the increased expression of CD39 and CD73 and the decreased expression of the adenosine deaminase (ADA)/CD26 complex lead to the accumulation of Ado [11, 12]. The persistent high concentration of Ado may become detrimental, generating an immunosuppressive microenvironment [13–18]. Mechanistically, Ado mediates multiple ef-fects by binding the G-protein-coupled receptors A1, A2A, A2B and A3 [19]. Signaling of A2A and A2B adenosine receptors (A2AR, A2BR) through Gs pro-teins increases cyclic AMP levels and protein kinase A (PKA) activity [19–21]. Studies with selective ago-nists/antagonists have revealed the key role of A2AR in the suppression of T cell functions [15–17, 20]. However, the relative sensitivity of T cell subsets to Ado and the relevant mediators downstream of Ado receptors (AdoRs) have not yet been determined.
Here, we demonstrate that Ado immunosuppressive effects on human CD8+T cells are primarily exerted on T central memory cells (TCM), likely due to their higher levels of A2AR expression. Selective blockade of A2AR, but not A2BR, restored CD8+T cell functionality. Trig-gering A2AR increased PKA activation (i.e., CREB phosphorylation), resulting in impaired TCR signaling, the mTORC1 (but not mTORC2) pathway (i.e., S6 phosphorylation), cytokine production and metabolic fitness, both in the context of T cell polyclonal stimula-tion and of tumor cell recognistimula-tion and killing by au-tologous tumor infiltrating lymphocytes (TILs).
Our findings unveil the A2AR/PKA/mTORC1 path-way as the main axis for the Ado-mediated impair-ment of T cell function and metabolic fitness. In line with other studies evaluating the Ado pathway as a relevant target for immunotherapy [13, 14, 16, 21], we corroborate that blockade of A2AR has great po-tential for next-generation immunotherapy, and we propose p-CREB and p-S6 as potential biomarkers of efficacy for validation in future clinical studies.
Methods
Subjects and specimen preparation
Human blood samples from healthy donors were col-lected at the local Blood Transfusion Center Lausanne, Switzerland, under IRB approval (Ethics Committee, University Hospital of Lausanne-CHUV). Written in-formed consent was obtained from all healthy subjects and patients, in accordance with the Declaration of Helsinki. Fresh anticoagulated blood diluted at a 1:2 ra-tio in PBS was layered on lymphoprep (rara-tio of diluted blood:lymphoprep 1.5:1). Mononuclear cells were iso-lated by density gradient centrifugation (1800 rpm, 20 min centrifugation without break, room temperature), washed twice and immediately cryopreserved in 90% fetal calf serum (FCS) and 10% DMSO.
Informed consent from the cancer patients was ob-tained based on the procedures approved by the same IRB as mentioned above. Clinical characteristics are de-scribed in Additional file2: Table S2.
Freshly resected tumors not needed for histopatho-logic diagnosis were transferred in transport media (RPMI + 2% penicillin-streptomycin) in sterile con-tainers at 4 °C. Tumors were then cut into 1–2 mm2 pieces and used freshly or cryopreserved in 90% hu-man serum+ 10% DMSO.
Antibodies and reagents
1115, PKA inhibitor KT 5720, rapamycin and AKT1/2 in-hibitor MK 2206 were purchased from Sigma-Aldrich. Anti-CD3 used for the redirected cytotoxicity assay was generated by a hybridoma in house.
Virus-specific peptides
A peptide pool of CMV-EBV-Flu-specific peptides optimal for CD8+ T cells has been purchased from JPT Peptide Technologies. The following HLA-A2-restricted single pep-tides have been synthetized by the peptide facility at the Ludwig Cancer Institute of Lausanne: CMV-NLVPMVATV, EBV-GLCTLVAML, and Flu-GILGFVFTL.
Cell cultures
Cell lines
The EBV-transformed B-cell line (generated in house), hu-man leukemic lines: THP1, (catalog number (cn): TIB-202, ATCC) and HL60 (cn: CCL-240, ATCC), prostate cancer lines: DU145 (cn: HTB-81, ATCC) and PC3 (cn: CRL-1435, ATCC), LNCaP (cn: CRL-1740, ATCC), breast cancer cell line MCF-7 (cn: HTB-22, ATCC) and the mas-tocytoma cell line P815 (cn: TIB-64, ATCC) were main-tained in tissue culture flasks in RPMI supplemented with 10% FCS, amino acids and HEPES. All cell lines were peri-odically tested for mycoplasma contamination and con-firmed negative by PCR with mycoplasma-specific primers (5′-ACTCCTACGGGAGGCAGCAGTA-3′ and 5′ -TGCACCATCTGTCACTCTGTTAACCTC-3′).
Human peripheral blood mononuclear cells (PBMCs)
PBMCs were cultured in RPMI supplemented with 5% penicillin-streptomycin, 25 mM HEPES, and 8% heat-inactivated FBS. When mentioned, assays were per-formed in glucose-free RPMI supplemented with 5% penicillin-streptomycin.
Tumor-infiltrating lymphocytes (TILs)
For TILs expansion, tumor tissues were dissected into fragments of approximately 2 mm3. Each fragment was plated individually in a single well of a 24-well plate and stimulated with 6000 IU/ml rhIL-2 for 3 weeks. A rapid expansion protocol (REP) was performed by stimulating TILs with PHA 1μg/ml, 3000 IU/ml rhIL2 (Proleukin, Roche) and feeders. TIL culture media was RPMI sup-plemented with 5% penicillin-streptomycin (Gibco), 25 mM HEPES, 1% L-glutamine (Gibco), 1% nonessential amino acids (Gibco), 1% Na pyruvate (Gibco), 0.1% 2β -mercaptoethanol (Gibco), and 8% heat-inactivated, pooled human serum.
Melanoma cell lines
Autologous tumor cell lines were established from three melanoma samples. Tissue was mechanically dissociated, with a clamp and scalpel, and enzymatically dissected
using collagenase type I (Sigma-Aldrich) and deoxiribo-nuclease I (Roche) for 45–60 min at 37 °C. Tumor cell suspensions were cultured in RPMI, 10% fetal bovine serum (Gibco), and 1% penicillin-streptomycin (Gibco), dispensed into 10-cm petri dishes, and transferred to T-25 and T-75 flasks as cells expanded.
TIL/autologous tumor cell line cocultures
When described, cells were preincubated with the A2AR antagonist ZM 241385 (30μM) or the A2BR antagonist PSB 1115 (100μM) for 1 h and 30 min and then with nothing or Ado (30μM) for 2 h. After preincubation, 200,000 TILs/well were dispensed into a 96-well plate containing, or not, the same number of autologous mel-anoma tumor cells. Intracellular staining for cytokine production, the cytotoxic assay or p-CREB and p-S6 flow cytometry staining were then performed.
Cytokine production assay and intracellular staining Cryopreserved blood mononuclear cells were stimulated with anti-CD3/CD28 beads (bead-to-cell ratio = 1:2; Mil-tenyi) or CMV−/EBV−/Flu-specific peptides (1μM). TILs were stimulated by anti-CD3/CD28 beads (bead-to-cell ratio = 1:2; Miltenyi) or autologous tumor cell lines. Stimulation was performed overnight at 37 °C in the presence of GolgiPlug (1μg/ml; BD) and anti-CD107. When described, cells were preincubated with the A2AR antagonist ZM 241385 (30μM), the A2BR an-tagonist PSB 1115 (100μM), or the PKA inhibitor KT 5720 (30μM) for 1 h 30 min and then with nothing, Ado (30μM), or the A2AR agonist CGS 21680 (30μM) for an additional 2 h. The time of incubation for Ado was chosen as the time giving the lowest reduction in IFN-γ production with no impact on cell survival. The time of incubation of antagonists was chosen as the time needed by ZM 241385 to fully prevent Ado inhibition of IFN-γ production. Then, the cells were washed with PBS-2 mM EDTA and stained extracellularly. First, cells were stained for the surface markers CCR7 and CD45RA and with a viability dye (Zombie UV, Biolegend) for 20 min at 4 °C. Cells were then washed and permeabilized with Cytofix/Cytoperm solution (30 min 4 °C, Fix and Perm buffer, Becton Dickinson), washed with wash buffer (Becton Dickinson) and stained with antibodies directed to CD3, CD4, CD8, IFN-γ, TNF-α and IL-2 (20 min, 4 °C). After washing, the cells were resuspended in PBS and analyzed byflow cytometry.
Functional avidity assessment
response (EC50) was determined as described [22]. Pep-tide stimulation and antibody staining were performed as described in thecytokine production assay.
Functional sensitivity to ado assessment
Functional sensitivity to Ado of peripheral or expanded tumor-infiltrating or peripheral CD8+ T cells was assessed by stimulating cells overnight with anti-CD3/ anti-CD28-coated beads in the presence of decreasing doses of Ado (ranging from 0μM to 100μM) and meas-uring cytokine production by flow cytometry. The Ado concentration required to achieve a half-maximal cyto-kine response (IC50) was determined. Stimulation and antibody staining were performed as described in the
cytokine production assay.
P-CREBSer133, p-S6Ser235/236and p-AktSer473flow cytometry staining
Peripheral or expanded tumor-infiltrating CD8+ T cells were preincubated with the A2AR antagonist ZM 241385 (30μM), the A2BR antagonist PSB 1115 (100μM), or the PKA inhibitor KT 5720 (10μM) for 1 h and 30 min and then with nothing, Ado (30μM), or the A2AR agonist CGS 21680 for 2 h (30μM). Rapamycin (RAPA, 20μM) was used as a positive control for mTORC1 (p-S6Ser235/236) in-hibition, and MK2206 (100 nM) was used as a positive con-trol for mTORC2 (p-AktSer473) inhibition. To evaluate p-S6Ser235/236or p-AktSer473, CD8+T cells were stimulated for 3 h with anti-CD3/anti-CD28-coated beads or autologous tumor cell lines. Then, the cells were washed with PBS-2 mM EDTA and stained extracellularly. First, cells were stained for the surface markers CCR7, CD45RA and/or CD98, CD71 and with a viability dye (Zombie, Biolegend) for 20 min at 4 °C. Cells were then washed and fixed/ permeabilized with the Transcription Factor Staining Buffer Set (eBioscience). Cells were stained with antibodies di-rected to p-CREBSer133, p-S6Ser235/236 and p-AktSer473 (20 min, 4 °C). p-S6Ser235/236 and p-AktSer473 were not conju-gated to a fluorochrome; therefore, after washing, a pread-sorbed secondary goat anti-rabbit IgG H&L antibody Alexa Fluor® 488 (Abcam) was added. After washing, the cells were resuspended in PBS and analyzed by flow cytometry.
Measure of metabolic parameters by flow cytometry The following assays were performed in glucose-free medium. 2-[N-(7-Nitrobenz-2-oxa-1,3-diazol-4-yl)a-mino]-2-deoxy-d-glucose (2-NBDG, Invitrogen) uptake, CD98 and CD71 upregulation were carried out with magnetically isolated CD3+ T cells (Pan T Cell Isolation Kit, Miltenyi), which were preincubated with ZM 241385 (30μM), PSB 1115 (100μM), and KT 5720 (Sigma) for 1 h and 30 min and then with nothing, Ado (30μM), CGS 21680 or BAY 60–6583 (Sigma) for 2 h and finally activated overnight by anti-CD3/CD28 beads.
T cells were then stained with antibodies directed to CD3, CD4, CD8, CCR7, and CD45RA and when needed CD98 and CD71 (20 min 4 °C). To evaluate glucose uptake, cells were washed and incubated with 100μM 2-NBDG at 37 °C for 20 min prior to fluorescence meas-urement byflow cytometry.
Detection of AdoR mRNA by RNA flow cytometry (Prime Flow RNA, Affymetrix)
Human PBMCs were thawed, and when needed, total CD3+ cells were isolated by negative selection with a Pan T Cell Isolation Kit (MACS technology, Miltenyi). Cells were transferred to RNA Flow staining tubes (RNAse free; provided with the kit). Mouse splenocytes were also taken as a negative control and stained for anti-mCD45. Cells were first stained at the surface for CD3, CD4, CD8, CD56, CD16, CD19, CD14, CCR7, and CD45RA (20 min 4 °C) and then stained for AdoR mRNA following the manufacturers’ instructions [23]. Briefly, tubes were centrifuged at 2500 rpm for 5 min. Cells were then fixed and permeabilized in the presence of RNAse inhibitors. A second step of fixation was per-formed for 1 h at room temperature. Mouse cells were added to each human sample as an internal negative control or in a separate tube. Cells were then washed twice in wash buffer, and target probes for AdoRs were added and incubated for 2 h at 40 °C. After centrifuga-tion, the cells were left overnight at 4 °C. PreAmp-mix and Amp-mix were then added successively with an in-cubation time of 1 h and 30 min at 40 °C each and two washes between each incubation step. Finally, labeled custom probes directed against ADORA2A, ADORA2B, ADORA1 and ADORA3 were added, and the cells were washed beforeflow cytometry analysis.
Flow cytometry analysis
Flow cytometry acquisition was performed with an LSRFortessa flow cytometer (BD Biosciences). Flow cy-tometry analysis was performed with FlowJo software (Version 10.2, Treestar). Data were analyzed by Prism v7.
at room temperature. Then, the filters were incubated with the following primary antibodies overnight at 4 °C: Phospho-CREB (Ser133) (9198, Cell Signaling, USA; di-luted 1:1000); CREB (9197, Cell Signaling, USA; didi-luted 1: 1000); Phospho-p44/42 MAPK (Erk1/2) (Thr202/Tyr204) (9101, Cell Signaling, USA; diluted 1:1000); p44/42 MAPK (Erk1/2) (9102, Cell Signaling, USA; diluted 1:1000); Phospho-Akt (Ser473) (4058, Cell Signaling, USA; diluted 1:1000); Akt (pan) (2920, Cell Signaling, USA; diluted 1: 2000); Phospho-S6 Ribosomal Protein (Ser235/236) (2211, Cell Signaling, USA; diluted 1:1000); S6 Ribosomal Protein (2317, Cell Signaling, USA; diluted 1:1000); andα-Tubulin (3873, Cell Signaling, USA; diluted 1:1000). The mem-branes were washed 3 times with PBST and then incu-bated with (HRP)-conjugated anti-rabbit or anti-mouse antibodies for 2 h at room temperature. The membranes were then washed 3 times (10 min in PBST), and proteins were visualized by the ECL chemiluminescence method. The immunoreactive bands of proteins were acquired by using the GBOX Chemi XX6 system (Syngene).
Cytotoxic assay
When described, TILs were preincubated with the A2AR antagonist ZM 241385 (30μM) for 1 h and 30 min and then with nothing or Ado for 2 h (30μM). TILs were then dispensed into a 96-well plate, in triplicate, at decreasing densities: from 100,000 to 1000 cells/well.
Autologous melanoma cell lines or P815 cell lines (unloaded or loaded with anti-CD3) were labelled with 51
chromium for 45 min at 37 °C, and after 3 washing steps, 1000 cells were dispensed into each TIL-containing well. In addition, for calculation of specific lysis, 1000 cells were also dispensed into four wells containing only tumor medium (spontaneous release) and into four wells con-taining 1 M HCL (maximum release).
Effector and target cells were incubated in a total vol-ume of 200μl of RPMI 10% FBS or HCL for 4 h at 37 °C, 5% CO2. The plates were centrifuged for 3 min at 230×g. Forty microliters of the culture supernatants was trans-ferred to a LumaPlate-96 (PerkinElmer, Turku, Finland) and, after drying the plates, read on a TopCount NXT (Packard, Meriden, USA). The percentage lysis was cal-culated by the following formula:
%of Lysis¼ ð½experimental releasespontaneous releaseÞ
=ðmaximum releasespontaneous releaseÞ
100:
Semiquantitative RT-PCR (qRT-PCR) (SYBR GREEN)
To measure AdoR expression, CD8+ T cells were iso-lated from cryopreserved blood mononuclear cells by magnetic activated cell sorting (MACS technique) using a CD8+T Cell Isolation Kit (Miltenyi Biotech) according
to the manufacturer’s instructions. The MCF-7, EBV-B, PC3, THP-1 and HL-60 cell lines were also used as in-ternal controls for validation. AdoR and HIF-1α expres-sion were measured in total TILs. Total cellular RNA was isolated by the RNeasy Micro kit (Qiagen). cDNA was synthesized from 250 ng of total RNA using the Super-script II system according to the manufacturer’s protocol (Life Technologies). PCR reactions contained cDNA, 2x qPCR Master Mix (KAPA Biosystems), and 2μM of for-ward and reverse primers. qRT-PCR was performed on an Applied Biosystems® 7500 Fast Real-Time PCR instru-ment. Each reaction was performed in three replicates, with beta-2-microglobulin (β2M) as an internal control gene for normalization. Raw Ct values were imported into Excel, and the expression levels of the PCR products rela-tive toβ2M were calculated using the 2−ΔCt method.
The primer sequences used were as follows:β2M sense, 5′-CCAGCAGAGAATGGAAAGTC-3′; antisense, 5′ -GATGCTGCTTACATGTCTCG-3; ADORA1 sense, 5′ -CCTCCATCTCAGCTTTCCAG-3′(DOI: 10.1182/blood-2013-02-482406); antisense, 5′-AGTAGGTCTGTGGC CCAATG-3′, ADORA2A sense, 5′- CTCCGGTACA ATGGCTTGGT-3′; antisense, 5′- TGGTTCTTGCCCTC CTTTGG-3′, ADORA2B sense, 5′-ATGCCAACAG CTTGAATGGAT-3′; antisense, 5′-GAGGTCACCT TCCTG GCAAC-3′, ADORA3 sense, 5′-TTGACC AAAAGGAGGAGAAGT-3′; antisense, 5′- AGTCAC ATCTGTTCAGTAGGA G-3′. HIF-1α sense, 5′-GGC AGC AAC GAC ACA GAA ACT GA-3′; antisense, 5′ -TGA TCC -TGA ATC TGG GGC ATG GT-3′ (DOI: https://doi.org/10.1038/s41598-017-00508-x).
The efficiency of each primer set was tested by generat-ing a standard curve usgenerat-ing relative positive control sam-ples for each primer (MCF-7, EBV-B, PC3 and HL-60 for adenosine receptor A1, A2A, A2B and A3, respectively). All primers were tested by qRT-PCR using a two-fold ser-ial dilution of cDNA and water as a nontemplate control to determine the amplification efficiency and specificity. The amplification efficiency for each primer was deter-mined from the linear slope of the standard curve; only primers with a standard curve slope between−3.1 and− 3.4 were used for further quantification.
Analysis of the relative changes (arbitrary units) in gene expression required calculations based on the threshold cycle (Ct: the fractional cycle number at which the amount of amplified target reaches a fixed thresh-old). The threshold cycles of the cell subsets were then normalized based on the threshold cycle of the house-keeping gene (β2M) to obtain theΔCt.
Measure of glycolytic and phospho-oxidative metabolism (seahorse assay)
Ado (30μM). Cells were then stimulated overnight with anti-CD3/CD28 beads, and the seahorse assay was per-formed. For the extracellular flux assay, the sensor cart-ridge was hydrated overnight in Seahorse XF Calibrant at 37 °C in a non-CO2 incubator. A total of 4 × 10⁵ hu-man T cells with different treatment conditions were seeded in a Seahorse Bioscience culture plate for 30 min. OCR and ECAR were then measured by an XF96 Sea-horse Extracellular Flux Analyzer following the manufac-turer’s instructions. During the seahorse assay, cells were treated with oligomycin (0.5μM), FCCP (2μM), rote-none (0.5μM), antimycin A (0.5μM) and 2-DG (50 mM). Each condition was performed in 3–6 replicates.
Statistical analysis
Statistical analysis was performed with Prism software (Version 7, GraphPad) using nonparametric and para-metric paired (Friedman or Wilcoxon or t test) and un-paired (Kruskal-Wallis or Mann-Whitney) tests as indicated. For multiple comparisons, adjusted P-values were calculated by one-way ANOVA followed by Dunn’s test. Correlations were assessed by the nonparametric Spearman’s test.
Results
Human CD8+T cell memory subsets are differentially affected by ado
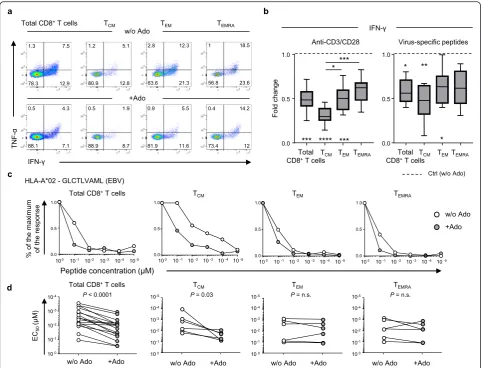
Activated naïve CD8+T cells differentiate in memory sub-sets with distinct phenotypic and functional properties [24]. The differentiation and maintenance of murine naïve CD8+ T cells is negatively impacted by A2AR signaling [25]. However, the differences in the sensitivity to Ado of memory subsets in human CD8+T cells have not yet been explored. We identified the major CD8+ T cell memory subsets according to their differential expression of CCR7 and CD45RA (i.e., T central memory-TCM, T effector memory-TEM, T terminally differentiated-TEMRA; Add-itional file1: Figure S1a, Additional file2: Table S1), and we assessed the relative sensitivity to Ado by measuring cytokine production following polyclonal or antigen-specific stimulation (Fig.1a-b, Additional file2: Table S1). Exposure to Ado decreased cytokine production (i.e.,
IFN-γ, TNF-α, and IL-2) and partially decreased the degranula-tion activity (i.e., CD107a mobilization) in CD8+ T cells (Fig.1a-b and Additional file1: Figure S1 b-d), consistent with previous studies [14,16, 17,20]. Ado mediated sup-pression of responses to both polyclonal stimulation (i.e.,
anti-CD3/anti-CD28-coated beads) (Fig. 1a-b and Additional file 1: Figure S1b-d) and viral epitopes (Fig. 1b and Additional file 1: Figure S1c) but not stimulation with ionomycin or phorbol-12-myristate-13-acetate (PMA) (Additional file 1: Figure S1b,e). Of interest, among the distinct T cell subsets, TCMwere more sensitive to Ado, with deeper suppression of cytokine
production than those of the TEMand TEMRAsubsets (Fig. 1b and Additional file1: Figure S1f).
The functional avidity of CD8+T cells, also called anti-gen sensitivity, is measured as the peptide concentration able to mobilize 50% of the maximal response (EC50). The functional avidity of T cells is independent of the magnitude of a response measured at saturating antigen concentrations [26] and is usually associated with super-ior control of virus replication or tumor growth [22,27]. We evaluated the functional avidity of a panel of virus-specific polyclonal CD8+ T cells exposed to decreasing peptide concentrations. We observed that Ado signifi-cantly reduced the functional avidity of all virus-specific CD8+ T cells (Fig. 1c-d), with the strongest effect ob-served in the TCMsubset (Fig.1c-d). These data indicate that Ado limits the ability of T cells to respond to tar-gets expressing cognate antigens.
A2AR expression levels dictate ado sensitivity in human CD8+T cells
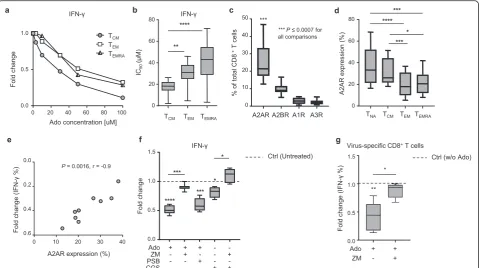
Our data suggest that TCM cells are the most sensitive subset to functional blunting by Ado. To substantiate this further, we quantified the functional sensitivity to Ado of each memory subset by determining the Ado concentra-tion inhibiting 50% of the maximal response (IC50 of the cytokine production). We confirmed that CD8+TCMcells displayed higher sensitivity to Ado than TEM and TEMRA cells (Fig.2a-b and Additional file1: Figure S2a).
We therefore hypothesized that the differential sensi-tivity to Ado may be explained by TCM cells expressing higher AdoR levels than the other memory subsets. Due to the lack of antibodies for flow cytometry analyses for A1R and A3R, we established RNA staining for flow cy-tometry (PrimeFlow RNA assay) [23] (Additional file 1: Figure S2b) to determine the expression of all four ADORs (i.e., ADORA1, ADORA2A, ADORA2B and
with A2AR expression measured by PrimeFlow RNA
(Additional file1: Figure S2f-g). Moreover, we confirmed the lower/undetectable expression of A2BR by CD8+ T cells (Additional file1: Figure S2f, h).
We then evaluated AdoR expression in total CD8+ T cells and in different memory subsets ex vivo. Of inter-est, A2AR was expressed at a higher percentage than other AdoRs in total CD8+ T cells (Fig.2c). Among the memory subsets, it was predominantly expressed by CD8+ TCMcells, similar to naïve CD8+ T cells (Fig. 2d). These data strongly suggest that the high sensitivity of CD8+ TCMcells to Ado is associated with their high ex-pression of A2AR. In addition, our results not only sup-port the role of A2AR as a critical player in Ado-mediated suppressive effects in CD8+T cells but also in-dicate that A2AR expression quantitatively dictates
sensitivity to Ado. This was further corroborated by the positive correlation between A2AR expression in CD8+ T cells and the Ado-mediated fold change (i.e.,decrease) in IFN-γ production (Fig. 2e), which was not observed for A2BR (Additional file1: Figure S3a).
Furthermore, we evaluated whether blocking A2AR or A2BR with selective inhibitors (ZM 241385 and PSB 1115, respectively) would prevent the Ado-mediated reduction of cytokine production. The blockade of A2AR, but not A2BR, was able to circumvent the immunosuppressive ef-fects of Ado on CD8+T cells (Fig.2f). The selective A2AR agonist CGS 21680 was also able to reduce IFN-γ produc-tion in CD8+ T cells (Fig. 2f). Consistent with what was already shown in the presence of Ado (Fig.1b), CGS 21680 primarily affected the TCM subset (Additional file1: Figure S3b). The preventive action of A2AR- or A2BR-selective Fig. 1Ado-mediated immunosuppression of T cell function depends on the differentiation stage.aRepresentative example andbcumulative data showing the Ado-mediated fold change in IFN-γproduction in total and in distinct memory CD8+T cell subsets (T
CM, TEM, and TEMRA) stimulated overnight with anti-CD3/anti-CD28-coated beads (n= 12) or CMV−/EBV−/Flu-specific peptides(n= 11). The 25th to 75th percentiles, the median and min-max of the values are presented. *P< 0.05, **P< 0.01, ***P< 0.001, ****P< 0.0001. Wilcoxon and one-way ANOVA tests.c
Representative example anddcumulative data of the virus-specific CD8+T cell functional avidity measured in the presence or absence of Ado in total (n= 12) and in distinct memory CD8+T cell subsets (T
inhibitors was equal in all the differentiation subsets evalu-ated (data not shown). The blockade of A2AR or A2BR alone did not affect cytokine production significantly (Add-itional file1: Figure S3c). Finally, selective A2AR blockade also efficiently prevented Ado-mediated immunosuppres-sion of virus-specific CD8+T cells (Fig.2g).
Taken together, these data not only confirm A2A as the main receptor responsible for Ado-mediated im-munosuppression but also highlight the relevance of A2AR expression levels in quantitatively determining Ado suppressive effects in primary human CD8+T cells.
Ado/A2AR triggers PKA, impairing TCR/mTORC1 signaling and metabolic/effector functions in CD8+T cells
Ado-mediated activation of A2AR increases intracellular cAMP levels [28], and many of the downstream effects of cAMP elevation are dependent upon PKA activation [19,29]. Of interest, the selective inhibition of the PKA pathway in CD8+T cell clones can prevent Ado-induced suppression of cytokine production [20]. We therefore
investigated whether molecular mediators of PKA signal-ing were activated by Ado in primary human CD8+ T cells. Basal p-CREB levels increased in the presence of Ado or CGS 21680, which is a selective A2AR agonist (Fig. 3a and Additional file1: Figure S4a-b). This effect was prevented by both the PKA-specific inhibitor KT 5720 (Fig.3a and Additional file1: Figure S4a-b) and the selective A2AR antagonist ZM 241385 (Fig.3a and Add-itional file1: Figure S4a-b), while it was not affected by the selective A2BR antagonist (PSB 1115, Fig. 3a). All memory T cell subsets were influenced by Ado (Add-itional file 1: Figure S4c), while CGS 21680 mostly af-fected the TCM subset (Additional file 1: Figure S4c), mirroring the functional data (Fig.1).
Consistent with the increase in PKA activation and previous observations [21, 30], we observed that Ado re-duces TCR-dependent ERK phosphorylation in primary human CD8+ T cells, reflecting impaired TCR signaling. Notably, this effect was dependent upon A2AR/PKA sig-naling (Additional file1: Figure S4d-e).
Fig. 2A2AR expression levels are correlated with the extent of Ado-mediated immunosuppression.aRepresentative example andbcumulative data of the functional sensitivity (EC50of IFN-γproduction) to Ado measured in distinct CD8
+
Since the mTOR pathway is pivotal for complete T cell activation and induces potent effector functions [4,31,32], we evaluated whether Ado/A2AR signaling could affect mTOR triggering in a PKA-dependent manner. To this end, we assessed the phosphorylation of downstream effec-tors of mTORC1 and mTORC2, i.e.,S6 (p-S6; Additional file 1: Figure S5a-b) and AktSer473(p-AktSer473; Additional file1: Figure S5c-d) after polyclonal CD8+ T cell stimula-tion. Ado signaling markedly impaired phosphorylation of S6 (Fig. 3b and Additional file 1: Figure S5a-b) but not of AktSer473(Additional file 1: Figure S5c-e). These data indicate that the mTORC1, but not the mTORC2, complex is a target of Ado-mediated signaling in pri-mary human CD8+ T cells. Importantly, this effect was mediated by A2AR activation since the selective A2AR agonist CGS 21680 also reduced S6 phosphorylation (Fig. 3b), and the selective inhibitor of A2AR (ZM 241385), but not A2BR (PSB 1115), was able to prevent both Ado and CGS 21680 effects (Fig.3b). Interestingly, S6 phosphorylation was reduced in both TCMand TEM subsets but not in the TEMRA subset (Additional file 1: Figure S5f). Additionally, the selective agonist of A2AR (CGS 21680) predominantly affected the TCM compart-ment (Additional file1: Figure S5f), mirroring the func-tional data (Fig. 1). Finally, blockade of the PKA pathway prevented Ado-mediated inhibition of mTORC1 activation (Fig.3b), thus indicating that Ado impaired mTORC1 signaling through PKA activation. These data strongly suggest that Ado/A2AR signaling impairs mTORC1 activation in human CD8+ T cells through PKA, likely due to the PKA-dependent inhib-ition of TCR signaling.
mTOR is the main complex responsible for both meta-bolic rewiring [3, 33] and augmented effector functions following TCR-mediated activation [34, 35]; thus, we assessed whether Ado also impaired CD8+ T cell meta-bolic fitness. Upon CD8+T cell activation, Ado impaired metabolic activity of both OXPHOS and glycolysis in an A2AR-dependent manner (Fig. 3c). However, Ado in-duces more severe impairment of ECAR, suggesting that cells prefer to utilize oxygen consumption to sustain metabolic needs in this condition.
This was further confirmed by the Ado-mediated im-pairment of CD71/CD98 expression and of 2-NBDG (glucose analog) uptake (Fig. 3d and Additional file 1: Figure S6a). The selective inhibition of A2AR, but not of A2BR, prevented the Ado-mediated effects (Fig. 3d). Among the memory CD8+T cell subsets, TCMcells were the most affected (Additional file1: Figure S6b). Notably, both PKA and A2AR inhibition were able to prevent Ado-mediated impairment of metabolic fitness and cyto-kine production (Fig.3d-e).
Taken together, these results strongly suggest that the Ado/A2AR-mediated increase in PKA activation in
primary human CD8+ T cells leads to subsequent im-pairment in metabolic fitness and effector functions, likely due to the reduction in TCR signaling and mTORC1 activation.
Previous data support the hypothesis that hypoxia could induce the activation of the CD73-A2AR adeno-sine pathway and that A2AR expression was positively correlated in head and neck squamous cell carcinoma tissues [18, 37, 38]. However, we did not find a correl-ation between the expression of HIF-1α and A2AR in the expanded TILs (Additional file1: Figure S7f).
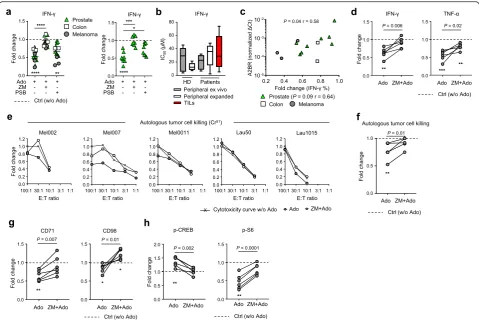
Ado can inhibit the ability of TILs to recognize and kill target cells loaded with the melanoma differentiation antigen MART125–36peptide [39]. However, the effect of Ado on autologous tumor cell recognition was not ad-dressed. We first characterized AdoR expression in 6 au-tologous melanoma cell lines (Additional file 2: Table
S2) by qRT-PCR and compared it to AdoR expression in TILs expanded from the same lesion. In contrast to TILs, tumor cells expressed A2AR at lower levels than A2BR and at levels comparable to A1R and A3R (Add-itional file 1: Figure S8a). We then evaluated whether Ado could impair the ability of TILs to respond to au-tologous tumor cells in vitro. Of interest, Ado was able to reduce cytokine production, cytotoxic activity and metabolic fitness of melanoma-derived TILs cocultured with autologous tumor cells (Fig. 4d-g and Additional file 1: Figure S8b-c). In the redirected killing assay, the maximum frequency of cell lysis was 100% for all pa-tients tested, and the suppressive effect of Ado on Fig. 3Ado/A2AR signaling modulates PKA and mTORC1 activation and impairs CD8+T cell metabolic fitness and cytokine production.a
cytotoxic function was almost undetectable (less than 20% reduction for any ratio considered) (Additional file 1: Figure S8d). In contrast, in the autologous setting, Ado inhibition was more pronounced, reaching a 50% reduction for some of the ratios tested where the max-imum level of cell lysis was approximately 20% (Mel002, Mel007, and Lau1015) (Fig. 4e). The lowest effect was observed for patients Mel0011 and Lau50, where the cytotoxicity was naturally very high (91 and 100%). We could not test the effect of Ado in patient Lau1660 due to a low overall killing capacity (less than 10%). In the
autologous setting, when the highest lysis values were considered (effector:target ratio E:T = 100:1), a signifi-cant reduction of cytotoxicity was observed in the pres-ence of Ado, which was prevented by A2AR blockade (ZM 241385) (Fig. 4f). These observations suggest that in a physiological setting where tumor rejection antigens may be poorly expressed by tumors or when TILs con-tain limited frequencies of tumor antigen-specific T cells, then Ado may play an important role in preventing tumor cell killing by activating A2AR signaling. The variability in the Ado effect observed at different E:T Fig. 4Ado impairs TIL effector functions and autologous tumor cell recognition.aCumulative data of the fold change in CD8+TIL IFN-γ
production in the presence of the indicated combinations of Ado, A2AR agonist (CGS 21680) and A2AR/A2BR antagonists (ZM 241385 and PSB 1115, respectively) (n= 14). The left graph shows all the TIL samples analyzed, while the right graph only shows prostate-derived samples.b
Cumulative data of the functional sensitivity (IC50of IFN-γproduction) to Ado measured in resting or expanded peripheral CD8+T cells (n= 5) derived from HD or patients and in CD8+TILs (n= 10) derived from patient tissues. The functional sensitivity was measured after overnight stimulation by anti-CD3/CD28-coated beads in the presence of decreasing concentrations of Ado.cCorrelation between A2BR expression measured by qRT-PCR and the Ado-mediated fold change in IFN-γproduction in CD8+TILs. Spearman’s test,n= 13 (n= 8 for the prostate sample analysis).dCumulative data of the fold change in IFN-γand TNF-αproduction by TILs stimulated overnight by autologous tumor cells in the presence of Ado or ZM 241385 + Ado. (n= 6)eEach graph represents cytotoxicity curves for one patient quantified in the absence of Ado, in the presence of Ado or ZM 241385 + Ado. Data are presented as normalized to the cytotoxicity measured in the absence of Ado at the
ratios, however, indicates that further investigation is needed to confirm this evidence. Notably, Ado-mediated immunosuppression in the autologous setting was con-comitant with a decrease in metabolic fitness (i.e. CD71 and CD98 upregulation, Fig. 4g), an increase in p-CREB and a decrease in p-S6 activation (Fig.4h and Additional file 1: Figure S8e-f); these effects were also prevented by the selective inhibition of A2AR (Fig.4d-h). These data suggest a predominant role of Ado in mediating the sup-pression of human expanded TILs through A2AR signal-ing, thus potentially jeopardizing the efficacy of adoptive cell transfer.
Discussion
Several targets, such as CD39, CD73 and AdoRs, con-tributing to the accumulation of Ado and its immuno-suppressive effects in the TME are under evaluation in preclinical and clinical studies of cancer immunother-apy [40–43]. Ado is known to suppress tumor immun-ity by reducing immune cell infiltration, cytotoxicimmun-ity and cytokine production [20, 43]. Moreover, CD8+ T cell effector functions and metabolic fitness are dramat-ically impaired in the TME [9, 10]; thus, understanding the mechanisms of action of immunosuppressive mole-cules is pivotal to restoring an efficient anti-tumor im-mune response. However, mediators of Ado signaling are not fully understood, and biomarkers of efficacy for therapies targeting the adenosinergic pathway remain unknown. Our study unveils new mechanisms of Ado-mediated suppression in CD8+ T cells and highlights potential new biomarkers to monitor during Ado-targeted immunotherapies.
The inhibition of T cell activation in early-differentiated cells can preclude the regeneration of the effector cells that will die after exerting their cytotoxic/inflammatory function. TCM cells have a longer half-life than effector cells and an enhanced ability to divide and differentiate into more differentiated subsets [24]. We found that hu-man CD8+TCMcells are the most sensitive to Ado due to their high expression of A2AR. A high concentration of Ado in the TME may therefore negatively affect the re-newal of fully differentiated effector cells. Studies in both mice and, to a lesser extent, humans support the main role of A2AR in mediating Ado-dependent T cell immunosup-pression and exhaustion in the TME [16,17, 20,21]. We identified A2AR as the main mediator of the Ado im-munosuppressive effect in peripheral and tumor-infiltrating human CD8+ T cells, strengthening the importance of this target in next-generation immuno-therapy. As previously suggested [20, 21], we con-firmed that the Ado/A2AR-mediated suppression in human CD8+ T cells relies on PKA activation and in-hibition of TCR signaling. To evaluate the expression
of the 4 AdoRs, we used RNA flow technology due to the lack of anti-A1R and anti-A3R antibodies available for flow cytometry. We found consistent expression of A2A and A2B receptors measured by RNA flow and by antibodies. However, these antibodies are not optimal for flow cytometry since both were developed for western blotting; anti-A2AR is against an intracel-lular epitope, thus requiring permeabilization of the cells and not allowing the distinction between the surface and the intracellular compartment, while the anti-A2BR is polyclonal, thus affecting his affinity and specificity. Finally, these antibodies cannot be com-bined in the same panel since A2BR staining is erased by cell permeabilization.
Independent studies have reported the Ado inhibitory effect on the mTORC pathway and chemotaxis in neu-trophils [44] and the presence of a PKA-dependent man-ner of mTORC1 inhibition in nonimmune cells that was unrelated to the classical mTORC1 activators (i.e.,
TSC2, Rheb and Rag GTPases) [45, 46]. However, there is no previous evidence demonstrating that Ado impairs mTORC1 activation in an A2AR/PKA-dependent man-ner in CD8+ T cells. Herein, we demonstrate that Ado reduces TCR-dependent mTORC1 activation by trigger-ing A2AR and PKA. Although mTORC1-independent effects cannot be excluded, the importance of this com-plex in mediating effective T cell activation [1,4, 31,32] strongly suggests that, among the targets of TCR signal-ing, impairment of mTORC1 activation is responsible for most of the Ado/A2AR/PKA-mediated suppressive effects in human CD8+ T cells. Notably, we show that Ado signaling in both peripheral CD8+ T cells and TILs exposed to autologous tumors or to polyclonal stimula-tion not only impaired cytokine producstimula-tion but also metabolic fitness. The impairment in mTORC1 activa-tion is presumably the leading cause of the impairment in CD8+ T cell metabolism. From a translational stand-point, this evidence implies that Ado/A2AR-mediated immunosuppression may be reverted as well by mole-cules aiming at improving mTOR activation and metab-olism selectively in T cells [47, 48]. On the other hand, the Ado pathway may be key in leading to T cell metab-olism uncoupling in the TME, and thus, targeting this signaling may restore the metabolic fitness of infiltrating T cells.
types is not different from that of peripheral CD8+ T cells. However, TILs derived from prostate samples also express variable amounts of A2BR, and the selective in-hibition of this receptor prevents Ado-mediated im-munosuppression. This effect was quantitatively correlated with the level of A2BR expression. Although further investigation is needed, the monitoring of A2BR expression in TIL products may be of interest for next-generation personalized immunotherapy in the context of adoptive cell transfer.
Despite indications in the literature of a causal con-nection between hypoxia and the adenosine pathway, we did not find a correlation between the expression of HIF-1αand A2AR. This may be explained by the lack of a hypoxic environment in the in vitro TIL culture that is instead present in tumor tissues.
Remarkably, Ado is able to affect both polyclonal re-sponses of TILs derived from multiple tumors and autolo-gous tumor-cell recognition by melanoma TILs by reducing cytokine production and metabolic fitness. Ado is therefore able to exert systemic immune suppression as well as to impair antitumor activity. Along the same lines, we show a reduction in the killing capacity of autologous targets at some E:T ratios. This effect was barely observed in the redirected killing assay where killing was 100%. In vivo, however, tumor antigens are not expressed homoge-neously throughout the tumor tissue, and their accessibil-ity is limited to specific T cells. Thus, in this context, Ado may exert an inhibitory effect on killing capacity. Our data support this possibility; however, since the impairment in the in vitro cytotoxicity observed is dependent on the E:T ratio, further investigations are needed to explore this hy-pothesis. The blockade of A2AR abrogated Ado-mediated immunosuppression by preventing an increase in p-CREB and by restoring p-S6 activity. Finally, we did not find any effect of A2AR or A2BR inhibitors on the TIL expansion capacity. This may be due to the absence of a significant concentration of Ado in the culture or to the instability of the compound used that would not allow for observing a significant effect in long-term cultures. This should be better investigated by using drugs currently under investi-gation in clinical trials [50]. Nevertheless, the AdoR ex-pression and the susceptibility of expanded TILs to Ado immunosuppression described in our study strongly sup-port the Ado/A2AR pathway as an imsup-portant target for cancer immunotherapy with particular relevance for com-binatorial T cell-based strategies.
The recent remarkable clinical success of immunother-apy brings along the need to discover predictive bio-markers of treatment efficacy and related adverse effects. This will help immune oncologists make decisions before and during therapy. To date, judgements are mainly based on the overall assessment of clinical improvement and treatment tolerance; however, early immunomodulation
markers need to be unveiled to act faster and more specif-ically to improve clinical success rates. In this context, we observed that A2AR expression levels quantitatively dic-tate CD8+T cell sensitivity to Ado and that A2AR block-ade rapidly affected p-CREB and p-S6 levels during autologous tumor cell recognition. Therefore, in future preclinical or clinical studies testing therapies targeting the adenosinergic pathway, it will be relevant to monitor T cell expression of A2AR to predict their sensitivity to Ado but also of p-CREB and p-S6 to unveil their potential as biomarkers.
Conclusions
Overall, our data support the relevance of targeting the Ado/A2AR immunosuppressive pathway to restore both effector function and metabolic fitness of peripheral and tumor-derived CD8+ T cells. This could be of particular interest in combination with adoptive cell transfer to prevent TME immunosuppression and improve treat-ment efficacy. Finally, we postulate that the modulation of A2AR, p-CREB and p-S6 expression levels may be valuable efficacy biomarkers of A2AR blockade and T cell function recovery in the context of clinical studies.
Additional files
by qRT-PCR. (d-e) Correlation between AdoR expression measured by RNA flow and qRT-PCR in (d) cell lines and (e) primary human CD8 T cells. Spearman tests. (f) Represenative example of flow cytometry stain-ing of total CD8 T cells by anti-A2AR and anti-A2BR antibodies. (g) Correl-ation between the expression of A2AR measured by antibody staining and RNA staining for flow cytometry in total CD8+T cells. Spearman test. (h). Cumulative data of the expression of A2AR and A2BR in total CD8+T cells measured by antibody staining for flow cytometry. The 25th to 75th percentiles, the median and min-max of the values are represented;n= 9.Figure S3.Functional consequences of AdoRs signaling. (a) Correlation between A2BR expression measured by RNA flow and the Ado-mediated fold change in IFN-γproduction evaluated in total CD8+T cells. Spear-man test,n= 9. (b) Cumulative data showing the fold change in IFN-γ production by distinct memory CD8+T cell subsets (TCM, TEM, TEMRA) stim-ulated with anti-CD3/anti-CD28 coated beads in presence of the A2AR selective agonist CGS 21680. The 25th to 75th percentiles, the median and min-max of the values are represented;n= 6. **P< 0.01, ***P< 0.001, one-way ANOVA test. (c) Cumulative data showing the fold change in IFN-γproduction by CD8+T cells stimulated with anti-CD3/anti-CD28 coated beads in presence of Ado alone, or the A2AR selective antagonist (ZM 241385) alone, or the A2BR selective antagonist (PSB 1115) alone. The 25th to 75th percentiles, the median and min-max of the values are represented;n= 6. ****P< 0.0001, one-way ANOVA test.Figure S4.Ado/ A2AR impact p-CREB and TCR signaling activation. (a) Representative ex-ample of p-CREB expression detected by flow cytometry in total CD8+T cells after treatment with Ado or the indicated combination of A2AR agonist (CGS 21680) and antagonist (ZM 241385) or the PKA inhibitor (KT570). (b) Representative western blot analysis of p-CREB and CREB in total CD8+T whole-cell lysates after treatment with Ado or the depicted combination of A2AR antagonist (ZM 241385) or the PKA inhibitor (KT570).α-Tubulin was detected as a loading control.n= 3. (c) Cumula-tive data showing the fold change in p-CREB expression by distinct mem-ory CD8+T cell subsets (T
CM, TEM, TEMRA) in presence of Ado or the A2AR selective agonist CGS 21680. The 25th to 75th percentiles, the median and min-max of the values are represented;n= 7. *P< 0.05, **P< 0.01, ***P< 0.001, one-way ANOVA test. (d) Representative western blot ana-lysis and (e) cumulative data of p-ERK and ERK in total CD8+T whole-cell lysates after treatment with Ado and stimulated for 3 h by anti-CD3/anti-CD28 coated beads or the depicted combination of A2AR antagonist (ZM 241385) or the PKA inhibitor (KT570).α-Tubulin was detected as a loading control.n= 3.Figure S5.Ado/A2AR impact p-S6 activation. The data rep-resented in this figure were obtained analyzing CD8+T cells stimulated for 3h by anti-CD3/anti-CD28 coated beads under the distinct described conditions. (a) Representative example of p-S6 expression detected by flow cytometry after treatment with Ado or the depicted combination of A2AR agonist (CGS 21680) and A2AR/A2BR antagonists (ZM 241385 and PSB 1115). (b) Representative western blot analysis of p-S6 and S6 after treatment with Ado alone or combined with the A2AR antagonist (ZM 241385) or the PKA inhibitor (KT570), Rapamycin, the AKT1/2 inhibitor (MK2206).α-Tubulin was detected as a loading control.n= 3. (c) Repre-sentative example of p-AktSer473expression detected by flow cytometry in total CD8+T cells stimulated for 3 h by anti-CD3/anti-CD28 coated beads in resting condition or after treatment with Ado. (d) Representative western blot analysis of p-AktSer473and AktSer473after treatment with Ado alone or combined with the A2AR antagonist (ZM 241385) or the PKA in-hibitor (KT570), Rapamycin, the AKT1/2 inin-hibitor (MK2206) and stimulated for 3 h by anti-CD3/anti-CD28 coated beads.α-Tubulin was detected as a loading control.n= 3. (e) Cumulative data showing the fold change in p-AktSer473expression expression after treated with the indicated combina-tions of Ado, A2AR agonist (CGS 21680), A2AR/A2BR antagonists (ZM 241385 and PSB 1115, respectively) or the AKT1/2inhibitor (MK2206). The 25th to 75th percentiles, the median and min-max of the values are rep-resented;n= 7. (f) Cumulative data showing the fold change in p-S6 ex-pression by distinct memory CD8+T cell subsets (T
CM, TEM, TEMRA) in presence of Ado or the A2AR selective agonist CGS 21680. The 25th to 75th percentiles, the median and min-max of the values are represented; n= 14 andn= 12 from left to right. **P< 0.01, ***P< 0.001, ****P< 0.0001, one-way ANOVA test.Figure S6.Ado affects CD8+T cell glyco-lytic metabolism. (a) Representative example of CD71, CD98 expression and 2-NBDG uptake detected by flow cytometry in total CD8+T cells in
resting condition or after treatment with Ado and stimulated overnight by anti-CD3/anti-CD28 coated beads. (b) Cumulative data showing the fold change of CD71, CD98 expression and 2-NBDG uptake by distinct memory CD8+T cell subsets (T
CM, TEM, TEMRA) stimulated overnight by anti-CD3/anti-CD28 coated beads in resting condition or after treatment with Ado. The 25th to 75th percentiles, the median and min-max of the values are represented;n= 17,n= 11,n= 14 from left to right. **P< 0.01, ***P< 0.001, ****P< 0.0001, one-way ANOVA test.Figure S7. Com-position, functionality and AdoR expression in TILs. (a) Proportion of CD4+and CD8+T cells in REP expanded TILs derived from normal/in-flamed or tumor prostate tissue and metastasis of colon cancer or of mel-anoma. (b) Cumulative data of the frequency of cytokine-producing or CD107+CD8+TILs. Each dot represents a patient, lines indicate Mean ± SEM;n= 1. (c) Cumulative data of the fold change in IL-2, TNF-α produc-tion and CD107 expression by TILs stimulated overnight with autologous tumor cells in presence of Ado or ZM 241385 + Ado or PSB 1115 + Ado. Each dot represents a patient, lines indicate Mean ± SEM;n= 14. **P< 0.01, ***P< 0.001, ****P< 0.0001, ****P< 0.0001, one-way ANOVA test. (d) Cumulative data of the expression of AdoR in peripheral T cells from healthy donors and in TILs derived from the depicted tissue types. The 25th to 75th percentiles, the median and min-max of the values are rep-resented by boxes. Each dot represents a patient. The positivity threshold is determined as 2 log higher expression than values given by water. (e) Cumulative data of the expression of AdoR in peripheral CD8+T cells from healthy donors at day 0 or after 3 and 10 days stimulation with anti-CD3/anti-CD28 coated beads. Each dot represents the mean of 8 healthy donors analyzed. *P< 0.05, one-way ANOVA test. (f) Correlation between the A2AR and HIF-1αexpression measured by qRT-PCR in TILs. Spearman test,n= 13.Figure S8.AdoR expression and Ado immunosuppression in TILs/autologous tumor cells setting. (a) Cumulative data of the expression of AdoR in peripheral melanoma-derived TILs and tumor cells. The 25th to 75th percentiles, the median and min-max of the values are repre-sented by boxes;n= 6. (b) Representative example of cytokine produc-tion in melanoma-derived TILs after overnight stimulaproduc-tion with autologous tumor cells in untreated culture condition, in presence of Ado or ZM 241385 + Ado. (c) Representative example of CD71 and CD98 expression by TILs stimulated for overnight by autologous tumor cells in resting condition, in presence of Ado or ZM 241385 + Ado. (d) Each graph represents cytotoxicity curves for one patient quantified in resting condition, in presence of Ado or ZM 241385 + Ado. Data are represented as normalized to the cytotoxicity measured in absence of Ado at the effector:target (E:T) ratio 100:1. Cytotoxicity was measured co-incubating TILs for 4 h with P815 cell line loaded with anti-CD3 (redirected killing; bottom graphs);n= 3, measures were performed in triplicates. (e) Repre-sentative example of p-CREB expression by TILs in untreated culture con-dition or in presence of Ado or ZM 241385 + Ado. (f) Representative example of p-S6 and CD107 expression by TILs stimulated for 3 h by au-tologous tumor cells in untreated culture condition or in presence of Ado or ZM 241385 + Ado. (ZIP 521 kb)
Additional file 2:Table S1.Distribution of memory subsets in total and virus-specific CD8 + T cells.Table S2:Clinical characteristics of the pa-tients. (ZIP 61 kb)
Abbreviations
Ado:Adenosine; AdoR: Adenosine receptor; E:T: Effect:target (ratio); PBMCs: Peripheral blood mononuclear cells; PKA: Protein kinase A; PMA: Phorbol 12-myristate 13-acetate; qRT-PCR: Semiquantitative real-time PCR; REP: Rapid expansion protocol; TCM: T central memory cells; TCR: T cell receptor; TILs: Tumor-infiltrating lymphocytes; TME: Tumor microenvironment
Acknowledgments
We thank the immunomonitoring core team from CTE (Amandine Anastasio, Petra Baumgaertner, Aymeric Auger, and Anne-Christine Thierry) for sharing samples and knowledge and the members of the EU FP7-supported TumAdoR consortium that aims to bring anti-CD73 mAb candidates to clinical testing.
Authors’contributions
data analyses. AI, LD, MV, TT, PJ, TN-N, DS, GV, NG, OD, LK, and GK shared relevant material. SV, BM-G, BNR, CJ, CM-C, CC, P-CH, PR, and AH contributed to the scientific development of the project. SV drafted the manuscript. All authors reviewed the manuscript. All authors read and approved the final manuscript.
Funding
The research leading to these results has received funding from the following:
The European Community’s Seventh Framework Program ([FP7/20013–2018] under grant agreement n°602200). The SNSF project grant (31003A_163204), the Institute for Experimental Cancer Research (26075483), and the Swiss Cancer Foundation (KFS-3949-08-2016) to P.-C.H. The Swisslife foundation project grant (2607011902) to S.V. The SNSF Ambizione grant
(PZ00P3_161459) and the Swiss Cancer Foundation grant (KFS-3710-08-2015) to C.J. and SNSF grant 156469 to P.R.
Availability of data and materials
The data generated and/or analyzed during the current study are available upon reasonable request to the corresponding author.
Ethics approval and consent to participate
Written informed consent was obtained from all healthy subjects and patients, in accordance with the Declaration of Helsinki. Ethics approval for sample collection was given by the University Hospital of Lausanne-CHUV IRB.
Consent for publication
Not applicable.
Competing interests
The authors declare that they have no competing interests.
Author details
1
Department of Oncology, Ludwig Institute for Cancer Research Lausanne, Lausanne University Hospital and University of Lausanne, Lausanne, Switzerland.2Department of Oncology, University of Lausanne, Lausanne, Switzerland.3Department of Pharmacy, University of Naples Federico II, Naples, Italy.4Department of Urology, Urology Research Unit, CHUV, Lausanne, Switzerland.5Department of Visceral Surgery, CHUV, Lausanne, Switzerland.6Department of Immunology Virology and Inflammation, Univ Lyon, Université Claude Bernard Lyon 1, 69008 Lyon, France.7INSERM 1052, CNRS 5286, Centre Léon Bérard, Cancer Research Center of Lyon, Lyon, France.
Received: 14 March 2019 Accepted: 28 August 2019
References
1. Powell JD, Delgoffe GM. The mammalian target of rapamycin: linking T cell differentiation, function, and metabolism. Immunity. 2010;33(3):301–11. 2. DeBerardinis RJ, Lum JJ, Hatzivassiliou G, Thompson CB. The biology of
cancer: metabolic reprogramming fuels cell growth and proliferation. Cell Metab. 2008;7(1):11–20.
3. Araki K, Youngblood B, Ahmed R. The role of mTOR in memory CD8 T-cell differentiation. Immunol Rev. 2010;235(1):234–43.
4. Gubser PM, Bantug GR, Razik L, Fischer M, Dimeloe S, Hoenger G, et al. Rapid effector function of memory CD8+ T cells requires an immediate-early glycolytic switch. Nat Immunol. 2013;14(10):1064–72.
5. Zheng Y, Delgoffe GM, Meyer CF, Chan W, Powell JD. Anergic T cells are metabolically anergic. J Immunol. 2009;183(10):6095–101.
6. Fritz JM, Lenardo MJ. Development of immune checkpoint therapy for cancer. J Exp Med. 2019;216(6):1244–54.
7. Lind DS. Arginine and cancer. J Nutr. 2004;134(10 Suppl):2837S–41S discussion 53S.
8. Munder M. Arginase: an emerging key player in the mammalian immune system. Br J Pharmacol. 2009;158(3):638–51.
9. Chang CH, Qiu J, O'Sullivan D, Buck MD, Noguchi T, Curtis JD, et al. Metabolic competition in the tumor microenvironment is a driver of cancer progression. Cell. 2015;162(6):1229–41.
10. Ho PC, Bihuniak JD, Macintyre AN, Staron M, Liu X, Amezquita R, et al. Phosphoenolpyruvate is a metabolic checkpoint of anti-tumor T cell responses. Cell. 2015;162(6):1217–28.
11. Linden J. Adenosine metabolism and cancer. Focus on "adenosine downregulates DPPIV on HT-29 colon cancer cells by stimulating protein tyrosine phosphatases and reducing ERK1/2 activity via a novel pathway". Am J Physiol Cell Physiol. 2006;291(3):C405–6.
12. Clayton A, Al-Taei S, Webber J, Mason MD, Tabi Z. Cancer exosomes express CD39 and CD73, which suppress T cells through adenosine production. J Immunol. 2011;187(2):676–83.
13. Young A, Ngiow SF, Barkauskas DS, Sult E, Hay C, Blake SJ, et al. Co-inhibition of CD73 and A2AR adenosine signaling improves anti-tumor immune responses. Cancer Cell. 2016;30(3):391–403.
14. Kjaergaard J, Hatfield S, Jones G, Ohta A, Sitkovsky M. A2A adenosine receptor gene deletion or synthetic A2A antagonist liberate tumor-reactive CD8(+) T cells from tumor-induced immunosuppression. J Immunol. 2018; 201(2):782–91.
15. Leone RD, Sun IM, Oh MH, Sun IH, Wen J, Englert J, et al. Inhibition of the adenosine A2a receptor modulates expression of T cell coinhibitory receptors and improves effector function for enhanced checkpoint blockade and ACT in murine cancer models. Cancer Immunol Immunother. 2018;67(8):1271–84. 16. Mediavilla-Varela M, Castro J, Chiappori A, Noyes D, Hernandez DC, Allard B,
et al. A novel antagonist of the immune checkpoint protein adenosine A2a receptor restores tumor-infiltrating lymphocyte activity in the context of the tumor microenvironment. Neoplasia. 2017;19(7):530–6.
17. Cekic C, Linden J. Adenosine A2A receptors intrinsically regulate CD8+ T cells in the tumor microenvironment. Cancer Res. 2014;74(24):7239–49. 18. Ma SR, Deng WW, Liu JF, Mao L, Yu GT, Bu LL, et al. Blockade of adenosine
A2A receptor enhances CD8(+) T cells response and decreases regulatory T cells in head and neck squamous cell carcinoma. Mol Cancer. 2017;16(1):99. 19. Klinger M, Freissmuth M, Nanoff C. Adenosine receptors: G
protein-mediated signalling and the role of accessory proteins. Cell Signal. 2002;14(2):99–108.
20. Raskovalova T, Lokshin A, Huang X, Su Y, Mandic M, Zarour HM, et al. Inhibition of cytokine production and cytotoxic activity of human antimelanoma specific CD8+ and CD4+ T lymphocytes by
adenosine-protein kinase a type I signaling. Cancer Res. 2007;67(12):5949–56. 21. Willingham SB, Ho PY, Hotson A, Hill CM, Piccione EC, Hsieh J, et al. A2AR
antagonism with CPI-444 induces anti-tumor responses and augments efficacy to anti-PD-(L)1 and anti-CTLA-4 in preclinical models. Cancer Immunol Res. 2018;6(10):1136–49.
22. Vigano S, Bellutti Enders F, Miconnet I, Cellerai C, Savoye AL, Rozot V, et al. Rapid perturbation in viremia levels drives increases in functional avidity of HIV-specific CD8 T cells. PLoS Pathog. 2013;9(7):e1003423.
23. Porichis F, Hart MG, Griesbeck M, Everett HL, Hassan M, Baxter AE, et al. High-throughput detection of miRNAs and gene-specific mRNA at the single-cell level by flow cytometry. Nat Commun. 2014;5:5641. 24. Farber DL, Yudanin NA, Restifo NP. Human memory T cells: generation,
compartmentalization and homeostasis. Nat Rev Immunol. 2014;14(1):24–35. 25. Cekic C, Sag D, Day YJ, Linden J. Extracellular adenosine regulates I T cell
development and peripheral maintenance. J Exp Med. 2013;210(12):2693–706. 26. Berger CT, Frahm N, Price DA, Mothe B, Ghebremichael M, Hartman KL,
et al. High-functional-avidity cytotoxic T lymphocyte responses to HLA-B-restricted gag-derived epitopes associated with relative HIV control. J Virol. 2011;85(18):9334–45.
27. Bobisse S, Genolet R, Roberti A, Tanyi JL, Racle J, Stevenson BJ, et al. Sensitive and frequent identification of high avidity neo-epitope specific CD8 (+) T cells in immunotheInaive ovarian cancer. Nat Commun. 2018;9(1):1092. 28. Hershfield MS. New insights into adenosine-receptor-mediated
immunosuppression and the role of adenosine in causing the
immunodeficiency associated with adenosine deaminase deficiency. Eur J Immunol. 2005;35(1):25–30.
29. Wehbi VL, Tasken K. Molecular mechanisms for cAMP-mediated Immunoregulation in T cells - role of anchored protein kinase a signaling units. Front Immunol. 2016;7:222.
30. Linnemann C, Schildberg FA, Schurich A, Diehl L, Hegenbarth SI, Endl E, et al. Adenosine regulates CD8 T-cell priming by inhibition of membrane-proximal T-cell receptor signalling. Immunology. 2009;128(1 Suppl):e728–37. 31. Zheng Y, Collins SL, Lutz MA, Allen AN, Kole TP, Zarek PE, et al. A role for
32. Scholz G, Jandus C, Zhang L, Grandclement C, Lopez-Mejia IC, Soneson C, et al. Modulation of mTOR Signalling triggers the formation of stem cell-like memory T cells. EBioMedicine. 2016;4:50–61.
33. Michalek RD, Gerriets VA, Jacobs SR, Macintyre AN, MacIver NJ, Mason EF, et al. Cutting edge: distinct glycolytic and lipid oxidative metabolic programs are essential for effector and regulatory CD4+ T cell subsets. J Immunol. 2011;186(6):3299–303.
34. Jacobs SR, Herman CE, Maciver NJ, Wofford JA, Wieman HL, Hammen JJ, et al. Glucose uptake is limiting in T cell activation and requires CD28-mediated Akt-dependent and independent pathways. J Immunol. 2008;180(7):4476–86.
35. Cham CM, Gajewski TF. Glucose availability regulates IFN-gamma production and p70S6 kinase activation in CD8+ effector T cells. J Immunol. 2005;174(8):4670–7.
36. Beavis PA, Henderson MA, Giuffrida L, Mills JK, Sek K, Cross RS, et al. Targeting the adenosine 2A receptor enhances chimeric antigen receptor T cell efficacy. J Clin Invest. 2017;127(3):929–41.
37. Hatfield SM, Sitkovsky M. A2A adenosine receptor antagonists to weaken the hypoxia-HIF-1alpha driven immunosuppression and improve immunotherapies of cancer. Curr Opin Pharmacol. 2016;29:90–6. 38. Zhang B. CD73 promotes tumor growth and metastasis. Oncoimmunology.
2012;1(1):67–70.
39. Su Y, Jackson EK, Gorelik E. Receptor desensitization and blockade of the suppressive effects of prostaglandin E (2) and adenosine on the cytotoxic activity of human melanoma-infiltrating T lymphocytes. Cancer Immunol Immunother. 2011;60(1):111–22.
40. Hay CM, Sult E, Huang Q, Mulgrew K, Fuhrmann SR, McGlinchey KA, et al. Targeting CD73 in the tumor microenvironment with MEDI9447. Oncoimmunology. 2016;5(8):e1208875.
41. Buisseret L, Pommey S, Allard B, Garaud S, Bergeron M, Cousineau I, et al. Clinical significance of CD73 in triple-negative breast cancer: multiplex analysis of a phase III clinical trial. Ann Oncol. 2017;29(4):1056–62. 42. Allard B, Longhi MS, Robson SC, Stagg J. The ectonucleotidases CD39 and
CD73: novel checkpoint inhibitor targets. Immunol Rev. 2017;276(1):121–44. 43. Vijayan D, Young A, Teng MWL, Smyth MJ. Targeting immunosuppressive
adenosine in cancer. Nat Rev Cancer. 2017;17(12):765.
44. Bao Y, Ledderose C, Graf AF, Brix B, Birsak T, Lee A, et al. mTOR and differential activation of mitochondria orchestrate neutrophil chemotaxis. J Cell Biol. 2015;210(7):1153–64.
45. Xie J, Ponuwei GA, Moore CE, Willars GB, Tee AR, Herbert TP. cAMP inhibits mammalian target of rapamycin complex-1 and -2 (mTORC1 and 2) by promoting complex dissociation and inhibiting mTOR kinase activity. Cell Signal. 2011;23(12):1927–35.
46. Kim HW, Ha SH, Lee MN, Huston E, Kim DH, Jang SK, et al. Cyclic AMP controls mTOR through regulation of the dynamic interaction between Rheb and phosphodiesterase 4D. Mol Cell Biol. 2010;30(22):5406–20. 47. Sukumar M, Kishton RJ, Restifo NP. Metabolic reprograming of anti-tumor
immunity. Curr Opin Immunol. 2017;46:14–22.
48. Chang CH, Pearce EL. Emerging concepts of T cell metabolism as a target of immunotherapy. Nat Immunol. 2016;17(4):364–8.
49. Mittal D, Sinha D, Barkauskas D, Young A, Kalimutho M, Stannard K, et al. Adenosine 2B receptor expression on cancer cells promotes metastasis. Cancer Res. 2016;76(15):4372–82.
50. Vigano S, Alatzoglou D, Irving M, Menetrier-Caux C, Caux C, Romero P, et al. Targeting adenosine in cancer immunotherapy to enhance T-cell function. Front Immunol. 2019;10:925.
Publisher’s Note