The Role of Wheel Alignment Over the Fatigue Damage
Accumulation in Vehicle Steering Knuckle
K. Reza Kashyzadeh
a, G.H. Farrahi
b,∗, M. Shariyat
c, M.T. Ahmadian
b aSchool of Science and Engineering, Sharif University of Technology, International Campus, Kish Island, Iran.bSchool of Mechanical Engineering, Sharif University of Technology, Tehran, Iran.
cFaculty of Mechanical Engineering, K.N. Toosi University of Technology, Tehran, Iran.
Article info
Article history:Received 04 February 2018 Received in revised form 14 July 2018
Accepted 15 August 2018
Keywords: Fatigue damage Steering knuckle Wheel alignment Camber angle Toe angle
Abstract
The present paper investigates the effect of changes in wheel primary angles such as Camber and Toe angles on the fatigue life of vehicle steering knuckle under multi-input random non-proportional 3D stress components. In order to develop real loading conditions for the steering knuckle, the localizing equivalent road as a combination of some rough roads (ISO road classification B-F for highway out of town, urban highway, urban asphalt, soil road, and flagstone, respectively) based on statistical data collected from different cities by utilizing a general questionnaire including road type and vehicle velocity was considered. Then, the various actual load histories obtained through multi-body dynamics analysis of a full vehicle model were applied on several points of the component. The fatigue life of steering knuckle was predicted by using some prominent multi-axial fatigue criteria for non-proportional loading, rain-flow cycle counting algorithm, and Palmgren-Miner damage accumulation rule. Finally, the effect of different values of wheel angles on the fatigue life of the steering knuckle was examined. The results showed that the highest and lowest fatigue life of steering knuckle are related to the values of 2 positive and negative degrees of camber angle, respectively. The stress level is reduced in the various equivalent load histories by changing the toe an-gle to 0.2 negative, resulting in an increase in the fatigue life of steering knuckle.
Nomenclature
Req Equivalent road t Time
X Road length θ, φ, ϕ Eulerian angles
αi Share of various ISO road classification in percentage
τaf,R=−1 Shear fatigue strength under fully reversed
loading a, b, c, d,
f, k, α, β
Material-dependent parameters σaf,R=−1 Tension-compression fatigue strength
un-der fully reversed loading J2 Second deviatoric stress invariant Nf Number of cycles to failure
K Shear yield stress of the material NO Reference number of loading cycles(2×10⁶)
Si Principle stress components σeq Equivalent stress
σij Stress tensor components σu Ultimate stress of the material
∗Corresponding author: G.H. Farrahi (Professor) E-mail address: Farrahi@sharif.edu
http://dx.doi.org/10.22084/jrstan.2018.15722.1042 ISSN: 2588-2597
σf Tensile yield stress of the material σm Mean stress σn Normal stress acting on a plane σH Hydrostatic stress τa Amplitude of shear stress acting on a plane σH
max Maximum mean hydrostatic stress
Na,eq Equivalent uniaxial normal stress Nm Mean normal stress
1. Introduction
One of the most safety critical components of the ve-hicle which is affected by different loads is the steer-ing knuckle. Establishsteer-ing the connection between drive shaft, steering system, wheel, suspension system, and car chassis is the main task of this part. Therefore, if this piece breaks down, it causes problems in handling and controlling the vehicle. This may lead to irrepara-ble accidents.
This component does not have a particular shape and design. Hence, it can be seen with different capac-ities and materials in various types of vehicles. In addi-tion,the particular positioning of the steering knuckle in the vehicle and maintaining its initial position dur-ing various maneuvers can have a significant effect on the loads that are exerted on several points of the com-ponent. The steering knuckle location is generally ex-amined by two parameters:
1. Reference points, which must be compatible with one another in order to be connected to other vehicle components such as the location of the wheel hub.
2. Wheel angles, recommended by the manufacturer for the stability of the vehicle.
There are several signs to identify the changes occur-ring in wheel angles. One of the most famous indi-cations of these is tire-erosion. Reduced handling is another one of the hallmarks of this issue. In other words, steering wheel must not deviate to the left or right while driving, even if it is released.
There are several reasons for changing the initial wheel angles settings; most notably may refer to the following:
1. High-speed driving on low-quality roads such as soil and flagstone roads removes wheel angles from their initial balance settings.
2. Lack of care in exactly configuring wheel angles by car repairers.
In order to study of the effect of wheel angles on the vehicle behaviors including handling, controlling, sta-bility and dynamic performance, it is necessary to sim-ulate road roughness as the main sources of shocks ex-erted on the vehicle components. Therefore, many re-searchers have tried to identify, measure, and classify it by using different methods.
Sayers et al. have introduced two common methods for measurement of road roughness. One method uses
the topographic camera that records ups and downs of the road directly, and the other uses strain gauges being installed to a vehicle under test operation [1-2]. Then, some road roughness profiles have been recorded for the federal highway organization by using profiler [3]. Gonzalez has presented a new approach to ob-tain road roughness by utilizing accelerometers. The calibration formulas were derived to estimate different types of road roughness by using accelerometer data [4]. Johnson et al. have proposed a time-independent Laplace model to measure road roughness. The model covers both standards of ISO and IRI [5]. In recent years, mobile laser scanning [6] and sensor network of smartphones [7] are used for road roughness detection and monitoring. Choi et al. have used 3D scanning method for obtaining road surface. They focused that the road profile can be changed by erosion and vehicle movements. Thusly, in order to have the accurate ve-hicle tests, it is important to reproduce and repair the road surface [8].
In the last decade, the effect of vehicle velocity on the vehicle dynamic response due to road roughness has been studied. Kashyzadeh et al. have reported wide and narrow band random vibration for low (34Km/h) and high (100Km/h) speed of passenger car, respec-tively. Another research reported white noise for both of low and high speed of heavy vehicles [9]. Barbosa has investigated the vertical and angular modal vehicle dynamic response due to pavement roughness by using PSD function. A huge movement amplification for the first mode of vibration at high speed (120Km/h) has been reported which can damage passenger [10]. The effect of speed on road roughness sensing and pavement performance reduction has also been studied [11-12].
During service time of a vehicle, various multiaxial variable amplitude loadings are exerted on the vehicle body and components. These loading conditions de-pend on various parameters such as driving on road roughness, vehicle speed, driver’s behavior, vehicle set-tings, etc. The nature of these loads is cyclic and can cause fatigue phenomena in vehicle components. Thus, it is necessary to extract the real time history of forces on different critical components by using road rough-ness simulations and multi-body dynamics analysis of a full vehicle model. After that, fatigue analysis should be performed to predict safe servicing time period of all critical components and they can be replaced before they fail. To this end, a few studies have been done in the field of failure of steering knuckle as a highly critical component.
auto-motive steering knuckle made of ductile iron have been investigated. For this purpose, a thick slice was cut off near the fracture part in order to take chemical anal-ysis by Optical Emission Spectroscopy (OES) and op-tical metallography. The Charpy V-notch impact test were performed and the Scanning Electron Microscope (SEM) images were used to topography analysis. Fi-nally, fatigue phenomenon was presented as the main reason of this failure [13]. Sivananth et al. have calcu-lated fatigue life of steering knuckle made of SG iron and aluminum alloy based on stress-life approach [14]. Azrulhisham et al. have evaluated fatigue life reliabil-ity of steering knuckle by utilizing Pearson parametric distribution model [15]. Vivekananda et al. have esti-mated fatigue life of aluminum alloy steering knuckle by using mathematical calculation, applying S-N curve, and different mean stress theories (Goodman, Gerber, and Soderberg) [16]. Bhokare et al. have predicted fa-tigue life of the knuckle arm of a sport vehicle [17]. Far-rahi et al. have investigated fatigue damage of the rear spindle of the vehicle [18]. Shariyat has developed ran-dom fatigue model by modification of Gough’s theory [19]. He has presented a new energy-based equivalent stress criteria for fatigue life determination in compo-nents with complicated geometry under random non-proportional 3D stress fields [20-21]. Fatemi et al. have studied the effect of various parameters of the produc-tion process on the fatigue life of steering knuckle made of forged steel by using experimental [22] and analyt-ical [23] methods. Zoroufi et al. have studied the ex-perimental durability assessment and life prediction of steering knuckles made of different materials including forged steel, cast iron, and aluminum alloy [24].
Recently, physical parameters of the tire have at-tracted the attention of automotive laboratories and research centers because of the role of the tire as the in-terface between road roughness and vehicle parts. The effect of the tire size on the fatigue damage of vehi-cle bodies has been studied by Schon [25] and Angelo [26]. The results showed that the standard tire size, suggested by the automobile manufacturer, caused the least fatigue damage, and increasing tire size led the fatigue damage to increase at the critical points of the vehicle body.
The previous researchers analyzed fatigue life of knuckle under axial constant amplitude loading or proportional multi-axial loading (sinusoidal wave with same phases), and non-proportional multi-axial load-ing (sinusoidal wave with varyload-ing phases) conditions by utilizing Belgian road data. But, in the present pa-per, the fatigue life of steering knuckle is predicted by using some prominent multi-axial fatigue criteria for non-proportional loading. To achieve this purpose, the equivalent road model is provided using statistical data collected from different cities. Subsequently, the most
critical loading conditions for steering knuckle are ob-tained through multi-body dynamics analysis of a full vehicle model during driving on the equivalent road us-ing drivus-ing control based on non-constant speed. For the first time, the effect of two wheel alignment an-gles including Toe and Camber, on the fatigue life of automotive steering knuckle is investigated.
2. Vehicle Driving Simulation
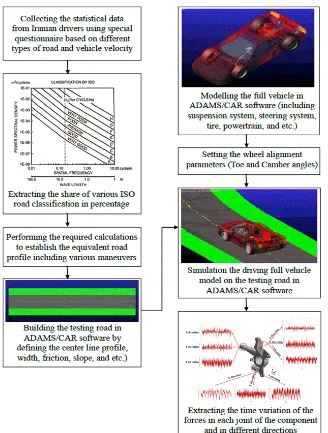
The virtual durability testing is generally specified in three steps, including load history prediction, stress/strain analysis, and fatigue life assessments. In order to perform fatigue assessments, the experienced stress or strain distribution from loading should be known. In this section, the various actual load his-tories exerted on several points of the component were obtained through multi-body dynamics analysis of a full vehicle model. The force histories extraction pro-cess methodology used in this paper is shown in Fig. 1 and each step will be described in the following sec-tions.
2.1. Equivalent Road Profile
A vehicle passes over roads having different surface qualities during its lifetime. Each road causes a cer-tain fatigue damage on automotive components due to the vehicle velocity and various maneuvers such as ac-celeration, braking, etc. Because the quality of roads in different parts of a country, city, or even street is not the same throughout, the best and most accurate way to get the unevenness of a road surface is to obtain an equivalent road profile to estimate loading histories of automotive components..
The International Organization for Standardization (ISO) has proposed a classification of road roughness (A-H) based on spectral density function. Time his-tory of various types of road roughness can be obtained by using Inverse Fast Fourier Transform (IFFT) [27]. In this research, a combination of different types of roughness (ISO road classification B-F for highway out of town, urban highway, urban asphalt, soil road, and flagstone, respectively) is used based on statistical data collected from Iranian car drivers in several cities by utilizing a general questionnaire including road type and vehicle velocity. This combination and its corre-sponding vehicle velocity are indicated in Fig. 2 and Fig. 3, respectively.
The equivalent road is also considered as follows:
Req= (αstright+αbreaking+αacceleration+αcornering)X (1)
Fig. 1. Flowchart of the force histories extraction process.
In this research, braking and acceleration maneu-vers have been neglected since their effects on the fa-tigue damage of automotive components are not signif-icant in comparison with the effects of straight driving [18]. The test road consists of 95% straight driving effects and 5% cornering effects. For straight driving, the following five maneuvers have been considered:
• 102.34km/h on road typeB (αB = 30.3%)
• 66.7km/h on road typeC(αC= 40.4%)
• 36.2km/h on road typeD (αD= 20.6%)
• 18.5km/h on road typeE (αE= 7.1%)
• 4km/h on road typeF (αF = 1.6%)
The fast cornering has been considered for studying cornering effects [18, 28] as it causes more damage com-pared to slow or moderate cornering.
Fast cornering with constant radius 30 meters (50km/h on road type C)
Fig. 3. Vehicle velocity for various roads.
2.2. Details of Full Vehicle Model
The driving full-vehicle model has been simulated in Adams software. A four cylindrical passenger car with a 1500cc and 78hp power engine as well as a 1013kg kerb weight and 1670kg gross weight is simulated. This model consists of several main sub-models such as MacPherson front suspension system, twist beam for rear suspension system, rack and pinion types of steer-ing system, front and rear wheels, body, etc.
The distance between the two lateral axes is 1455mm, and the distance between the rear and front axles is 2415mm. The front spring stiffness isconsid-ered to have a non-linear behavior as shown in Fig. 4. The damper coefficient for the right and left sides
areconsidered as 3105 and 1368N.s/m, respectively.
Fig. 4. Diagram of spring behavior.
The tires are modeled as 175/70/R13 for the present research. The physical properties of the tire are reported in Table 1. Toe and Camber angles are considered as -0.1 and 2 degrees based on the recom-mendation of the manufacturer. The full vehicle model in Adams is illustrated in Fig. 5.
2.3. Loads and Details of the Component
Steering knuckle is a critical component of the vehi-cle. It is made up of cast iron with an ultimate tensile strength of 480MPa (Fig. 6).
Force histories have been extracted in three differ-ent points of steering knuckle including the joint of the
Table 1
Physical properties of tire 175/70/R13.
Parameter Radius Width Wall Mass Area Volume
Unit mm mm mm Kg Square meter Cubic meter
Value 165.1 175 122.5 22.218 1.173 0.033
Table 2
Statistical data of loading histories for Toe angles.
Points of Toe Mean load (N) Min. load (N) Max. load (N)
application angle +0.2 +0.1 0 -0.1 -0.2 +0.2 +0.1 0 -0.1 -0.2 +0.2 +0.1 0 -0.1 -0.2 Joint of the X 320 783 1030 1025 1100 -2094 -368 -333 -352 -345 -51 42 15 17 92 knuckle and the Y 809 399 414 422 420 -160 -719 -962 -944 -1017 59 -49 -4 -2 -61 steering linkage Z 1117 2033 2789 2776 2970 -131 -3921 -3845 -3907 -3869 -303 -233 -77 -116 -81 Joint of X 11333 17861 18302 16879 18180 -379 -798 -1082 -1187 -885 3488 4586 3317 3172 4288 lower Y 1535 1640 1653 1655 1651 -1534 -3681 -3748 -3738 -3736 141 -257 200 184 -173 control arm Z 1942 7241 6246 4274 6356 -2244 -12055 -12261 -10690 -12081 110 -295 296 565 338 Joints of the X -248 572 995 555 551 -13877 -15200 -15499 -5753 -6593 -15415 -6017 -5794 -2398 -6186 knuckle and Y 572 2901 2941 2923 2903 -487 -429 -441 433 -420 -145 402 -119 -104 258 MacPherson strut Z 1394 1506 1508 1510 1515 20 -43 -84 -76 -57 588 612 585 601 630
Table 3
Statistical data of loading histories for Camber angles.
Points of Camber Mean load (N) Min. load (N) Max. load (N) application angle +2 +1 0 -1 -2 +2 +1 0 -1 -2 +2 +1 0 -1 -2 Joint of the X 1025 630 584 418 420 -352 -369 -655 -933 -1301 17 -17 -15 -32 -28 knuckle and the Y 422 452 529 807 1062 -944 -741 -547 -396 -302 -2 21 24 35 46 steering linkage Z 2776 2222 2288 1911 1590 -3907 -3887 -4322 -4635 -4750 -116 -156 -169 -259 -254 Joint of X 16879 17878 17259 16745 16330 -1187 -1027 -1030 -939 -915 3172 3614 3548 3205 3232 lower Y 1655 1684 683 1657 1669 -3738 -3669 -3516 -3428 184 196 -528 211 287 control arm Z 4274 6142 6512 6490 5863 -10690 -12720 -13186 -13555 -13904 -565 340 105 42 1 Joints of the X 555 482 913 878 909 -6593 -7753 -15498 -15521 -15487 -2398 -2843 -5740 -5692 -5771 knuckle and Y 2923 2695 2916 2928 2899 -433 -445 -452 -451 -435 -104 -135 -128 -125 -200 MacPherson strut Z 1510 1508 1504 1499 1400 -76 -83 -84 -62 -77 601 572 571 587 576
knuckle and the steering linkage, joint of the lower con-trol arm, and joints of the knuckle and MacPherson strut. These loading conditions are demonstrated in Fig. 7. The wheel hub is considered to be fixed in all degrees of freedom (DOF).
Below, different loading histories for various values of Toe and Camber angles are obtained. Statistical data of obtained conditions versus angle changes are reported in Tables 2 and 3.
Fig. 6. Front steering knuckle in driver’s side of a four cylindrical passenger car.
Fig. 7. Loading conditions for different points of the steering knuckle.
3. Fatigue Assessment
The transient stress analysis was performed to de-termine the critical points of failure for the steering knuckle. The finite element results indicated that the joint of the knuckle and the steering linkage is the most critical region (see Fig. 8).
Time histories of 3D stress components were ex-tracted for critical elements. Then, equivalent stress was calculated by using different criteria for multi-axial non-proportional loadings. The considered fatigue cri-teria are presented in the following sub-sections.
Fig. 8. Distribution of Von-Misses stress for steering knuckle and determining critical region.
3.1. Brief Overview of the Theoretical Founda-tions of the Considered Fatigue Theories
and enable the use of cycle counting methods. Some of these criteria, as well as some recently proposed cri-teria, are presented in this study.
3.1.1. Von-Misses Criterion
Von-Misses criterion may be expressed as:
J2=K2 (2)
WhereJ2andkare the second deviatoric stress
invari-ant and the shear yield stress of the material, respec-tively. For a 3D stress field, one may write:
J2=
1
2sijsji= 1 2tr(s
2) =1
2(s
2 1+s
2 2+s
2 3)
J2=
1
2sijsji= 1 2tr(s
2) =1
2(s
2 1+s
2 2+s
2 3)
(3)
J2=
1
6[(σ11−σ22)
2+ (σ
22−σ33)2
+ (σ33−σ11)2] + [(σ12)2+ (σ23)2+ (σ31)2]
(4)
and
K= √σf
3 (5)
whereσf is the uniaxial tensile yield stress of the ma-terial.
3.1.2. Findley Criterion
Findley has proposed that fatigue failure occurs when the superposed magnitudes of the normal stress and fluctuation amplitude of the shear stress acting on a plane, become equal to τaf,R=−1. Its original form is
[29]:
(τa+Kσn)max (θ,φ,ϕ)=f (6)
The Findley constants,K andf are defined as [29]:
K= 2−(σR=−1
/
τR=−1)
2 √
(σR=−1
/
τR=−1)−1]
(7)
f =
√
(σR=−1)2
4[(σR=−1
/
τR=−1)−1
] (8)
By substituting the defining constants as above and simplifying the Findley criterion, it will be as follows:
σeq=
v u u u
t (4Σ−4)C
2
a+ (2−Σ)2Nmax2
+(4Σ−√4)(2−Σ)
Σ−1 CaNmax
(9)
The critical plane is defined as the maxθ,φ,ϕ,t(τa + Kσn), whereθ,φ, andϕare the Eulerian angles and t denotes the time.
A modified Findley’s criterion has been presented by Shariyat [19]. This new approach has shown better
results in comparison with the experimental data for the anti-roll bar of a passenger car. The new form of this criterion is expressed as [19]:
τeq = max θ,φ,ϕ,t
τa+kσn
√
1 +k2
τaf,R=−1
τaf,R
=τaf,R (10)
3.1.3. MacDiarmid Criterion
According to the MacDiarmid Fatigue Criterion, the critical plane is a plane wherein the maximum shear stress amplitude occurs. The original form of this cri-terion can be expressed as follows [29]:
τa+K(σn)maxτ(t)=f (11)
The MacDiarmid constants, K and f are defined as [29]:
K= (τf)AorB
2σu (12)
f = (τf)AorB (13) whereσu is the ultimate strength of the material and A or B subscripts denote the surface or depth crack propagation concepts introduced by Brown and Miller. This criterion can be rewritten by substituting original model with the defined constants:
τeq= 2σuτa 2Σσu−(σn)maxτ(t)
(14)
Recently, Shariyat has proposed a modification form of this criterion that is more accurate than original form when order of the normal stress is much higher than of the shear stress [19]:
τeq=
[
τa+
√
1 +K2
K (σn)maxτ(t)
]
·τaf,R=−1
τaf,R (15)
And
K= 2τaf,R−σaf,R
σm+σaf,R (16)
whereσm is the mean stress.
3.1.4. Dang Van Criterion
Dang Van has presented a new approach based on Sines idea and applying hydrostatic stress(σH). The effect of hydrostatic stress has been included into the equiv-alent stress definition [29]. According to this criterion, a plane on which the following expression holds first is a critical plane.
τa+ασmaxH =τR=−1 (17)
where σH
max is the maximum mean hydrostatic stress
and the parametersαand Σare defined as [29]:
α= 3
(
Σ−1−1 2
)
(18)
Σ = σR=−1 τR=−1
3.1.5. Carpinteri-Spagnoli (C-S) Criterion
Carpinteri and Spagnoli (C-S) have proposed a new fa-tigue criterion that was originally an extension of von Misses criterion (for a 2D stress field with one tensile and one shear stress components). It can transform the multiaxial non-proportional stresses into an equivalent uniaxial normal stress which can be written as follows [30, 31]:
σa,eq=
√
N2
a,eq+
(
σaf,R=−1
τaf,R=−1
)2
C2
a =σaf,R=−1 (20)
Na,eq=Na+σaf,−1
(
Nm σu
)
(21)
whereNmandNaare the mean and amplitude normal stress, respectively(Nmax=Nm+Na). AndCa is the
amplitude of shear stress. Theσaf,R=−1andτaf,R=−1
are the tension-compression and shear fatigue limits which can be determined by using Basquin-type rela-tions [32]:
σaf,R′ =−1=σaf,R=−1
( Nf N0 )m (22) And
τaf,R′ =−1=τaf,R=−1
(
Nf N0
)m∗
(23)
where σaf,R′ =−1 andτaf,R′ =−1 are the fatigue strength for fully reversed normal and shear stresses at finite life (Nf), respectively. AndN0 is the reference number of
loading cycles, e.g. 2×10⁶ for both cases. Recently, the effects of critical plane orientation on the multi-axial high cycle fatigue assessment have been studied and the modification form of C-S criterion has been presented [31].
3.1.6. Liu-Zenner Criterion
Liu-Zener criterion considers and distinguishes be-tween effects of the tensile and compressive mean stresses and is calibrated based on the 1D fatigue strengths considering the actualRratio [19]:
σa,eq =√aτ2
a+bσa2+cτm2 +dσ2m=σaf,R=−1 (24)
where [19]:
a= 1 5{3Σ
2−4} (25)
b=2 5{3−Σ
2} (26)
c=7 4
{(
2σaf,R=−1
τaf,R=0
) −Σ2
}
(27)
d= 7 5
{
2Σσaf,R=−1−
σaf,R=0
2
(
1 + 4c 21
)}
(28)
3.1.7. Shariyat Criterion
Shariyat has presented some new criteria to assess the equivalent stress adequate for non-proportional ran-dom loadings. The validation of these new criteria has been done by comparison with the experimental results for an anti-roll bar of a commercial vehicle. He has proposed a new form of the equivalent stress by using fatigue strength values which can be determined using S-N-P and T-N-P diagrams incorporating the ef-fect of mean stress. This criterion can be described as [19-21]:
[σ(t)]eq (σmax)R
=
{
1 2
([
σx(t) (σmax)Rx−
σy(t) (σmax)Ry
]2
+
[
σy(t) (σmax)Ry −
σz(t) (σmax)Rz
]2
+
[
σz(t) (σmax)Rz −
σx(t) (σmax)Rx
]2
+ 2
([
τxy(t) (τmax)Rxy
]2
+
[
τxz(t) (τmax)Rxz
]2
+
[
τyz(t) (τmax)Ryz
]2))}1 2
(29)
where:
(σmax)Rij= (σm)ij+
(σf,R=−1)ij
(
Nσij
N0
)b[
1−(σm)ij σu
]
, i, j=x, y, z (30)
Recently, he has proposed new Energy and Integral ap-proaches which have complex calculations [20, 21]. In the proposed energy-based approach, the effect of hy-drostatic stress has been considered as sign function on the fatigue failure. It can be expressed as [20]:
σeq(t) =α
v u u u u u t
(σx(t)−σy(t))2+ (σy(t)−σz(t))2
+(σz(t)−σx(t))2
+6((τxy)2+ (τxz)2+ (τyz)2)
+βσh(t)
(31) where α= √ 2 2 (32)
β= 3
√3Σ
(
1−σm σu
)
(
1−τm τu
) −1
(33)
σa,eq=
1−R
2
(
1−σeq,m σu
)×
v u u u u u u u u u t
3 8π
∫ 2π θ=0
∫ π φ=0
{
3Σ2(1−σθφ,m
/
σu)2 (1−τθφ,m
/
τu)2
−4
}
τ2
θφ
{
6−2Σ2(1−σθφ,m
/
σu)2 (1−τθφ,m
/
τu)2
}
σ2
θφ,m
sinφ.dφ.dθ (34)
The equivalent stress histories are calculated us-ing the stress tensor components in the critical region and the various criteria described above. The behav-ior of these stress histories is random and depends on the parameters of road roughness, vehicle velocity, and various maneuvers. Therefore, it is not possible to di-rectly compare the stress histories. Nevertheless, the best technique to compare the equivalent stress histo-ries is to study statistical parameters such as mean and deviation values. The mean and the deviation parame-ters are simultaneously shown in Figure 9 for different criteria by utilizing probabilistic distribution of stress. The fatigue life of the component can be predicted qualitatively using this data. But, fatigue analysis should be performed to assess quantitatively the life of the automotive steering knuckle. As it is clear from the Fig. 9, the mean and the deviation values are similar for some criteria (e.g, Dang Van, Shariyat, Liu-Zenner, Energy approach, and Modified MacDiarmid). Hence, it is expected to be similar the life of knuckle using these criteria.
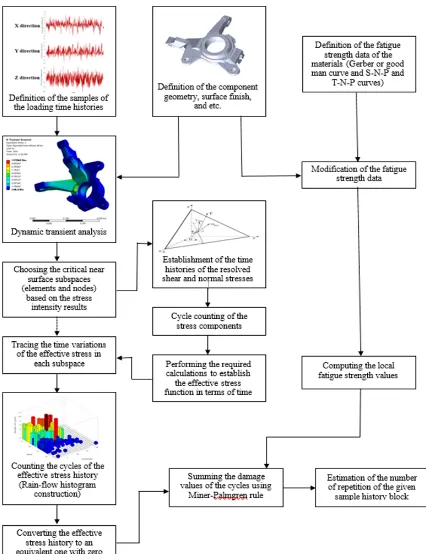
Fatigue life of steering knuckle has been estimated by utilizing rain-flow cycle counting technique (Nies-lony Matlab Coding [33]) and Palmgren-Miner damage accumulation law. Fatigue life assessment algorithm used in the present research is summarized in Fig. 10 and the obtained fatigue lives of steering knuckle garding the original Toe and Camber angles are re-ported in Table 4.
The lowest fatigue life has been predicted by using
Liu-Zenner criterion for automotive steering knuckle made of ductile cast iron. In the other words, this cri-terion is more cautious than other criteria in this case.
Table 4
Fatigue life of steering knuckle under multi-axial non-proportional loadings caused by maneuvers on proving ground.
Type of the equivalent fatigue stress
Fatigue life (million cycles)
Von Misses 5.0074
Findley 4.1818
Dang Van 3.8945
MacDiarmid 4.114
Carpinteri-Spagnoli 4.3176
Shariyat 3.4206
Liu-Zenner 3.2179
Energy Approach by Shariyat 3.8289 Modified Findley 4.0462 Modified MacDiarmid 3.9698
4. Results
Fatigue analysis for each wheel angle was conducted according to the data in Tables 2 and 3. To compare the results, the main model was considered as proposed by the car manufacturer (the Toe angle is 0.1 and the Camber angle is +2). The results of fatigue life pre-dicted for the main model are reported in Table 4. In this section, the results of all cases of Camber and Toe angles are shown in Figs. 11 and 12, respectively.
Fig. 10. Fatigue life assessment algorithm used in the present research.
According to the results obtained by utilizing the fatigue life assessment algorithm mentioned in section 3, visualized in Fig. 11, the fatigue lives of steering knuckle based on all considered criteria are greater when a bigger value of Camber angle is used. An av-erage increase of 12% was found for fatigue life of the component when using a Camber angle equal to +2 instead of a positive value of 1 degree. Likewise, the
Fig. 11. Fatigue life of steering knuckle for several different Camber angles.
Fig. 12. Fatigue life of steering knuckle for several different Toe angles.
5. Conclusions
In the present research, the effect of wheel alignment on the fatigue life of automotive steering knuckle (a super critical component with a complicated geometry under multi-point 3D random inputs) was studied. In order to predict fatigue life of the component, the ve-hicle driving simulation was utilized. The equivalent road has developed as a combination of some rough events based on statistical data collected from differ-ent cities. The various actual load histories obtained through multi-body dynamics analysis of a full vehicle model were applied on connecting joints of the com-ponent. Finally, the fatigue lives of steering knuckle related to the different values of Toe and Camber an-gles were predicted by using the fatigue life assessment algorithm mentioned in section 3. The following con-clusions can be drawn from this study:
1. The joint of the knuckle and the steering link-age is reported as the most critical region and the maximum value of Von-Misses stress in the critical area was estimated about 108MPa.
2. The lowest fatigue life has been predicted by us-ing Liu-Zenner criterion for automotive steerus-ing
knuckle made of ductile cast iron with original wheel angles. In the other words, this criterion is more cautious than other criteria in this case.
3. The maximum and minimum fatigue lives of the steering knuckle are related to Camber angles equal to +2 and -2 degrees, respectively. Fur-thermore, the results illustrated that the fatigue life of knuckle decreases by reducing the value of Camber angle. Specifically, it was indicated that the Camber angle suggested by the vehicle manufacturer is the most appropriate mode.
4. An average increase of 12%was found for fatigue life of component when using a Camber angle equal to +2 instead of a positive value of 1 de-gree.
6. To have a safe car, it is necessary to periodically review the wheel angles of the vehicle and adjust them appropriately.
References
[1] M.W. Sayers, T.D. Gillespie, C.A.V. Queiroz, The International Road Roughness Experiment, The In-ternational Bank for Reconstruction and develop-ment, Washington, (1986).
[2] M.W. Sayers, T.D. Gillespie, W.D.O. Paterson, Guidelines for Conducting and Calibrating Road Roughness Measurements, The International Bank for Reconstruction and Development, Washington, (1986).
[3] M.W. Sayers, S.M. Karamihas, Interpretation of Road Roughness Profile Data, Prepared for Fed-eral Highway Administration Contract DTFH 61-92-C00143, (1996).
[4] A. Gonzalez, E.J. Óbrien, Y. Li, K. Cashell, The use of vehicle acceleration measurements to esti-mate road roughness, Vehicle. Sys. Dyn., 46(6) (2008) 483-499.
[5] P. Johannesson, I. Rychlik, Modelling of road pro-files using roughness indicators, Int. J. Veh. Des., 66 (2014) 317-346.
[6] P. Kumar, E. Angelats, An Automated Road Roughness Detection from Mobile Laser Scanning Data, The International Archives of Photogramme-try, Remote Sensing and Spatial Information Sci-ences, ISPRS Hannover Workshop, Hannover, Ger-many, 6-9 June (2017).
[7] R. Kumar, A. Mukherjee, V.P. Singh, Community sensor network for monitoring road roughness using smartphones, J. Comput. Civil. Eng., 31(3) (2017) 04016059-1-110.
[8] M. Choi, M. Kim, G. Kim, S. Kim, S.C. Park, S. Lee, 3D scanning technique for obtaining road sur-face and its applications, Int. J. Pr. Eng. Manuf., 18(3) (2017) 367-373.
[9] K. Reza Kashyzadeh, M.J. Ostad-Ahmad-Ghorabi, A. Arghavan, Study effects of vehicle velocity on a road surface roughness simulation, Appl. Mech. Mater., 372 (2013) 650-656.
[10] R.S. Barbosa, Vehicle dynamic response due to pavement roughness, J. Braz. Soc. Mech. Sci. Eng., 30(3) (2011) 302-307.
[11] B. GoenagaSilvera, L.G. Fuentes, O. Mora, Effect of Road Roughness and Vehicle Speed on Dynamic
Load Prediction and Pavement Performance Re-duction, Transportation Research Board 96th An-nual Meeting, Washington DC, United States, 8-12 January (2017).
[12] G. Alessandroni, A. Carini, E. Lattanzi, V. Fres-chi, A. Bogliolo, A Study on the Influence of Speed on Road Roughness Sensing: The Smart Road Sense Case, Sens., 17(2) (2017) 305-325.
[13] G. Triantafyllidis, A. Antonopoulos, A. Spiliotis, S. Fedonos, D. Repanis, Fracture characteristics of fatigue failure of a vehicle’s ductile iron steering knuckle, J. Fail. Anal. Prev., 9(4) (2009) 323-328.
[14] V. Sivananth, S. Vijayarangan, Fatigue life anal-ysis and optimization of a passenger car steering knuckle under operating conditions, Int. J. Auto. Mech. Eng., 11(1) (2015) 2417-2429.
[15] E. Azrulhisham, Y. Asri, A. Dzuraidah, N. Ab-dullah, C. Hassan, A. Shahrom, Evaluation of fa-tigue life reliability of steering knuckle using Pear-son parametric distribution model, Int. J. Qual. Stat. Reliab., 2010 (2010) 1-8.
[16] R. Vivekananda, A.V. Mythra Varun, Finite el-ement analysis and optimization of the design of steering knuckle, Int. J. Eng. Res., 4(1) (2016) 121-135.
[17] K.S. Bhokare, G.M. Kakandikar, S.S. Kulkarni, Predicting the fatigue of steering knuckle arm of a sport utility vehicle while developing analytical techniques using CAE, Int. J. Sci. Res. Manag. Std., 1(11) (2013) 372-381.
[18] G.H. Farrahi, A. Khalaj, Estimation of fatigue damage caused by actual roads and maneuvers on proving ground, J. Achiev. Mater. Manuf. Eng., 14(1-2) (2006) 90-96.
[19] M. Shariyat, A fatigue model developed by modification of Gough’s theory, for random non-proportional loading conditions and three-dimensional stress fields, Int. J. Fatigue., 30(7) (2008) 1248-1258.
[20] M. Shariyat, Three energy‐based multiaxial HCF criteria for fatigue life determination in components under random non‐proportional stress fields, Fa-tigue. Fract. Eng. Mater. Struct., 32(10) (2009) 785-808.
[22] M. Zoroufi, A. Fatemi, Durability Comparison and Life Predictions of Competing Manufactur-ing Processes: An Experimental Study of SteerManufactur-ing Knuckle,the 25th Forging Industry Technical Con-ference, Detroit, (2004).
[23] A. Fatemi, M. Zoroufi, Fatigue Performance Eval-uation of Forged versus Competing Manufacturing Process Technologies: A Comparative Analytical and Experimental Study, American Iron and Steel Institute, Toledo, (2004).
[24] M. Zoroufi, A. Fatemi, Experimental durability assessment and life prediction of vehicle suspen-sion components: a case study of steering knuck-les, Proc. Inst. Mech. Eng. D J. Automob. Eng., 220(11) (2006) 1565-1579.
[25] C.G.E. Schon, C.M. Angelo, F.A.C.E. Machado, The role of tire size over the fatigue damage ac-cumulation in vehicle bodies, 20th European Con-ference on Fracture, Procedia Mater. Sci., 3 (2014) 331-336.
[26] C.M. Angelo, F.A.C.E. Machado, C.G.E. Schon, Influence of tire sizes over automobile body spec-trum loads and fatigue damage accumulation, Mater. Des., 67 (2015) 385-389.
[27] J.Y. Wong, Theory of ground vehicle book, Third Edition, University of Ottawa, Wiley Interscience (2001).
[28] J. Marzbanrad, A. Hoseinpour, Structural opti-mization of MacPherson control arm under fatigue loading, Teh. Vjesn., 24(3) (2017) 917-924.
[29] D. Socie, G. Marquis, Multiaxial Fatigue, 1st Edi-tion, USA: Society of Automotive Engineers SAE International, (2000).
[30] A. Carpinteri, A. Spagnoli, S. Vantadori, Multi-axial fatigue assessment using a simplified critical plane-based criterion, Int. J. Fatigue., 33(8) (2011) 969-976.
[31] A. Carpinteri, C. Ronchei, D. Scorza, S. Vanta-dori, Critical plane orientation influence on mul-tiaxial high-cycle fatigue assessment, Phys. Me-somech., 18(4) (2015) 348-354.
[32] M. Shariyat, Automotive Body: Design and Anal-ysis, First Edition, K.N. Toosi University Press, Iran, (2006).