__________
* Corresponding author
E-mail addresses:hrasti@ut.ac.ir(H.Rastiveis);niloofar.zahraee@ut.ac.ir(N. Zahraee);arash.jouybari@hig.se(A. Jouybari) DOI: 10.22059/eoge.2019.278307.1046
12 ABSTRACT
Earthquakes are known as one of the deadliest natural disasters that have caused many fatalities and homelessness through history. Due to the unpredictability of earthquakes, quick provision of buildings damage maps for reducing the number of losses after an earthquake has become an essential topic in Photogrammetry and Remote Sensing. Low-accuracy building damage maps waste the time that is required to rescue the people in destructed areas by wrongly deploying the rescue teams toward undamaged areas. In this research, an object-based algorithm based on combining LiDAR raster data and high-resolution satellite imagery (HRSI) was developed for buildings damage detection to improve the relief operation. This algorithm combines classification results of both LiDAR raster data and high-resolution satellite imagery (HRSI) for categorizing the area into three classes of “Undamaged,” “Probably Damaged,” and “Surely Damaged” based on the object-level analysis. The proposed method was tested using Worldview II satellite image and LiDAR data of the Port-au-Prince, Haiti, acquired after the 2010 earthquake. The reported overall accuracy of 92% demonstrated the high ability of the proposed method for post-earthquake damaged building detection.
S
KEYWORDS
Earthquake
Building DamageDetection
High-Resolution Satellite Image (HRSI)
LiDAR
1. Introduction
Natural disasters such as floods, cyclones, hurricanes, landslides, forest fire, and earthquake have deadly effects when they occur in populated areas. Among these natural disasters, earthquakes, with the most significant number of fatalities and also posing severe threats to urban areas, are considered as the most destructive events (Bartels & VanRooyen, 2012; Ranjbar et al., 2018).
After an earthquake, rapid assessment of damaged areas through quick damage identification and determining the amount of collapsed buildings in affected areas provides essential information for initiating emergency response actions and reconstruction (Schweier et al., 2004; Vetrivel et al., 2015). The assessment process is practical through applying geospatial data such as high-resolution satellite/aerial images, LiDAR point clouds, or existing vector maps, which are available for almost all cities. In this case, wide-coverage, rapid access, and improved spatial
resolution of satellite images have made this kind of data the primary data source for damage assessment. Therefore, various methods have been developed for damage detection based on multi-temporal satellite images which confirm the effectiveness of Remote Sensing techniques in damage assessment (Corbane et al., 2011; Yamazaki et al., 2004).
Many types of researches are conducted on both pre- and post-event satellite images based on categorizing the differences in the state of a building, by observing at different times. In this case, most of the studies have used classification techniques such as Fuzzy Decision Making System, Artificial Neural Network (ANN), support vector machine (SVM), etc. (Moya et al., 2019; Ranjbar et al., 2018; Endo et al., 2018; Janalipour & Taleai, 2017; H Rastiveis et al., 2013; Janalipour & Mohammadzadeh, 2016; Chini et al., 2011; Li et al., 2009). Moreover, some of the studies have used other methods such as edge information, image rationing, image differences, principal component analysis,
w e b s i t e : h t t p s : / / e o g e . u t . a c . i r
Combination of
p
ost-earthquake LiDAR data and satellite imagery for
buildings damage detection
,NiloofarKhodaverdiZahraee1Heidar Rastiveis1*, Arash Jouybari2
1 Department of Photogrammetry and Remote Sensing, School of Surveying and Geospatial Engineering, University of Tehran, Iran 2 Faculty of Engineering and Sustainable Development, Department of Computer and Geospatial sciences, University of Gävle, Sweden
Article history:
13 etc. (Xiao et al., 2016; Miura et al., 2011; Ma & Qin, 2012;
Sirmacek & Unsalan, 2009).
Multi-spectral images present shadows, building displacement problems, and also the reference pre-event images may not always be available (Vu et al., 2004). Therefore, many studies work on building damage assessment based on only post-event data. LiDAR data, which provides information of height, has also been recommended in many studies to resolve these problems (Meng et al., 2009; Moya et al., 2018; Tran et al., 2018; Vetrivel et al., 2015). Although LiDAR is capable of providing precise height information in poor illumination, or through clouds and smoke, it is challenging to interpret damaged buildings from post-earthquake LiDAR data alone without 3D building information from GIS databases or spectral information of satellite images.
Auxiliary data, such as building vector maps, has been used besides the LiDAR data as a priori knowledge in many studies to identify the disappeared damage in LiDAR data and to improve the accuracy of building damage detection (Rodríguez et al., 2019; Vu et al., 2004; Janalipour &
Mohammadzadeh, 2018; H. Rastiveis et al., 2018). However,
this data is not always available, or it may be outdated, so most of the studies integrate the LiDAR data and images by employing the spectral information of satellite images as well as the height information of LiDAR data for detecting the collapsed buildings (Huang et al., 2007; Dong & Guo, 2012; Trinder & Salah, 2012; Zhou et al., 2018). It is
provide would
combination
expected that this more
in detection promising results in building damage
comparison to merely using one dataset.
Based on previous studies, researchers widely used both pre-event and post-event data for building damage detection. However, pre-event data may not always be available or
updated. For this reason, some of the studies used only post-event data such as LiDAR data or SAR image, but the reported accuracies were not high. Therefore, the main objective of this study is specifying the damaged buildings with high accuracy based on decision level fusion of post-event satellite image and post-post-event LiDAR data. This approach uses the geometrical analysis besides the textural and spectral analysis. Also, the damaged buildings are detected by combining the classification results of satellite image and LiDAR data. Finally, the damaged area is divided into two classes of “Surely Damaged” and “Probably Damaged” to determine where the first responders and rescue team should be sent. According to this categorization, the first responders or rescuers will be sent to “Surely Damaged” regions.
This paper is organized into four sections. After the introduction, a description of the proposed method for building damage detection is given in Section 2. Then, the experimental area and data are explained in Section 3. After presenting and discussing the implementation results in Section 4, finally, Section 5 concludes the paper.
2. Proposed method
The flowchart of the proposed method is summarized in Figure 1. As shown in this figure, in order to prepare the input data for building damage detection, the acquired LiDAR data and high-resolution satellite imagery (HRSI) of the post-earthquake are pre-processed and analyzed. Then, both of them are divided into several homogeneous segments using the multi-resolution segmentation technique. After that, two segmented datasets are classified based on the appropriate features and selected training samples. Finally, the classification results are compared, and building damage map is achieved in three classes of “Surely Damaged” and “Probably Damaged”, and “Undamaged”.
14
2.1. Pre-processing
In the pre-processing step, first, the LiDAR point cloud is converted into image format based on the height information of these points. This process can be performed using an interpolation technique such as nearest neighbor or bilinear. This image, which is usually called the Digital Surface Model (DSM), should be registered to the satellite image using multiple control points. Moreover, histogram equalization of the HRSI should be performed to contrast the adjustment of both images.
2.2. Segmentation
The target of segmentation is to generate meaningful objects as an image analysis unit. This step is one of accurate steps in object-based building damage detection, which is mostly used in the field of pattern recognition (Haralick & Shanmugam, 1973; Ivits & Koch, 2002). There are several groups such as point-based, edge-based, and region-based segmentation techniques that can be applied in this step (Ivits & Koch, 2002). However, due to the high ability of multi-resolution segmentation, this method is applied in the proposed algorithm.
Multi-resolution segmentation is a bottom-up segmentation algorithm based on a pairwise region-merging technique, which minimizes the average heterogeneity for a given number of image-objects, and maximizes their corresponding homogeneity. It starts with a one-pixel object and merges each pair wisely with neighboring objects to form larger objects until the homogeneity thresholds are reached. These homogeneity thresholds are controlled by the scale parameter, which influences the size of output segments (Benz et al., 2004; Definiens, 2012). Other segmentation parameters including color/shape and smoothness/compactness should carefully be detected. In this paper, the mathematical background and details of the multi-reolution segmentation are not discussed, and readers are referred to (Benz et al., 2004) for more additional information.
2.3. Feature extraction
In image analysis, features or descriptors are meaningful information which describes the image, and usually include statistical, textural, and structural characteristics of image-objects (Definiens, 2012). Since selecting features may lead to different classification results, it is a critical step in the damage detection process. Therefore, any nonfeasance in feature selection may cause unfavorable errors in the final results (Rezaeian, 2010; H Rastiveis et al., 2013).
In addition to the spectral information as a feature vector, many studies have applied textural features to separate damaged areas (Janalipour & Mohammadzadeh, 2016; H Rastiveis et al., 2013). In pixel-based image analysis, spectral and textural features are popular; however,
geometrical features are also useful in object-based image analysis. Therefore, in the proposed method, textural, geometrical, and spectral features are applied for damage assessment. Here, a good feature is the one that draws a clear distinction between undamaged and damaged image-objects. For this purpose, several features are extracted for all image-objects on both DSM and HRSI through the numerical interpretation of several features. It should be considered that numerical interpretation for each image-object is performed using the equation of features shown in Table 1.
Textural Features: There is no absolute definition of textural features, but in general, it investigates the coarseness, smoothness, uniformity, or density of the image. A simple and popular method for texture analysis is the computation of Gray-Level Co-occurrence Matrices (GLCM). GLCM is a matrix that contains the number of each grey level pairs, which are located at distance d and direction
θ from each other (Haralick & Shanmugam, 1973). Calculating this matrix provides several measures such as Homogeneity, Entropy, Correlation, etc. as textural features. Table 1 illustrates seven implemented GLCM-based textural features in this study.
Geometrical features: These features are calculated based on the geometrical properties and the shape of the extracted image objects (Definiens, 2012). Various geometrical features can be extracted for each image object. In this study, Density, Compactness, and Asymmetry are three applied geometrical features for damage map generation.
Spectral features: Spectral features can be measured from the grey value of the pixels inside each image object (Definiens, 2012). In this study, Brightness is applied as the only spectral feature, which is shown along with other textural and geometrical features in Table 1. In this table, i,j
are the row and column number; Pi,j is the normalized value in the cell i,j; N is the number of rows or columns; μi,j is the GLCM mean; σi,j is the GLCM standard deviation; wKBis the brightness weight of image layer k; K is the number of image layers k used for calculation; cK( )v is the mean intensity of
image layer k of image-object v;
1,2,3
is eigenvalue 1, 2 and 3 of a 3D image object v; and Vv is the volume of image object.
15 Table 1. Applied textural, geometrical, and spectral features
in the proposed method for building damage detection.
Num. Feature Equation
1
GLCM-Homogeneity
1 ,
2
, 01 ( )
N i j i j p i j
2 GLCM-Entropy
1
, ,
, 0
( ln ) N
i j i j
i j p p
3 GLCM-Correlation 1 , , 2 , 0 , , ( , )( ) ( )( ) N
i j j i j
i j
i j i j
i j
p
4GLCM-Contrast 1
2 , , 0 ( ) N i j i j
p i j
5 GLCM-standard. Deviation 1 2 , , , , 0 ( , ) Ni j i j i j i j
P i j
6 GLCM-Angular. 2nd Moment 1 2 , , 0 ) ( N i j i j p
7 Geometry-Density 1 ( ) ( )
v
p
Var Var Y
8
Geometry-Compactness
1,2,3 2 3
2 2 2
v V 9 Brightness 1 1 ( ) ( ) K B K K B K
c v w c v
w
10 Geometry
-Asymmetry min
max
1
2.4. Classification
This is a critical phase in building damage detection process and can be affected by many factors such as the algorithm, pre-processing, appropriate training samples or feature extraction (Bai et al., 2017; Bakhary et al., 2007). Given that the main objective of this research is to provide an efficient method to integrate the classification results, different classification methods can be used in this step. However, the supervised k-nearest neighbor (K-NN) classification algorithm, due to its simplicity, popularity, and effectivity, is implemented on both segmented images.
The K-NN is a non-parametric classifier widely used for classification and regression (Ivits & Koch, 2002), and rules by a majority vote of its k nearest (in Euclidean distance) neighbors (Duda, 2001). In this study, the sample image-objects (training data), described by extracted features from the previous step, are sorted and labeled into four classes of “Building,” “Debris,” “Tree,” and “Ground” on both HRSI and DSM. In the next step, the Euclidean distances from all samples to the unlabeled image-object are computed, and k closest samples are selected. Finally, by considering the unlabeled image-objects into the particular class with the maximum number of nearest neighbors, each image-object is labeled as “Building,” “Debris,” “Tree,” or “Ground”. In the next step, the resulting classified maps are compared to generate the final damage maps.
2.5. Damage Assessment
In this step, by comparing two independent classified images in the previous step, damaged buildings are detected.
Due to many limitations of each classified image, here, a pixel-by-pixel comparison of two classified images is performed to achieve a more promising result. In this case, a pixel would be labeled as “Surely Damaged”, if its label on both of the classified images is “Debris”. On the other hand, if only one of the classified images labels the pixel as “Debris”, that pixel would be “Probably Damaged”. In other case, the pixel would be known as “Undamaged”.
3. Study Area
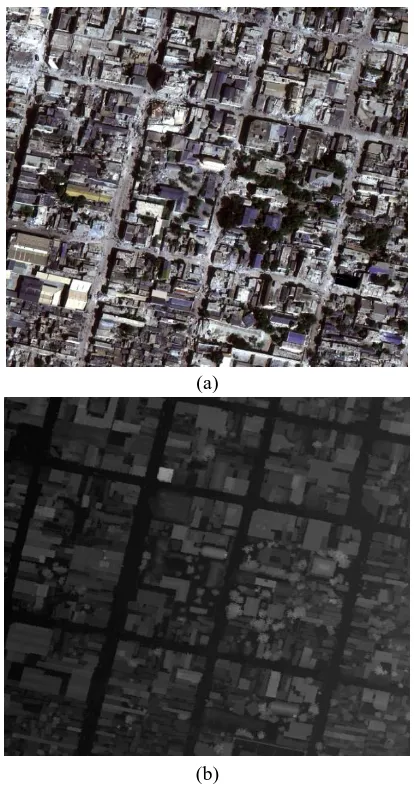
The study area is located in Port-au-Prince, city, Haiti, which was damaged by a catastrophic earthquake on January 12th, 2010. In this study, Worldview II satellite imagery and LiDAR DSM acquired on January 16th 2011 are used to evaluate the proposed method. The satellite image consists of four multi-spectral bands with a resolution of 2 m and one high-resolution panchromatic band with 0.5 m resolution. Four high-resolution colored bands are used in this algorithm, through integrating the multi-spectral and panchromatic bands. From the dataset, 1 km2 study area equal to 1000×1000 pixels in the HRSI and 500×500 pixels in the DSM were selected, which are depicted in Figure 2.
(a)
(b)
16 4. Implementation and Results
After data pre-processing, segmentation of both images was performed through multi-resolution segmentation algorithm in eCognition Developer 9. In this case, the most important parameters including scale, shape, and compactness were considered to 17, 0.4, and 0.7 for the post-event image, and 20, 0.3, and 0.7 for the DSM. The results of this step for both image and DSM are shown in Figure 3. As seen, the number of obtained image objects from DSM is more than the segments on the HRSI.
(a)
(b)
Figure 3. Extracted image-objects on post-earthquake image and DSM, through multi-resolution segmentation
algorithm. a) Post-event image. b) LiDAR DSM. After image-object generation, geometrical, textural, and spectral features were extracted for all the image-objects on both of the datasets. Table 2 shows the obtained features of the damaged area for two sample image-objects on both input
value
datasets. The high of Entropy, Correlation, and Contrast shows the Heterogeneity and low values of Homogeneity and Angular 2nd Moment features show the Homogeneity.
Table 2. Obtained features of damaged area for two sample segments on both image and DSM.
LiDAR HRSI
#1 #2 #1 #2
GLCM-Contrast 0.59 0.73 0.66 0.72
GLCM-Homogeneity 0.55 0.46 0.11 0.14
Geometry-Asymmetry 0.87 0.40 0.58 0.55
Geometry-Density 0.14 0.63 0.77 0.79
GLCM-Correlation 0.08 0.02 0.83 0.72
GLCM-Std. Dev 0.30 0.16 0.11 0.08
GLCM-Ang. 2nd. 0.01 0. 12 0.00 0.00
GLCM-Entropy 0.72 0.54 0.89 0.84
Geometry-Compactness 0.56 0.18 0.14 0.08
Brightness 0.35 0.22 0.21 0.20
In the following, the selected image-objects for training the classification algorithm are shown in Figure 4. This figure demonstrates the total number of training samples, including the “Building,” “Debris,” “Tree,” and “Ground” polygons, which manually selected from the study area.
(a)
(b)
Figure4. Selected samples on the post-event HRSI and DSM. a) Training data on the post-event HRSI. b)
Training data on the DSM.
Building Debris Ground Tree
±
Building Debris Ground Tree
17 From Figure 5, it can be observed that completely eroded
buildings with healthy roofs are well detected by the DSM data and could not be detected by satellite image. In contrast, the debris deployed on the road could not be detected by DSM, while the satellite image has easily recognized it. Also, most of the trees and grounds have been detected with high accuracy through the LiDAR data, while in some cases, satellite image has wrongly classified the ground as a building, and the shadow of a tree as a tree.
(a)
(b)
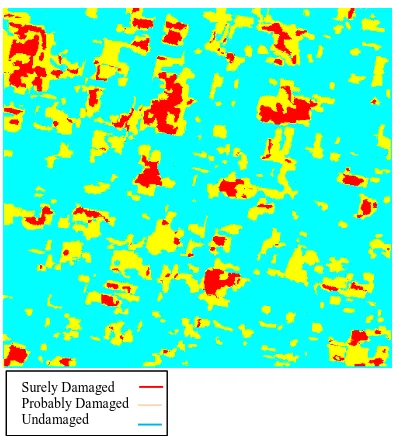
Figure 5.The Classified maps using the K-NN method. (a) The post-event HRSI. (b) The LiDAR DSM. Generally, using only LiDAR or image cannot be an accurate result for building damage detection. Dividing the building damage areas into three classes of “Surely Damaged,” “Probably Damaged,” and “Undamaged” through combination process can be an appropriate way to determine where the first responders and rescue team should be sent and how to prioritize their efforts. In this way, relief will first be carried out in areas known as “Surely Damaged” by this algorithm. The integrating results of two classified images in three classes of “Surely Damaged,” “Probably Damaged,” and “Undamaged” are shown in Figure 6.
Figure 6. The result of combining the classification results of LiDAR-based DSM and post-event HRSI. The result of the three segments in the classification step for both datasets are shown in Figure 7. Asshown, in samples 2 and 3, the eroded buildings with healthy roofs are well detected by the DSM data while they could not be detected by satellite images.Conversely, from Section 1, the debris deployed on the road is not detectable by the DSM data while the satellite image has easily recognized it. These show the integration necessity to achieve more accurate results.
To evaluate the obtained damage map, the results were
compared with the real ground damage map, which was manually collected using the post-event HRSI, and a/the confusion matrix was obtained. Table 3 illustrates the confusion matrix in three cases of 1) merely applying the LiDAR DSM data, 2) merely using the HRSI, and 3) by combining the LiDAR DSM and HRSI satellite imagery. According to Table 3, a total of 162,946 pixelsof damaged buildings were correctly detected by integrating the classification results; however, this number was 161,227 and 160,826 when DSM and HRSI satellite imagery was used, respectively. As for the accuracies, the proposed combination approach has achieved higher overall accuracy, precision, recall, and F1-score, while building damage detection results based on only LIDAR or HRSI has lower accuracy assessment parameters. These results indicate that the proposed method would be able to detect most of the damaged buildings. Moreover, all the pixels of “Surely Damaged” were correctly labeled as damaged buildings, which improves the first relief operations.
In order to better evaluate the proposed method, the overall
accuracy of some other damage assessment methods in the Haiti dataset are shown in Table 4. According to the table, the proposed method has much higher accuracy than the studies that use only post-event datasets. This is because of integrating post-event LiDAR data and post-event HRSI.
Building Debris Ground Tree
Surely Damaged Probably Damaged Undamaged
18 LiDAR-DSM HRSI LiDAR-Class HRSI-Class Combination
Figure 7. The result of the three segments in the classification step for both datasets.The five columns (left to right) include: (1) selected area on post-event LiDAR-DSM; (2) selected area on post-event image; (3) classification result based on LiDAR DSM;
(4) Classification result based on satellite image; (5) building damage map by combining the classification results. Table 3. The confusion matrix in three cases of merely applying the DSM data, merely using the post-event HRSI, and
by combining the DSM and post-event HRSI
F1-score
(%) Recall
(%) Precision
(%) Accuracy
(%) Undamaged
Damaged Data
Source
74 61
96 89
101,030 161,227
Damaged LiDAR
735,024 2,719
Undamaged
76 63
97 91
91,943 160826
Damaged HRSI
744,111 3,120
Undamaged
82 70
99 92
Probably Surely
LiDAR + HRSI
70,448 113,925
49,021 Damaged
765,606 1000
0 Undamaged
Furthermore, the proposed method has higher accuracy than those studies that use both pre- and post-earthquake datasets. This is because of selecting the appropriate features and training samples, performing the geometrical features besides the spectral and textural features, using object-based image analysis, and most importantly combining the classification results of DSM and HRSI.
Table 4. The overall accuracy of some existing methods for damage assessment in Haiti.
Reference Test Data OA (%)
Ji et al. (2018) QuickBird 78
Miura et al. (2016) TSX 75
Cooner et al. (2016) WorldView, QuickBird 77 He et al. (2016) LiDAR , GIS data, DEM 87.3
Rastiveis et al. (2015) LiDAR data, vector map 91
Pham et al. (2014) VHR, LiDAR data 79
Uprety et al. (2013) SAR 73.8
Miura et al. (2012) QuickBird, worldview 70
Miura et al. (2012) QuickBird 81.4
Labiak et al. (2011) LiDAR data 73.4
5. Conclusion
In this paper, a new method has been proposed for mapping
the damaged buildings after an earthquake using both LiDAR data and post-event satellite images. In the proposed method, image-objects were first generated through the multi-resolutionsegmentation algorithm on both Worldview II satellite image and LiDAR raster data. Features including textural, geometrical, and statistical were applied for classifying both data through k-nearest neighbor classification algorithm. Finally, both classification results were integrated to create a final damage map with three classes of “Surely Damaged,” “Probably Damaged,” and “Undamaged”. The calculated accuracy assessment parameters such as overall accuracy, precision, recall, and F1-score of respectively92%, 99%, 70%, 82% showed the superiority of the proposed integrated method when compared to application of only one dataset.
Comparing the proposed integrated method with other
19 “Surely Damaged” were correctly labeled as damaged
buildings by the proposed method, the overall accuracy of 92% is attributed to some mistakes in “Probably Damaged” and “Undamaged” classes.
The extension of this method through developing other classification methods, integrating the classification results using other decision level fusion techniques, and also combining different classification algorithms may lead to accomplishing the desired objective of generating comprehensive and more accurate damage maps.
References
Bai, Y., Adriano, B., Mas, E., Gokon, H., & Koshimura, S.
(2017). Object-Based Building Damage Assessment
Methodology Using Only Post Event
ALOS-2/PALSAR-2 Dual Polarimetric SAR Intensity Images. Journal of
Disaster Research Vol, 12(2), 259.
Bakhary, N., Hao, H., & Deeks, A. J. (2007). Damage
detection using artificial neural network with
consideration of uncertainties. Engineering Structures,
29(11), 2806-2815.
Bartels, S. A., & VanRooyen, M. J. (2012). Medical
complications associated with earthquakes.The Lancet,
379(9817), 748-757.
Benz, U. C., Hofmann, P., Willhauck, G., Lingenfelder, I., &
Heynen, M. (2004). Multi-resolution, object-oriented
fuzzy analysis of remote sensing data for GIS-ready
information. ISPRS Journal of photogrammetry and
remote sensing, 58(3-4), 239-258.
Chini, M., Cinti, F., & Stramondo, S. (2011). Co-seismic
surface effects from very high resolution panchromatic
images: the case of the 2005 Kashmir (Pakistan)
earthquake.Natural Hazards and Earth System Sciences,
11(3), 931-943.
Corbane, C., Carrion, D., Lemoine, G., &Broglia, M. (2011).
Comparison of damage assessment maps derived from
very high spatial resolution satellite and aerial imagery
produced for the Haiti 2010 earthquake. Earthquake
Spectra, 27(S1), S199-S218.
Definiens, A. (2012). Developer XD 2.0. 4.Reference Book.
Dong, P., & Guo, H. (2012). A framework for automated
assessment of post-earthquake building damage using
geospatial data.International journal of remote sensing,
33(1), 81-100.
Duda, R. (2001). Hart. P., E., and Stork, DG,” Pattern
Classification”.New York: Wiley.
Endo, Y., Adriano, B., Mas, E., & Koshimura, S. (2018).
New Insights into Multiclass Damage Classification of
Tsunami-Induced Building Damage from SAR Images.
Remote Sensing, 10(12), 2059.
Haralick, R. M., & Shanmugam, K. (1973). Textural features
for image classification.IEEE Transactions on systems,
man, and cybernetics, (6), 610-621.
Huang, C.-L., Chen, M.-C., & Wang, C.-J. (2007). Credit
scoring with a data mining approach based on support
vector machines.Expert systems with applications, 33(4),
847-856.
Ivits, E., & Koch, B. (2002) 'Object-oriented remote sensing tools for biodiversity assessment: A European approach'
Proceedings of the 22nd EARSeL Symposium, Prague, Czech Republic. pp. 4-6.
Janalipour, M., & Mohammadzadeh, A. (2016). Building damage detection using object-based image analysis and ANFIS from high-resolution image (Case study: BAM earthquake, Iran). IEEE Journal of Selected Topics in Applied Earth Observations and Remote Sensing, 9(5), 1937-1945.
Janalipour, M., & Mohammadzadeh, A. (2018). Evaluation of effectiveness of three fuzzy systems and three texture extraction methods for building damage detection from post-event LiDAR data. International Journal of Digital Earth, 11(12), 1241-1268.
Janalipour, M., & Taleai, M. (2017). Building change detection after earthquake using multi-criteria decision analysis based on extracted information from high spatial resolution satellite images. International Journal of Remote Sensing, 38(1), 82-99.
Li, P., Xu, H., Liu, S., & Guo, J. 5 (2009) 'Urban building damage detection from very high resolution imagery using one-class SVM and spatial relations' Geoscience and Remote Sensing Symposium, 2009 IEEE International, IGARSS 2009. IEEE, pp. V-112-V-114. Ma, J., & Qin, S. (2012) 'Automatic depicting algorithm of
with airborne high collapsed buildings
earthquake
resolution image' Geoscience and Remote Sensing Symposium (IGARSS), 2012 IEEE International. IEEE, pp. 939-942.
Meng, X., Wang, L., Silván-Cárdenas, J. L., & Currit, N. (2009). A multi-directional ground filtering algorithm for airborne LIDAR. ISPRS Journal of Photogrammetry and Remote Sensing, 64(1), 117-124.
Miura, H., Modorikawa, S., & Chen, S. H. (2011) 'Texture characteristics of high-resolution satellite images in damaged areas of the 2010 Haiti earthquake' Proceedings of the 9th International Workshop on Remote Sensing for Disaster Response, Stanford, CA, USA. pp. 15-16. Moya, L., Yamazaki, F., Liu, W., & Yamada, M. (2018).
Detection of collapsed buildings from lidar data due to the 2016 Kumamoto earthquake in Japan. Natural Hazards and Earth System Sciences, 18(1), 65.
Moya, L., Zakeri, H., Yamazaki, F., Liu, W., Mas, E., & level co
gray (2019). 3D S.
Koshimura, -occurrence i
to its application
matrix and dentifying collapsed buildings. ISPRS Journal of Photogrammetry and Remote Sensing, 149, 14-28.
Ranjbar, H. R., Ardalan, A. A., Dehghani, H., & Saradjian, M. R. (2018). Using high-resolution satellite imagery to proide a relief priority map after earthquake. Natural Hazards, 90(3), 1087-1113.
Rastiveis, H., Khodaverdi zahraee, N., & Jouybari, A. (2018). Object-oriented classification of lidar data for post-earthquake damage detection. Int. Arch. Photogramm. Remote Sens. Spatial Inf. Sci., XLII-3/W4, 421-427. doi:10.5194/isprs-archives-XLII-3-W4-421-2018.
20
Rezaeian, M. (2010). Assessment of earthquake damages by image-based techniques. ETH Zurich.
Rodríguez, A. S., Rodríguez, B. R., Rodríguez, M. S., & Sánchez, P. A. (2019). Laser scanning and its applications to damage detection and monitoring in masonry structures. Long-term Performance and Durability of Masonry Structures (pp. 265-285). Elsevier.
Schweier, C., Markus, M., & Steinle, E. (2004). Simulation of earthquake caused building damages for the development of fast reconnaissance techniques. Natural Hazards and Earth System Science, 4(2), 285-293. Sirmacek, B., & Unsalan, C. (2009) 'Damaged building
detection in aerial images using shadow information' Recent Advances in Space Technologies, 2009. RAST'09. 4th International Conference on. IEEE, pp. 249-252.
Tran, T. H. G., Ressl, C., & Pfeifer, N. (2018). Integrated change detection and classification in urban areas based on airborne laser scanning point clouds. Sensors, 18(2), 448.
Trinder, J., & Salah, M. (2012). Aerial images and LiDAR data fusion for disaster change detection. ISPRS Ann. Photogramm. Remote Sens. Spat. Inf. Sci, 1, 227-232. Vetrivel, A., Gerke, M., Kerle, N., & Vosselman, G. (2015).
Identification of damage in buildings based on gaps in 3D
point clouds from very high resolution oblique airborne images. ISPRS journal of photogrammetry and remote sensing, 105, 61-78.
Vu, T. T., Matsuoka, M., & Yamazaki, F. 5 (2004) 'LIDAR-based change detection of buildings in dense urban areas' IGARSS 2004. 2004 IEEE International Geoscience and Remote Sensing Symposium. IEEE, pp. 3413-3416. Xiao, P., Zhang, X., Wang, D., Yuan, M., Feng, X., & Kelly,
M. (2016). Change detection of built-up land: A framework of combining pixel-based detection and object-based recognition. ISPRS Journal of Photogrammetry and Remote Sensing, 119, 402-414. Yamazaki, F., Kouchi, K. i., Matsuoka, M., Kohiyama, M.,
& Muraoka, N. (2004) 'Damage detection from high-resolution satellite images for the 2003 Boumerdes, Algeria earthquake' 13th World Conference on Earthquake Engineering, International Association for Earthquake Engineering, Vancouver, British Columbia, Canada. p. 13.