MILK PRODUCTION POTENTIAL IN KHYBER PAKHTUNKHWA
Abdul Hassan*, Muhammad Ishaq*, Nisar Ali Shah* and Arshad Farooq*
ABSTRACT:- This study was conducted in three agro-ecological regions, namely, barani areas, wet mountains and Northern dry mountains of Khyber Pakhtunkhwa, Pakistan by using concept of typical farms. The yield and production of milk gap was estimated in three scenarios. The results showed that the present milk production of Khyber Pakhtunkhwa is 2.74 mt with 1579 lit of milk per buffalo per year, 663 lit of milk per cow per year, 95 lit milk per goat per year and 64 lit of milk per sheep per year. The data in comparison to the National and World average, is far below from probable production levels. Except in buffaloes and goats where the farm level production of milk is higher than the World and sheep where the farm level production of milk of Khyber Pakhtunkhwa is higher than Pakistan and World. Overall the milk production of Khyber Pakhtunkhwa can be increased upto 5.82mt by proper management and genetic improvement. More research is needed at farm level in the context of breed adaptability and management in respect of cost of livestock herds production in Khyber Pakhtunkhwa, Pakistan.
Key Words: Milk Yield; Production Gap; Typical Farms; Pakistan.
INTRODUCTION
Livestock has been the subsis-tence sector dominated by small hol-ders to meet the needs of milk, food security and daily cash income. It is central to the livelihood of the rural poor and can play an important role in poverty alleviation in Pakistan. Livestock the largest contributor to Pakistan's agriculture (55.4%) added 11.9 % to the national GDP during 2012-13 (GoP, 2013). According to the estimates made by FAOSTAT (2011) Pakistan is the 4th largest milk producing country in the world with 35.49 billion liters of milk, averaging 4.9% of the total world milk produc-tion. More than eight million farming households in Pakistan were involved
in livestock farming. The herds sp-read over thousands of square kilo-meters with an average of 2 - 5 ani-mals per household (Pakistan Dairy Development Company, 2006). The milk sector in Pakistan economy can be used as a vehicle for rural develop-ment (Sarwar et al., 2002), as milk sector with a huge potential is mainly based in the rural sector of Pakistan (Hassan, 2011).
Khyber Pakhtunkhwa, has 5.97 million cattle, 1.93 million buffaloes, 3.36 million sheep and 9.6 million goats, having 1.87 million cattle and 0.81 million buffaloes in milk (Table 1). Simi-larly 0.6 million sheep and 5.5 million goats were female with above one year of age. Of the total 1.93 million milch cows, reported by
* PARC, Social Sciences Research Institute, Tarnab, Peshawar, Pakistan.
Table 1. Livestock in Khyber Pakhtunkhwa
2006 2009-10
Livestock
Cattle Buffalo Sheep Goat Total
Pakistan
29.56 27.33 26.49 53.79 137.17
KPK
5.97 1.93 3.36 9.60 20.86
% share of KPK
20.20 7.06 12.68 17.85 15.21
Pakistan
34.30 30.80 27.80 59.90 152.80
KPK
7.60 2.30 4.00 12.90 26.80
% share of KPK
22.16 7.47 14.39 21.54 17.50 Source: Khyber Pakhtunkhwa Development Statistics, 2010
Table 2. Number of animals in three districts of Khyber Pakhtunkhwa
Livestock Study area Total Small herds Medium herds Large herds
Cattle
Buffalo
Sheep
Goat
KPK D.I.Khan Mansehra Swat KPK D.I.Khan Mansehra Swat KPK D.I.Khan Mansehra Swat KPK D.I.Khan Mansehra Swat
5967886 411432 181973 253790 1927495 205634 191064 117101 3363249 248491 86729 80048 9599017 583923 316759 236229
3180994 (53) 153696 (37) 130873 (72) 157744 (62) 1381306 (72) 78631 (38) 168422 (88) 82982 (71) 1894937 (56) 173892 (70) 47513 (55) 33624 (42) 5975279 (62) 364414 (62) 256926 (81) 134855 (57)
1714685 (29) 205012 (50) 49319 (27) 85482 (34) 369104 (19) 72509 (35) 22149 (12) 30043 (26) 754273 (22) 64028 (26) 25363 (29) 21539 (27) 1624074 (17) 159830 (27) 20904 (07) 16859 (07)
1072209 (18) 52725 (13) 1781 (01) 10563 (04) 177079 (09) 54493 (26) 493 (0.3) 4075 (03) 714041 (21) 10569 (04) 13852 (16) 24886 (31) 1999672 (21) 59679 (10) 38929 (12) 84515 (36) Large Ruminants: Small < 06 Animals, Medium = 07-20 Animals and Large > 20 Animals
Small Ruminants: Small < 30 Animals, Medium = 31-75 Animals and Large > 75 Animals Values in the parenthesis are the percentages of total
Source: Livestock Census, 2006
0.87 million house-holds, more than three-fifth (71.20%) were owned by households having 1-4 animals, others 13.7% by house-holds having 5-10 milch animals, 5.4% by the household having 11-20 milch animals while remaining 6.7% of the milch cattle was kept by the household having 21 and above cattle. Similarly, of the total 0.46 million milch buffaloes, reported by 0.27 million households, more than four-fifth (83.30%) were by house-holds having 1-4 animals, others 8.4 % by households having 5-10 milch buffaloes, 3.7% by the household having 11-20 milch animals while remaining 4.7% of the milch buffaloes was kept by the household having 21 and above buffaloes (GoP, 2006). Majority of the herd having 53% of the total cattle was small, 29% were me-dium and remaining 18% were large cattle farms in Khyber Pakhtunkhwa. Similarly more than three-fifth (72%) of the buffaloes was in the small herds, 19% were in the medium and remaining 9% were in the large herds. Likewise small ruminants, majority of the herd having 56% of the total sheep was small, 22% were medium and remaining 21% were large sheep farms in Khyber Pakhtunkhwa. Simi-larly more than three-fifth (62%) of the goat was in the small herds, 17% were in the medium and remaining
21% were in the large herds (Table 2). The increase in population along with rural-urban migration, increase the market demand for dairy pro-ducts which provides an opportunity to smallholders to improve their living standards, reduce poverty, with a challenge to improve their production costs and productivity. This study is an effort to ascertain the farm level milk production of Khyber Pakhtun-khwa of small, medium and large farms and to compare it with national and international average of milk production.
MATERIALS AND METHOD Khyber Pakhtunkhwa comprise four agro-ecological regions. After the discussion with the livestock experts of the province and the time and fina-ncial constraints, this study was conducted in three agro-ecological regions, i.e., barani areas, wet moun-tains and northern dry mounmoun-tains (Table 3). One district from each agroecological zone was selected for data collection. Methodology applied for sample selection was developed by International Farm Comparison Network (Isermeyer et al., 2003) and utilizes the concept of typical farms. The concept of typical farms was first used by Elliot (1928) and afterward a number of scientists uses the concept
Table 3. Agro-Ecological Regions of Pakistan
Agro-Ecological Regions Area
Barani Areas D.I. Khan, Bannu and Abbottabad
Wet Mountains Hazara and Mansehra
Northern Dry Mountains Chitral, Dir and Swat valley
of typical farms (Taussig, 1939; Mar-shall, 1952; Hatch et al., 1982; Dillon and Skold, 1992; Uddin et al., 2010; Garcia et al., 2003). The typical farms methodology helps to do synthesis of large area with small sample size selected on the basis of experts. This method is most cost effective and time saving. However, the limitation for this methodology relies on the selec-tion of few typical farms to represent the whole dairy farm population in the area (Uddin et al., 2010). A typical dairy farm is defined (in this study) as a dairy farm in a region in terms of herd size. The farms were selected after the consultation with the local experts by organising a formal dis-cussion so as the selected farm had to represent the region's dairy farm. Three types of farms i.e., small, medium and large selected from each zone was interviewed each for cattle, buffalo, sheep and goats. Therefore, a total of 36 sample farmers were interviewed from different zones of Khyber Pakhtunkhwa, Pakistan.
Data collection was made by a standard questionnaire and data was analyzed using SPSS and Excel software.
Data Collection from the Dairy Farms
Typical farms were selected from each agro-ecological regions (Table 3), belonging to D. I. Khan (barani areas), district Mansehra (wet mountains) and Swat valley (northern dry moun-tains). Thereafter, farm categories were identified such as small, medi-um and large.
The farm average of milk pro-duction of Khyber Pakhtunkhwa was obtained by multiplying the milk production obtained during the sur-vey in 2012 comprising milking
ani-mals of three and above years obta-ined from livestock census 2006. The data for milk production of National average of various breeds was obta-ined from different published litera-ture (Afzal and Naqvi, 2003; Iqbal and Ahmad, 1999; Isani and Baloch, 1996, Hussain and Naqvi 2010) (Table 4). The data of milk production in comparison with FAO statistics for Pakistan and world were obtained from FAOSTAT (2010). Milk yield gap and milk production gap was calculated as follows:
lYield gap = Milk yield in
respective scenario - Milk yield at farm
lProduction gap = Milk
production in respective scenario - Milk production at farm
lPotential = (Yield Gap /Milk Yield at Farm) × 100
RESULTS AND DISCUSSION Livestock Number and Farm Inventories
Table 4. Milk production potentials of different breeds
Type Breed Unit Average
Lactation length
(d ays)
References
Buffalo Nili Ravi
-1 (lit lactation )
2300
-Iqbal and (1999)
Ahmad
Kundi 2000
-Cattle Red Sindhi
lit 305 -1 days
1675 270
Afzal and Naqvi (2003)
Sahiwal 1852 283
Bhagnari 950 262
Lohani 613 163
Rojhan 735 192
Tharparkar 1584 277
Cholistani 1471 285
Dajjal 900 257
Kankreg 1200 Afzal and Naqvi
(2003), Iqbal and Ahmad (1999)
Dhanni 800 204
Goat Barbari
Daily milk yield (lit)
1.00
Kamori 1.8 -2.2 115
Isani and Baloch (1996)
Beetal 1.8 -2.7 120 -140
Dera Din Panah 1.3 -2.2 130
Damani 1.1 -1.4 90 -120
Gaddi 0.4 -0.7
-Afzal (2003)
and Naqvi
Kajli (Pahari) 0.9 -1.3
-Sindh Desi 0.9 -1.8
-Khurassani 0.9 -1.3
-Baltistani 1.1
-Bujri 1 - 1.25
-Jarakheil 1.39
-Jattal 0.53
-Jattan 1.5 -3
-Kacchan 2 -3
-Kooti 0.71
-Kurri 1
-Labri 1.12
-Pateri 1.0 - 2.0
-Tapri or Lappi 0.5 -1.0
-Gojali lit 209
-1 days
129 209 H
(2010), Afzal and Naqvi (2003)
ussain and Naqvi
Sheep Kachhi Daily milk yield (lit)
-while only 19 to 23% of the cattle at typical farms were productive (Figure 1). Similarly more than two third of the buffaloes at typical farm were non-productive while 22-33% of the buffaloes at typical farms was pro-ductive. In small ruminants, 66-75% of the goats at typical farm were non-productive while 25-34% of the goats at typical farms were productive. Similarly 52-77% of the sheep at typical farm were non-productive while remaining 23-48% of the sheep at typical farms were productive.
Milk Production of Typical Farm in Khyber Pakhtunkhwa
The livestock farmers' of Khyber Pakhtunkhwa purchased animals either from fellow farmers or Live-stock markets/mandi. The farmers select the animals depending on
vi-suals and milk production. Different factors like breed of the animal, age, calving number, lactation length, dry period, climate condition of the area effect the milk production of the dairy animals. It is necessary for dairy farming that the animal brought to the farm should be healthy and free from diseases. The animal can be assessed by leaving the collection of first time milk, and the average of the next three times milk can give the best idea for milking productivity of the animal.
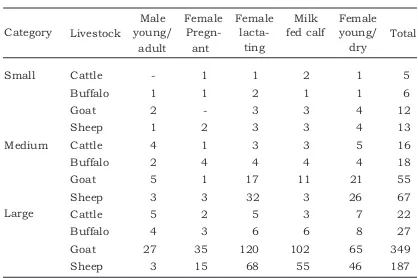
Nili Ravi (Black Gold) a buffalo dairy breed, was very common in Khyber Pakhtunkhwa followed by Kundi breed however, Azi-Khel breed was found in Swat valley. In Khyber Pakhtunkhwa, the farmers got milk twice a day from the lactating buffa-loes. The male calves were normally Table 5. Livestock numbers by farm type
Category
Small
Medium
Large
Livestock
Cattle Buffalo Goat Sheep Cattle Buffalo Goat Sheep Cattle Buffalo Goat Sheep
Male young/
adult
-1 2 1 4 2 5 3 5 4 27 3
Female
ant
Pregn-1 1 -2 1 4 1 3 2 3 35 15
Female
lacta-ting
1 2 3 3 3 4 17 32 5 6 120 68
Milk fed calf
2 1 3 3 3 4 11 3 3 6 102 55
Female young/
dry
1 1 4 4 5 4 21 26 7 8 65 46
Total
removed from the mother soon after birth to save milk. The lactation length for the buffaloes of small, medium and large typical farms was 242, 245 and 230 days, respectively. The total milk production during a lactation period was 1636 lit, 1471 lit and 1631 lit for small, medium and large dairy buffalo farms, respecti-vely. The reason for higher milk
production by small farmers may be the efficient uses of their resources. It was also observed during the survey that the small farmers had replaced the inefficient milk breed animals by small number of higher milking breed animals. The large farmers had more resources and having good milking breed animals which were efficiently managing their farms. The medium
C
a
tt
le
B
u
ff
a
lo
B
u
ff
a
lo
B
u
ff
a
lo
G
o
a
t
G
o
a
t
G
o
a
t
S
h
e
e
p
S
h
e
e
p
S
h
e
e
p
Small Medium Large Small Medium Large
P
e
rc
e
n
ta
g
e
C
a
tt
le
C
a
tt
le
Productive Non Productive
20 33
19 22 23 22
25 23
31 48
34 36
10 20 30 40 50
0 60 70 80
90 80
67 81
78 78
75
77 69
52
66 61
77
Figure 1. Productive and non-productive animals at typical farm
Table 6. Milk production of the large ruminants typical farm
Category Buffalo Cattle
Lactation length (days)
First quarter milk (lit)
Second quarter milk (lit)
Third quarter milk (lit)
Four quarter milk (lit)
Total milk production (lit)
Small
242
586
463
340
247
1636
Medium
245
470
479
334
188
1471
Large
230
672
469
256
234
1631
Small
199
310
213
156
101
780
Medium
196
207
181
142
53
583
Large
184
241
192
124
73
630
farmers had a mix breed of animals at their farms (Table 6).
Cattle breeds like Sahiwal, Achai, desi (undescriptive), Damani and Friesian were found in the typical farms of cattle. The dairy farmers milk dairy cows twice a day. The lactation length of cattle ranged from 184 for large typical farms to 199days for small typical cattle farms. The lactation length for typical medium cattle farm was 196 days. The total milk production during a lactation period from small, medium and large farms per animal was 780lit, 583lit and 630 lit, respectively (Table 6).
Goat also known as “poor man's cow” as it is small, takes less food and provides milk and meat for a family. A number of different breeds of goats i.e., desi (undescriptive), Damani, Beetal, Sargodha, Kolachi etc were found in the study area. The farmers milk dairy goats twice a day. The medium and large farmers mostly feed the kid from milk. Sometime the milk by medium and large farmers were used for home consumption also. The lactation length ranged from 103days for medium typical goat farm to 108 days for small typical goat
farm. The lactation length for large goat typical farm was 107 days. The total milk production during a lacta-tion period from small, medium and large typical farms per animal was 112 lit, 103 lit and 71 lit, respectively in the study area (Table 7).
Damani, Farmi, Pahari, Desi (undescriptive), Ajree, Kaghani were sheep breeds found in the typical farms. Mostly the farmers did not milk sheep. The lactation length ran-ged from 124days for medium sheep typical farms to 130 days for large sheep typical farms. The lactation length of small sheep typical farm was 129 days. The total milk production during a lactation period from small farm per animal was 77 lit, from medium typical farm was 59 lit and 57 lit from large farms (Table 7).
Yield and Production Gaps
The yield and production gap were estimated in three scenarios. Firstly, if the milk production of Khy-ber Pakhtunkhwa achieve the natio-nal average i.e., if all the animals produce on average the equals to the milk production at farm level. Seco-nd, if the present milk production of Table 7. Milk production of the small ruminants typical farm
Category
Goat Sheep
Lactation length (days)
First thrice milk (lit)
Second thrice milk (lit)
Third thrice milk (lit)
Total milk production (lit)
Small
108
56
42
14
112
Medium
103
49
40
14
103
Large
107
35
25
11
71
Small
129
33
23
21
77
Medium
124
27
20
12
59
Large
130
28
19
10
57
all animals equals the average of milk production of Pakistan and third if the milk production of Khyber Pakhtunkhwa reached the average of the world milk production. The data shows that the present milk pro-duction of Khyber Pakhtunkhwa is 2.74 mt with 1579lit of milk per buffalo per year, 663lit of milk per cow per year, 95lit of milk per goat per year and 64lit of milk per sheep per year (Table 8). The data in compa-rison to the national average, FAO (2010) and World (2010) is far below from probable production levels. Except in buffaloes and goats where the farm level production of milk is higher than the World (2010) and sheep where the farm level produc-tion of milk of Khyber Pakhtunkhwa is higher than Pakistan (FAO, 2010; World, 2010). Overall the milk pro-duction of Khyber Pakhtunkhwa can be increased upto 5.82 mt by proper management and genetic improve-ment.
The data shows that the present milk production of Khyber Pakhtun-khwa can be increased upto 5.82 mt by genetic improvement and proper management. It is recommended that the new genetically improved breeds of dairy animals, be cost effective and suitable to the climatic conditions of the area should be introduced to in-crease the productivity. Furthermore, more research needed at farm level in the context of breed adaptability and management in respect of Livestock herds and cost of production in Khyber Pakhtunkhwa, Pakistan.
LITERATURE CITED
Afzal, M., and A. N. Naqvi. 2003. Live-stock resources of Pakistan: present and future trends, Ta
-Quarterly Science Vision, 9(1-2 & 3-4).
Dillon, F. M., and M.D. Skold. 1992. typical farm theory in agricul-tural research. J. Sustainable Agric. 2 (2): 43-58.
Elliot, F. F. 1928. The representative firm idea applied to research and extension in agricultural econo-mics. J. Farm Econ. 10:483-498. FAOSTAT 2011. http://faostat.fao.
org/site/569/DesktopDefault.as px?PageID=569#ancor(accessed November 22,2011).
Garcia, O., K. Mahmood, and T. Hemme. 2003. A review of milk production in Pakistan with particular emphasis on small-scale producers. Rome: Food and Agriculture Organisation of the United Nations. (PPLPI Working Paper No. 3).
GoKP. 2011. Khyber Pakhtunkhwa: Official Gateway to Government http://www.khyberpakhtunkhw a.gov.pk/Agriculture/AttDept/D airy.php accessed November 22, 2011.
GoP. 2006. Pakistan Livestock Census. Statistical Division, Agricultural Census Organiza-tion, Government of Pakistan, Islamabad.
GoP. 2013. Pakistan Economic Survey, (2012-2013), Ministry of Finance, Government of Pakis-tan, Islamabad.
Hassan, A. 2011. Policy implication on the dairy sector in Pakistan: Trade and Welfare analysis for t h e m i l k s u b s e c t o r . U n -published IMRD Thesis, Inter-national Master of Science in Rural Development, University of Ghent-Belgium.
Hatch, T. C., C. Gustafson, K. Baum, and D. Harringonton. 1982. A
typical farm series: Development and application to a Mississippi Delta Farm. Southern J. Agric. Econ. 14(2):31-36.
Hussain, R., and A. N. Naqvi. 2010. Gojali goat breed of Gilgit, Baltistan, Pakistan. Pakistan J. Agric. Res. 23(1-2): 98-102.
Iqbal, M., and M. Ahmad. 1999. An assessment of livestock produc-tion potential in Pakistan: Implications for livestock sector policy. The Pakistan Develop. Review, 38 (4 Part II): 615-628. Isani, G. B., and M.N. Baloch. 1996.
Sheep and goat breeds of Pakis-tan. Department of Livestock Management, Sindh Agriculture University, Tandojam. Press Corporation of Pakistan. 95p. Isermeyer, F. Hemme, T., and
Holzner, J. 2003. Analysis of International competitiveness of milk production in the framework of the IFCN. Agric. Econ.-CZECH, 49 (2):94-100. (http://www. ifcndairy.org).
Khyber Pakhtunkhwa Development Statistics. 2010. Bureau of Sta-tistics, Planning and Develop-ment DepartDevelop-ment, GovernDevelop-ment of Khyber Pakhtunkhwa, Pesha-war.
Marshall, A. 1952. Principles of Eco-nomics. 8th edition. New York, The Mcmillan Company. 62 p. Pakistan Dairy Development
Com-pany. 2006. The White Revolu-tion- Dhoodh Darya. White Paper on Pakistan's Dairy Sector, Dairy Pakistan Township, Kot Lakhpat Lahore, Pakistan. 107 p.
Taussig, F. W. 1939. Principles of Economics. 4th edn. Vol. 1. The Mcmillan Company, New York. Uddin, M. M., Sultana, M. N.,
Ndambi, O. A., Hemme, T. and Peters, K. J. 2010. A farm economic analysis in different dairy production systems in Bangladesh. Livestock Research
for Rural Development. Vol. 22, Article #122. Retrieved October 20, 2011, from http://www.lrrd. org/lrrd22/7/uddi22122.htm Zahoor, A. 2007. Country Report on