© Author(s) 2018. This work is distributed under the Creative Commons Attribution 4.0 License.
Development and analysis of the Soil Water
Infiltration Global database
Mehdi Rahmati1,2, Lutz Weihermüller2,3, Jan Vanderborght2,3, Yakov A. Pachepsky4, Lili Mao5,
Seyed Hamidreza Sadeghi6, Niloofar Moosavi2, Hossein Kheirfam7, Carsten Montzka2,3,
Kris Van Looy2,3, Brigitta Toth8,94, Zeinab Hazbavi6, Wafa Al Yamani9, Ammar A. Albalasmeh10,
Ma’in Z. Alghzawi10, Rafael Angulo-Jaramillo11, Antônio Celso Dantas Antonino12, George Arampatzis13, Robson André Armindo14, Hossein Asadi15, Yazidhi Bamutaze16, Jordi Batlle-Aguilar17,18,19, Béatrice Béchet20, Fabian Becker21, Günter Blöschl22,23, Klaus Bohne24,
Isabelle Braud25, Clara Castellano26, Artemi Cerdà27, Maha Chalhoub17, Rogerio Cichota28, Milena Císlerová29, Brent Clothier30, Yves Coquet17,31, Wim Cornelis32, Corrado Corradini33,
Artur Paiva Coutinho12, Muriel Bastista de Oliveira34, José Ronaldo de Macedo35,
Matheus Fonseca Durães14, Hojat Emami36, Iraj Eskandari37, Asghar Farajnia38, Alessia Flammini33, Nándor Fodor39, Mamoun Gharaibeh10, Mohamad Hossein Ghavimipanah6, Teamrat A. Ghezzehei40,
Simone Giertz41, Evangelos G. Hatzigiannakis13, Rainer Horn42, Juan José Jiménez43,
Diederik Jacques44, Saskia Deborah Keesstra45,46, Hamid Kelishadi47, Mahboobeh Kiani-Harchegani6, Mehdi Kouselou1, Madan Kumar Jha48, Laurent Lassabatere11, Xiaoyan Li49, Mark A. Liebig50,
Lubomír Lichner51, María Victoria López52, Deepesh Machiwal53, Dirk Mallants54,
Micael Stolben Mallmann55, Jean Dalmo de Oliveira Marques56, Miles R. Marshall57, Jan Mertens58,
Félicien Meunier59, Mohammad Hossein Mohammadi15, Binayak P. Mohanty60,
Mansonia Pulido-Moncada61, Suzana Montenegro62, Renato Morbidelli33, David Moret-Fernández52, Ali Akbar Moosavi63, Mohammad Reza Mosaddeghi47, Seyed Bahman Mousavi1, Hasan Mozaffari63,
Kamal Nabiollahi64, Mohammad Reza Neyshabouri65, Marta Vasconcelos Ottoni66, Theophilo Benedicto Ottoni Filho67, Mohammad Reza Pahlavan-Rad68, Andreas Panagopoulos13,
Stephan Peth69, Pierre-Emmanuel Peyneau20, Tommaso Picciafuoco22,33, Jean Poesen70,
Manuel Pulido71, Dalvan José Reinert72, Sabine Reinsch57, Meisam Rezaei32,93, Francis Parry Roberts57, David Robinson57, Jesús Rodrigo-Comino73,74, Otto Corrêa Rotunno Filho75, Tadaomi Saito76,
Hideki Suganuma77, Carla Saltalippi33, Renáta Sándor39, Brigitta Schütt21, Manuel Seeger74, Nasrollah Sepehrnia78, Ehsan Sharifi Moghaddam6, Manoj Shukla79, Shiraki Shutaro80,
Ricardo Sorando25, Ajayi Asishana Stanley81, Peter Strauss82, Zhongbo Su83, Ruhollah Taghizadeh-Mehrjardi84, Encarnación Taguas85, Wenceslau Geraldes Teixeira86, Ali Reza Vaezi87, Mehdi Vafakhah6, Tomas Vogel29, Iris Vogeler28, Jana Votrubova29, Steffen Werner88,
Thierry Winarski11, Deniz Yilmaz89, Michael H. Young90, Steffen Zacharias91, Yijian Zeng83, Ying Zhao92, Hong Zhao83, and Harry Vereecken2,3
1Department of Soil Science and Engineering, Faculty of Agriculture, University of Maragheh, Maragheh, Iran
2Forschungszentrum Jülich GmbH, Institute of Bio- and Geosciences: Agrosphere (IBG-3), Jülich, Germany
3ISMC International Soil Modeling Consortium, Institute of Bio and Geosciences
Forschungszentrum Jülich, 52425 Jülich, Germany
4USDA-ARS Environmental Microbial and Food Safety Laboratory, Beltsville, MD 20705, USA
5Key Laboratory of Dryland Agriculture, Ministry of Agriculture, Institute of Environment and Sustainable
Development in Agriculture, Chinese Academy of Agricultural Sciences, Beijing 100081, PR China
6Department of Watershed Management Engineering, Faculty of Natural Resources,
Tarbiat Modares University, Iran
8Institute for Soil Sciences and Agricultural Chemistry, Centre for Agricultural Research, Hungarian Academy of Sciences, Budapest, Hungary
9Environment Agency, Abu Dhabi, UAE
10Department of Natural Resources and Environment, Faculty of Agriculture,
Jordan University of Science and Technology, P.O. Box 3030, Irbid 22110, Jordan
11Univ Lyon, Université Claude Bernard Lyon 1, CNRS, ENTPE,
UMR5023 LEHNA, 69518, Vaulx-en-Velin, France
12Universidade Federal de Pernambuco, Centro Acadêmico do Agreste,
Núcleo de Tecnologia, Caruaru, Brazil
13Hellenic Agricultural Organization, Soil and Water Resources Institute, 57400 Sindos, Greece
14Department of Physics (DFI), Federal University of Lavras (UFLA),
P.O. Box 3037, CEP 37200-000, Lavras, Brazil
15Department of Soil Science, Faculty of Agricultural Engineering and Technology,
University of Tehran, Karaj, Iran
16Department of Geography, Geo-Informatics and Climatic Sciences, Makerere University,
P.O. Box 7062, Kampala, Uganda
17UMR 1402 INRA AgroParisTech Functional Ecology and Ecotoxicology of Agroecosystems, Institut
National de la Recherche Agronomique, AgroParisTech B.P. 01, 78850 Thiverval-Grignon, France
18UMR 8148 IDES CNRS/Université Paris-Sud, XI Bât. 504,
Faculté des Sciences 91405, Orsay CEDEX, France
19Innovative Groundwater Solutions (IGS), Victor Harbor, 5211, South Australia, Australia
20IFSTTAR, GERS, EE, 44344 Bouguenais, France
21Freie Universität Berlin, Department of Earth Sciences, Institute of Geographical Sciences,
Malteserstr. 74-100, Lankwitz, 12249, Berlin, Germany
22Centre for Water Resource Systems, TU Wien, Karlsplatz 13, 1040 Vienna, Austria
23Institute of Hydraulic Engineering and Water Resources Management,
TU Wien, Karlsplatz 13/222, 1040 Vienna, Austria
24Faculty of Agricultural and Environmental Sciences, University of Rostock, Germany
25Irstea, UE RiverLy, Lyon-Villeurbanne Center, 69625 Villeurbanne, France
26Pyrenean Institute of Ecology-CSIC, AV. Montañana 1005,
Av. Victoria s/n. 50059 Zaragoza, 22700 Jaca, Huesca, Spain
27Soil Erosion and Degradation Research Group, Department of Geography,
University of Valencia, Valencia, Spain
28Plant and Food Research, Mount Albert Research Station, Auckland, New Zealand
29Czech Technical University in Prague, Faculty of Civil Engineering,
Thákurova 7, 166 29 Prague 6, Czech Republic
30Plant and Food Research, Palmerston North, New Zealand
31ISTO UMR 7327 Université d’Orléans, CNRS, BRGM, 45071 Orléans, France
32Department of Soil Management, UNESCO Chair on Eremology, Ghent University, Ghent, Belgium
33Department of Civil and Environmental Engineering, University of Perugia, Perugia, Italy
34UniRedentor University Center. BR 356, 25, Presidente Costa e Silva, Itaperuna, Rio de Janeiro, Brazil
35Embrapa Solos, Rua Jardim Botânico, 1.024, CEP 22040-060, Jardim Botânico, Rio de Janeiro, RJ, Brazil
36Department of Soil Science, Faculty of Agriculture, Ferdowsi University of Mashhad, Mashhad, Iran
37Dryland Agricultural Research Institute, Agricultural Research, Education and Extension
Organization Maragheh, East Azerbaijan, Iran
38Scientific Member of Soil and Water Research Department, East Azerbaijan Agricultural and
Natural Resources Research and Education center, Iran
39Agricultural Institute, Centre for Agricultural Research, Hungarian Academy of Sciences,
Brunszvik str. 2., 2462 Martonvásár, Hungary
40Life and Environmental Sciences, University of California, Merced, USA
41Geographisches Institut, Universität Bonn, Bonn, Germany
42Institute of Plant Nutrition and Soil Science, Christian-Albrechts-Universität zu Kiel,
Olshausenstr. 40, 24118 Kiel, Germany
43ARAID Researcher, Instituto Pirenaico de Ecología, Spanish National Research Council (IPE-CSIC),
44Enginereed and Geosystems Analysis Unit, Belgian Nuclear Research Centre, Mol, Belgium
45Soil, Water and Land Use Team, Wageningen Environmental Research, Wageningen UR,
6708PB Wageningen, the Netherlands
46Civil, Surveying and Environmental Engineering,
the University of Newcastle, Callaghan 2308, Australia
47Department of Soil Science, College of Agriculture, Isfahan University of Technology,
Isfahan 84156-83111, Iran
48Agricultural and Food Engineering Department, Indian Institute of Technology Kharagpur,
Kharagpur – 721302, West Bengal, India
49State Key Laboratory of Earth Surface Processes and Resource Ecology,
Faculty of Geographical Science, Beijing Normal University, Beijing 100875, China
50Research Soil Scientist, USDA Agricultural Research Service, Mandan, ND, USA
51Institute of Hydrology, Slovak Academy of Sciences, Bratislava, Slovakia
52Departamento de Suelo y Agua, Estación Experimental de Aula Dei (EEAD), Consejo Superior
de Investigaciones Científicas (CSIC), P.O. Box 13034, 50080 Zaragoza, Spain
53ICAR-Central Arid Zone Research Institute, Regional Research Station,
Kukma – 370105, Bhuj, Gujarat, India
54CSIRO Land and Water, Glen Osmond, South Australia, Australia
55Soil Science Graduate Program (ufsm.br/ppgcs), Federal University of Santa Maria,
state of Rio Grande do Sul, Brazil
56Federal Institute of Education, Science and Technology of the Amazonas – IFAM,
Campus Center of Manaus, Manaus, Brazil
57Centre for Ecology & Hydrology, Environment Centre Wales, Deiniol Road, Bangor,
Gwynedd LL57 2UW, UK
58ENGIE Research and Technologies, Simon Bolivardlaan 34, 1000 Brussels, Belgium
59Université catholique de Louvain, Earth and Life Institute-Environmental Sciences,
Louvain-la Neuve, Belgium
60Department of Biological and Agricultural Engineering, 2117 TAMU, Texas A&M Univ.,
College Station, TX 77843-2117, USA
61Aarhus University, Department of Agroecology, Research Centre Foulum,
Blichers Allé 20, P.O. Box 50, 8830 Tjele, Denmark
62Universidade Federal de Pernambuco (UFPE), Av. Prof. Moraes Rego,
1235-Cidade Universitária, Recife-PE-CEP: 50670-901, Brazil
63Department of Soil Science, College of Agriculture, Shiraz University, Shiraz, Iran
64Department of Soil Science and Engineering, Faculty of Agriculture,
University of Kurdistan, Sanandaj, Kurdistan Province, Iran
65Department of Soil Science, Faculty of Agriculture, University of Tabriz, Tabriz, Iran
66Department of Hydrology, Geological Survey of Brazil (CPRM), Av. Pauster,
404. CEP 22290-240, Rio de Janeiro, Brazil
67Department of Water Resources and Environment, Federal University of Rio de Janeiro,
Avenida Athos da Silveira Ramos, P.O. Box 68570, Rio de Janeiro, RJ, Brazil
68Soil and Water Research Department, Sistan Agricultural and Natural Resources Research and Education
Center, Agricultural Research, Education and Extension Organization (AREEO), Zabol, Iran
69Department of Soil Science, University of Kassel, Nordbahnhofstr. 1a, 37213 Witzenhausen, Germany
70Department of Earth and Environmental Sciences, Catholic University of Leuven, Geo-Institute,
Celestijnenlaan 200E, 3001 Heverlee, Belgium
71GeoEnvironmental Research Group, University of Extremadura, Faculty of Philosophy and Letters,
Avda. de la Universidad s/n, 10071 Cáceres, Spain
72Soil Science Department, Federal University of Santa Maria, state of Rio Grande do Sul, Brazil
73Instituto de Geomorfología y Suelos, Department of Geography,
University of Málaga, 29071, Málaga, Spain
74Department of Physical Geography, Trier University, 54286 Trier, Germany
75Civil Engineering Program, Alberto Luiz Coimbra Institute for Postgraduate Studies and
76Faculty of Agriculture, Tottori University, 4-101 Koyama-Minami, Tottori 680-8553, Japan
77Department of Materials and Life Science, Seikei University, 3-3-1, Kichijoji-kitamachi,
Musashino, Tokyo 180-8633, Japan
78Department of Soil Science, College of Agriculture, Isfahan University of Technology, Isfahan, Iran
79Plant and Environmental Sciences, New Mexico State University, Las Cruces, New Mexico, USA
80Japan International Research Center for Agricultural Science,
Rural Development Division, Tsukuba, Japan
81Department of Agricultural and Bio-Resources Engineering, Faculty of Engineering,
Ahmadu Bello University Zaria, Nigeria
82Institute for Land and Water Management Research, Federal Agency for Water Management,
Pollnbergstraße 1, 3252 Petzenkirchen, Austria
83Department of Water Resources, ITC Faculty of Geo-Information Science and Earth Observation,
University of Twente, Enschede, the Netherlands
84Faculty of Agriculture and Natural Resources, Ardakan University, Ardakan, Yazd Province, Iran
85University of Córdoba, Department of Rural Engineering, 14071 Córdoba, Spain
86Soil Physics, Embrapa Soils, Rua Jardim Botânico, 1026, 22460-00 Rio de Janeiro, RJ, Brazil
87Department of Soil Science, Agriculture Faculty, University of Zanjan, Zanjan, Iran
88Department of Geography, Ruhr University Bochum, 44799 Bochum, Germany
89Engineering Faculty, Civil Engineering Department, Munzur University, Tunceli, Turkey
90Bureau of Economic Geology, John A. and Katherine G. Jackson School of Geosciences,
University of Texas at Austin, University Station, Box X, Austin, TX, USA
91UFZ Helmholtz Centre for Environment Research, Monitoring and
Exploration Technologies, Leipzig, Germany
92College of Resources and Environmental Engineering,
Ludong University, Yantai 264025, China
93Soil and Water Research Institute, Agricultural Research, Education and
Extension Organization (AREEO), Karaj, Iran
94University of Pannonia, Georgikon Faculty, Department of Crop Production and
Soil Science, Keszthely, Hungary
Correspondence:Mehdi Rahmati ([email protected])
Received: 28 January 2018 – Discussion started: 6 March 2018 Revised: 12 June 2018 – Accepted: 13 June 2018 – Published: 10 July 2018
Abstract. In this paper, we present and analyze a novel global database of soil infiltration measurements, the Soil Water Infiltration Global (SWIG) database. In total, 5023 infiltration curves were collected across all con-tinents in the SWIG database. These data were either provided and quality checked by the scientists who per-formed the experiments or they were digitized from published articles. Data from 54 different countries were included in the database with major contributions from Iran, China, and the USA. In addition to its extensive geographical coverage, the collected infiltration curves cover research from 1976 to late 2017. Basic information on measurement location and method, soil properties, and land use was gathered along with the infiltration data, making the database valuable for the development of pedotransfer functions (PTFs) for estimating soil hydraulic properties, for the evaluation of infiltration measurement methods, and for developing and validating infiltra-tion models. Soil textural informainfiltra-tion (clay, silt, and sand content) is available for 3842 out of 5023 infiltrainfiltra-tion
measurements (∼76%) covering nearly all soil USDA textural classes except for the sandy clay and silt classes.
Information on land use is available for 76 % of the experimental sites with agricultural land use as the
dom-inant type (∼40%). We are convinced that the SWIG database will allow for a better parameterization of the
1 Introduction
Infiltration is the process by which water enters the soil sur-face and it is one of the key fluxes in the hydrological cycle and the soil water balance. Water infiltration and the subse-quent redistribution of water in the subsurface are two im-portant processes that affect the soil water balance (Camp-bell, 1985; Hillel, 2013; Lal and Shukla, 2004; Morbidelli et al., 2011) and influence several soil processes and functions including availability of water and nutrients for plants, mi-crobial activity, erosion rates, chemical weathering, and soil thermal and gas exchange between the soil and the atmo-sphere (Campbell, 1985). Infiltration plays a definitive role in maintaining soil system functions and as it is a key pro-cess that controls several of the United Nations goals for sustainability (Keesstra et al., 2016). The generation of sur-face runoff, a key factor in controlling floods, is also directly related to the infiltration process. Water that cannot infil-trate in the soil becomes available for surface runoff. Two main mechanisms are responsible for the generation of cess water that produce overland flow: Dunne saturation ex-cess and Hortonian infiltration exex-cess (Sahoo et al., 2008). Dunne overland flow, or saturation excess, occurs when the soil profile is completely saturated and precipitation can no longer infiltrate into soil. The Dunne mechanism is more common to near-channel areas or is generated from partial areas of the hillslope where water tables are shallowest (Sa-hoo et al., 2008). On the other hand, Hortonian overland flow is characterized by rainfall intensities exceeding the infiltra-tion rate of the soil. In other words, during a rainfall event, water infiltration at the soil surface and runoff are highly de-pendent on the boundary conditions, namely, the rainfall in-tensity and the soil hydraulic properties. If the rainfall inten-sity is less than the soil infiltrability, water will completely infiltrate into the soil without any runoff (Hillel, 2013). In this case, the infiltration rate align with the rainfall intensity. Otherwise, if the precipitation intensity exceeds the soil infil-tration rate at a certain moment in time, excess water will be generated even if the soil profile is unsaturated. In this case water will pond on the soil surface and become available for surface runoff. If this occurs, the boundary condition at the soil surface undergoes a shift in the dominant flow process from one governed by capillary action to one governed by pressures of hydraulic head. Assuming that the water pres-sure heads remain constant at the soil surface, the infiltration rate is described by a decreasing function over time, tending towards the value of the hydraulic conductivity function for the water pressure head imposed at the soil surface (Angulo-Jaramillo et al., 2016; Chow et al., 1988). In the past decades, water infiltration tests, using either ponded or tension infil-trometers, have been developed to quantify the cumulative infiltration at the soil surface. In these cases, the 3-D axisym-metric water infiltration corresponds to an upper boundary
defined by a constant water pressure head or a series of con-stant water pressure heads. The infiltration process is quan-tified by determining the amount of water which infiltrates,
over time, from which the cumulative infiltration,I(t), (L),
and the infiltration rate,i(t), (L T−1) can be derived.i(t) and
I(t) are related to each other by derivation (Campbell, 1985;
Hillel, 2013; Lal and Shukla, 2004):
i(t)=dI(t)
dt . (1)
As stated above, the infiltration ratei(t) is expected to
de-crease to a plateau defined by the value of the hydraulic conductivity corresponding to the imposed water pressure head plus a term related to radial water infiltration (Angulo et al., 2016). In the case of large rings, the final infiltration rate approaches the value of the hydraulic conductivity corre-sponding to the imposed water pressure head (gravity flow). Consequently, if water ponding is imposed at the surface,
i(t) tends towards the saturated hydraulic conductivity.
In-filtration into the soil is controlled by several factors includ-ing soil properties (e.g., texture, bulk density, initial water content), layering, slope, cover condition (vegetation, crust, and/or stone), rainfall pattern (Smith et al., 2002; Corradini et al., 2017), and time. As soil texture and soil surface con-ditions (e.g., cover) are independent of time at the scale of individual infiltration events, these characteristics can be as-sumed to be constant during the event. On the other hand, soil structure, especially at the soil surface, can rapidly change, for instance, due to tillage, grazing, or the destruction of soil aggregates by rain drop impact. In dry soils, initial in-filtration rates are substantially higher than the saturated hy-draulic conductivity of the surface layer due to capillary ef-fects which control the sorptivity of the soil. However, as in-filtration proceeds, the gradient between the pressure head at the soil surface and the pressure head below the wetting front reduces over time so that the infiltration rate finally reaches a constant value that approximates saturated hydraulic con-ductivity (Chow et al., 1988).
of, for example, vegetation and land management on the pa-rameters of interest.
The Richards (1931) equation, Eq. (2), written as a func-tion of soil water content which is often referred to as the Fokker–Planck water diffusion equation, can be used to de-rive the closed-form expression of the infiltration rate in par-tially saturated soils.
∂θ ∂t =
∂ ∂z
Dz(θ)
∂θ
∂z+Kz(θ)
, (2)
whereθ is the volumetric soil water content (L3L−3);t is
the time (T);zis the vertical depth position (L);K(θ) is the
soil hydraulic conductivity (L T−1); andD(θ) is soil water
diffusivity (L2T−1), which is defined by Eq. (3) (Childs and
Collis-George, 1950; Klute, 1952):
Dz(θ)=Kz(θ)
∂h
∂θ, (3)
wherehis the matric potential in head units (L). The exact
relationships between soil water content, soil matric poten-tial, and soil hydraulic conductivity are necessary to solve the Richards equation. Several solutions of the Richards equa-tion and many empirical, conceptual, semi-analytical, and physically based models – e.g., Green and Ampt (1911), Philip (1957), Smith and Parlange (1978), Haverkamp et al. (1994), and Corradini et al. (2017) – have been introduced to describe the infiltration process over time, even for pref-erential flows, e.g., Lassabatere et al. (2014). Furthermore, several direct or indirect experimental systems have been in-troduced to measure soil infiltration in the laboratory or in the field under different conditions (Gupta et al., 1994; McKen-zie et al., 2002; Mao et al., 2008a). Data obtained from these systems can also be used to deduce soil saturated hydraulic conductivity directly.
Methods developed to measure and quantify water infiltra-tion in soil are generally time-consuming and costly. Thefore, PTFs have been developed and applied by many re-searchers – e.g., Jemsi et al. (2013), Parchami-Araghi et al. (2013), Kashi et al. (2014), Sarmadian and Taghizadeh-Mehrjardi (2014), and Rahmati (2017) – in order to easily parameterize infiltration models. However, these PTFs have been developed for specific regions, often limiting their ap-plicability. As already mentioned, a large number of publi-cations reporting soil infiltration data is available, but these data are dispersed in the literature and often difficult to ac-cess. Therefore, the aim of this data paper is to present and make available a collection of infiltration data digitized from available literature and from published or unpublished data provided directly by researchers around the world. These data are accompanied by metadata, which provide informa-tion about the locainforma-tion of the infiltrainforma-tion measurement, soil properties, and land management. Finally, we will provide some first results highlighting the suitability of the database for further research. The main article is also accompanied by
a supplement providing more detailed information about the different methodologies to measure soil infiltration. This is added because many of readers are likely not well versed in soil infiltration and its limitations in measurement and mod-eling. For more detailed information on this, readers could refer to Smith et al. (2002), Corradini et al. (2017), and Hop-mans et al. (2006).
2 Method and materials
2.1 Data collection
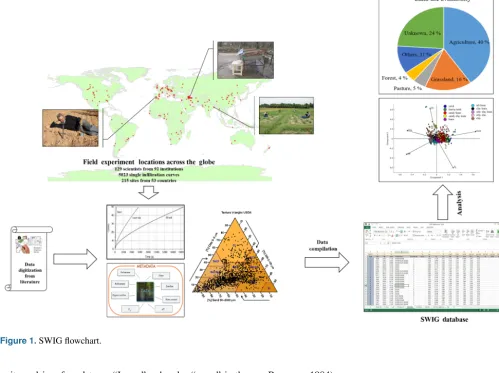
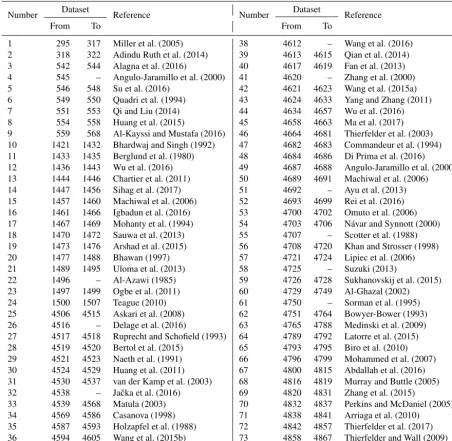
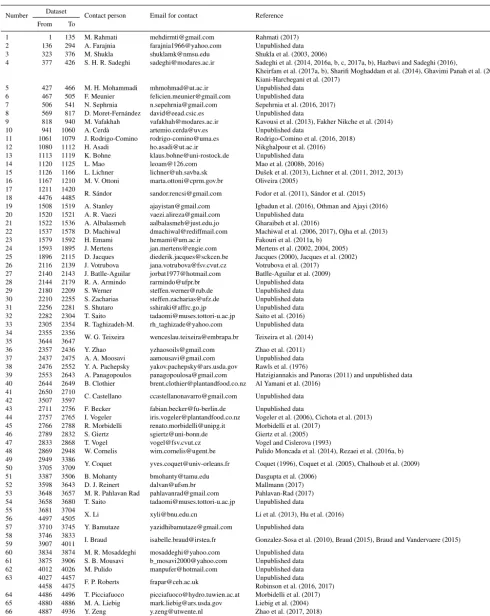
We collected infiltration measurements from different coun-tries or regions by contacting the data owners or by extract-ing infiltration data from published literature (Fig. 1). To do this, a data request was sent to potential data owners through different forums and email exchanges. The flyer asked data owners to cooperate in the development of the Soil Water In-filtration Global (SWIG) database by providing inIn-filtration data as well as metadata about experimental conditions (e.g., initial soil moisture content at the start of the experiment and method used), soil properties, land use, topography, ge-ographical coordinates of the sites, and any other relevant information to interpret the data and to increase the value of the database. Infiltration data reported in the literature were digitized and included in the database together with addi-tional information provided in these papers. The digitization approach is discussed in Sect. 2.2. In total, 5023 single infil-tration curves were collected, of which 510 infilinfil-tration curves were digitized from 74 published papers (Table 1) and 4513 were provided by 68 different research teams (Table 2), be-ing published or unpublished data. The references and corre-spondences for data supplied by direct communications with researchers are also reported in Table 2. Therefore, users may refer to these references for detailed information about the applied methods or procedures.
2.2 Data digitization
In order to digitize infiltration curves reported in the liter-ature, screenshots of the relevant plots were taken, and
fig-ures were imported into theplot digitizer 2.6.8(Huwaldt and
Steinhorst, 2015). First, the origin of the axes and the
high-estx andy values were defined and the diagram plane was
spanned. Then, all point values were picked out and an output
table with thex–ypairs (time vs. infiltration rate or
cumula-tive infiltration) was generated and stored.
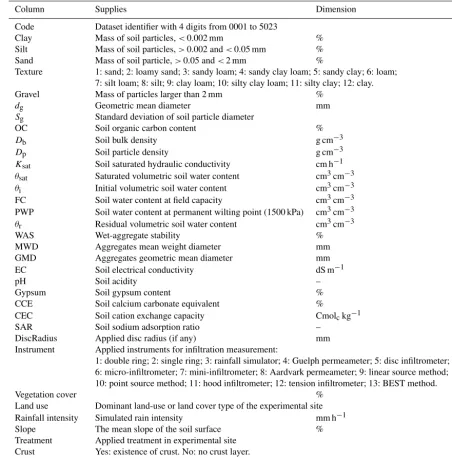
2.3 Database structure
Figure 1.SWIG flowchart.
units and is referred to as “Ixxxx”, whereby “xxxx” is the identifier of the individual infiltration test. The correspond-ing time intervals in hours for the infiltration data are la-beled “T_Hour” and named “Txxxx”. The constant or vary-ing pressure or tension heads (if any) durvary-ing infiltration mea-surements are also reported in another dataset named “Ten-sion_cm”. The database also contains additional variables and information relevant to the infiltration data provided by data owners or digitized from articles, as listed in Table 3, and which is labeled “Metadata”. Additional soil proper-ties were determined by different standards; therefore, data harmonization might be needed for some of those, espe-cially in the case of water content at field capacity, pH, or wet-aggregate stability. Further information on measurement methods is available from references of the data. Since the
geometric mean diameter (dg) and standard deviation (Sg)
of soil particle sizes are rarely measured, both parameters were computed using the following equations (Shirazi and
Boersma, 1984):
dg=exp (a), a=0.01
n
X
i=1
filnDi, (4)
Sg=exp (b), b2=0.01
n
X
i=1
filn2Di−a2, (5)
wherefi is the percent of total soil mass having diameters
equal to or less than the arithmetic mean of interval limits
(Di) that define three main fractions (i) of clay, silt, and
sand with mean values of 0.001, 0.026, and 1.025 mm, re-spectively. For the infiltration data, where the soil texture is
unknown, dg andSg could not be calculated and the data
Table 1.References used to extract infiltration curves and metadata.
Number Dataset Reference Number Dataset Reference
From To From To
1 295 317 Miller et al. (2005) 38 4612 – Wang et al. (2016)
2 318 322 Adindu Ruth et al. (2014) 39 4613 4615 Qian et al. (2014)
3 542 544 Alagna et al. (2016) 40 4617 4619 Fan et al. (2013)
4 545 – Angulo-Jaramillo et al. (2000) 41 4620 – Zhang et al. (2000)
5 546 548 Su et al. (2016) 42 4621 4623 Wang et al. (2015a)
6 549 550 Quadri et al. (1994) 43 4624 4633 Yang and Zhang (2011)
7 551 553 Qi and Liu (2014) 44 4634 4657 Wu et al. (2016)
8 554 558 Huang et al. (2015) 45 4658 4663 Ma et al. (2017)
9 559 568 Al-Kayssi and Mustafa (2016) 46 4664 4681 Thierfelder et al. (2003) 10 1421 1432 Bhardwaj and Singh (1992) 47 4682 4683 Commandeur et al. (1994) 11 1433 1435 Berglund et al. (1980) 48 4684 4686 Di Prima et al. (2016)
12 1436 1443 Wu et al. (2016) 49 4687 4688 Angulo-Jaramillo et al. (2000)
13 1444 1446 Chartier et al. (2011) 50 4689 4691 Machiwal et al. (2006)
14 1447 1456 Sihag et al. (2017) 51 4692 – Ayu et al. (2013)
15 1457 1460 Machiwal et al. (2006) 52 4693 4699 Rei et al. (2016)
16 1461 1466 Igbadun et al. (2016) 53 4700 4702 Omuto et al. (2006)
17 1467 1469 Mohanty et al. (1994) 54 4703 4706 Návar and Synnott (2000)
18 1470 1472 Sauwa et al. (2013) 55 4707 – Scotter et al. (1988)
19 1473 1476 Arshad et al. (2015) 56 4708 4720 Khan and Strosser (1998)
20 1477 1488 Bhawan (1997) 57 4721 4724 Lipiec et al. (2006)
21 1489 1495 Uloma et al. (2013) 58 4725 – Suzuki (2013)
22 1496 – Al-Azawi (1985) 59 4726 4728 Sukhanovskij et al. (2015)
23 1497 1499 Ogbe et al. (2011) 60 4729 4749 Al-Ghazal (2002)
24 1500 1507 Teague (2010) 61 4750 – Sorman et al. (1995)
25 4506 4515 Askari et al. (2008) 62 4751 4764 Bowyer-Bower (1993)
26 4516 – Delage et al. (2016) 63 4765 4788 Medinski et al. (2009)
27 4517 4518 Ruprecht and Schofield (1993) 64 4789 4792 Latorre et al. (2015)
28 4519 4520 Bertol et al. (2015) 65 4793 4795 Biro et al. (2010)
29 4521 4523 Naeth et al. (1991) 66 4796 4799 Mohammed et al. (2007)
30 4524 4529 Huang et al. (2011) 67 4800 4815 Abdallah et al. (2016)
31 4530 4537 van der Kamp et al. (2003) 68 4816 4819 Murray and Buttle (2005)
32 4538 – Jaˇcka et al. (2016) 69 4820 4831 Zhang et al. (2015)
33 4539 4568 Matula (2003) 70 4832 4837 Perkins and McDaniel (2005)
34 4569 4586 Casanova (1998) 71 4838 4841 Arriaga et al. (2010)
35 4587 4593 Holzapfel et al. (1988) 72 4842 4857 Thierfelder et al. (2017)
36 4594 4605 Wang et al. (2015b) 73 4858 4867 Thierfelder and Wall (2009)
37 4606 4611 Mao et al. (2016) 74 4868 4879 Abagale et al. (2012)
3 Results and discussion
3.1 Spatial and temporal data coverage
The SWIG database (Rahmati et al., 2018) consists of 5023 soil water infiltration measurements spread over nearly all continents (Fig. 2). Data were derived from 54 countries (Ta-ble 4). The largest number of data sources were provided by
scientists in Iran (n=38), China (n =23), and the USA
(n =15), whereby one data source might contain several
water infiltration measurements. The SWIG database covers measurements from 1976 to 2017. A sparse coverage was ob-tained for the higher latitudes of the Northern Hemisphere
(above 60◦) including Norway, Finland, Sweden, Iceland,
sys-Table 2.References and correspondence for data supplied by data owners.
Number Dataset Contact person Email for contact Reference From To
1 1 135 M. Rahmati [email protected] Rahmati (2017) 2 136 294 A. Farajnia [email protected] Unpublished data 3 323 376 M. Shukla [email protected] Shukla et al. (2003, 2006)
4 377 426 S. H. R. Sadeghi [email protected] Sadeghi et al. (2014, 2016a, b, c, 2017a, b), Hazbavi and Sadeghi (2016),
Kheirfam et al. (2017a, b), Sharifi Moghaddam et al. (2014), Ghavimi Panah et al. (2017), Kiani-Harchegani et al. (2017)
5 427 466 M. H. Mohammadi [email protected] Unpublished data 6 467 505 F. Meunier [email protected] Unpublished data 7 506 541 N. Sephrnia [email protected] Sepehrnia et al. (2016, 2017) 8 569 817 D. Moret-Fernández [email protected] Unpublished data
9 818 940 M. Vafakhah [email protected] Kavousi et al. (2013), Fakher Nikche et al. (2014) 10 941 1060 A. Cerdà [email protected] Unpublished data
11 1061 1079 J. Rodrigo-Comino [email protected] Rodrigo-Comino et al. (2016, 2018) 12 1080 1112 H. Asadi [email protected] Nikghalpour et al. (2016) 13 1113 1119 K. Bohne [email protected] Unpublished data 14 1120 1125 L. Mao [email protected] Mao et al. (2008b, 2016)
15 1126 1166 L. Lichner [email protected] Dušek et al. (2013), Lichner et al. (2011, 2012, 2013) 16 1167 1210 M. V. Ottoni [email protected] Oliveira (2005)
17 1211 1420
R. Sándor [email protected] Fodor et al. (2011), Sándor et al. (2015) 18 4476 4485
19 1508 1519 A. Stanley [email protected] Igbadun et al. (2016), Othman and Ajayi (2016) 20 1520 1521 A. R. Vaezi [email protected] Unpublished data
21 1522 1536 A. Albalasmeh [email protected] Gharaibeh et al. (2016)
22 1537 1578 D. Machiwal [email protected] Machiwal et al. (2006, 2017), Ojha et al. (2013) 23 1579 1592 H. Emami [email protected] Fakouri et al. (2011a, b)
24 1593 1895 J. Mertens [email protected] Mertens et al. (2002, 2004, 2005) 25 1896 2115 D. Jacques [email protected] Jacques (2000), Jacques et al. (2002) 26 2116 2139 J. Votrubova [email protected] Votrubova et al. (2017)
27 2140 2143 J. Batlle-Aguilar [email protected] Batlle-Aguilar et al. (2009) 28 2144 2179 R. A. Armindo [email protected] Unpublished data 29 2180 2209 S. Werner [email protected] Unpublished data 30 2210 2255 S. Zacharias [email protected] Unpublished data 31 2256 2281 S. Shutaro [email protected] Unpublished data 32 2282 2304 T. Saito [email protected] Saito et al. (2016) 33 2305 2354 R. Taghizadeh-M. [email protected] Unpublished data 34 2355 2356
W. G. Teixeira [email protected] Teixeira et al. (2014) 35 3644 3647
36 2357 2436 Y. Zhao [email protected] Zhao et al. (2011) 37 2437 2475 A. A. Moosavi [email protected] Unpublished data 38 2476 2552 Y. A. Pachepsky [email protected] Rawls et al. (1976)
39 2553 2643 A. Panagopoulos [email protected] Hatzigiannakis and Panoras (2011) and unpublished data 40 2644 2649 B. Clothier [email protected] Al Yamani et al. (2016)
41 2650 2710
C. Castellano [email protected] Unpublished data 42 3507 3597
43 2711 2756 F. Becker [email protected] Unpublished data
44 2757 2765 I. Vogeler [email protected] Vogeler et al. (2006), Cichota et al. (2013) 45 2766 2788 R. Morbidelli [email protected] Morbidelli et al. (2017)
46 2789 2832 S. Giertz [email protected] Giertz et al. (2005) 47 2833 2868 T. Vogel [email protected] Vogel and Cislerova (1993)
48 2869 2948 W. Cornelis [email protected] Pulido Moncada et al. (2014), Rezaei et al. (2016a, b) 49 2949 3386
Y. Coquet [email protected] Coquet (1996), Coquet et al. (2005), Chalhoub et al. (2009) 50 3705 3709
51 3387 3506 B. Mohanty [email protected] Dasgupta et al. (2006) 52 3598 3643 D. J. Reinert [email protected] Mallmann (2017) 53 3648 3657 M. R. Pahlavan Rad [email protected] Pahlavan-Rad (2017) 54 3658 3680 T. Saito [email protected] Unpublished data 55 3681 3704
X. Li [email protected] Li et al. (2013), Hu et al. (2016) 56 4497 4505
57 3710 3745 Y. Bamutaze [email protected] Unpublished data 58 3746 3833
I. Braud [email protected] Gonzalez-Sosa et al. (2010), Braud (2015), Braud and Vandervaere (2015) 59 3907 4011
60 3834 3874 M. R. Mosaddeghi [email protected] Unpublished data 61 3875 3906 S. B. Mousavi [email protected] Unpublished data 62 4012 4026 M. Pulido [email protected] Unpublished data 63 4027 4457
F. P. Roberts [email protected] Unpublished data 4458 4475 Robinson et al. (2016, 2017) 64 4486 4496 T. Picciafuoco [email protected] Morbidelli et al. (2017) 65 4880 4886 M. A. Liebig [email protected] Liebig et al. (2004) 66 4887 4936 Y. Zeng [email protected] Zhao et al. (2017, 2018)
Table 3.Description of the variables listed in the database.
Column Supplies Dimension
Code Dataset identifier with 4 digits from 0001 to 5023
Clay Mass of soil particles,<0.002 mm %
Silt Mass of soil particles,>0.002 and<0.05 mm % Sand Mass of soil particle,>0.05 and<2 mm %
Texture 1: sand; 2: loamy sand; 3: sandy loam; 4: sandy clay loam; 5: sandy clay; 6: loam; 7: silt loam; 8: silt; 9: clay loam; 10: silty clay loam; 11: silty clay; 12: clay.
Gravel Mass of particles larger than 2 mm %
dg Geometric mean diameter mm
Sg Standard deviation of soil particle diameter
OC Soil organic carbon content %
Db Soil bulk density g cm−3
Dp Soil particle density g cm−3
Ksat Soil saturated hydraulic conductivity cm h−1
θsat Saturated volumetric soil water content cm3cm−3
θi Initial volumetric soil water content cm3cm−3
FC Soil water content at field capacity cm3cm−3
PWP Soil water content at permanent wilting point (1500 kPa) cm3cm−3
θr Residual volumetric soil water content cm3cm−3
WAS Wet-aggregate stability %
MWD Aggregates mean weight diameter mm
GMD Aggregates geometric mean diameter mm
EC Soil electrical conductivity dS m−1
pH Soil acidity –
Gypsum Soil gypsum content %
CCE Soil calcium carbonate equivalent %
CEC Soil cation exchange capacity Cmolckg−1
SAR Soil sodium adsorption ratio –
DiscRadius Applied disc radius (if any) mm
Instrument Applied instruments for infiltration measurement:
1: double ring; 2: single ring; 3: rainfall simulator; 4: Guelph permeameter; 5: disc infiltrometer; 6: micro-infiltrometer; 7: mini-infiltrometer; 8: Aardvark permeameter; 9: linear source method; 10: point source method; 11: hood infiltrometer; 12: tension infiltrometer; 13: BEST method.
Vegetation cover %
Land use Dominant land-use or land cover type of the experimental site
Rainfall intensity Simulated rain intensity mm h−1
Slope The mean slope of the soil surface %
Treatment Applied treatment in experimental site Crust Yes: existence of crust. No: no crust layer.
Sand contact layer Yes: sand contact layer is applied during infiltration measurement. No: no sand contact layer.
tem (Fig. 4), in total, 35 WRB reference soil subgroups are included among experimental sites, where 55 % of the ex-perimental sites comprised four subgroup classes of Hap-lic Acrisols (8 %), HapHap-lic Luvisols (11 %), HapHap-lic Calcisols (15 %), and Haplic Cambisols (21 %). A total of 29 soil sub-orders classes of USDA soil taxonomy are included in this study (Fig. 5) with Udalfs (9 %), Orthents (9 %), and Ustolls (9 %). Thus, the wide spatial and temporal distribution of in-filtration data from this database provides a comprehensive view of the infiltration characteristics of many soils in the world which can be used in future studies.
3.2 Analysis of the database using soil properties Textural information (clay, silt, and sand content) is available
for 3842 out of 5023 collected infiltration curves (∼76 %).
Figure 2.Global distribution of infiltration measuring sites that were included in the database.
Figure 3.Number of samples by Köppen–Geiger climatic zones (Rubel et al., 2017; Kottek et al., 2006).
content (Poesen, 2018). Loam, sandy loam, silty loam, and clay loam contributed with 19, 18, 14, and 13 % (Table 5) to the infiltration measurements, respectively. Table 5 shows that infiltration measurements are almost equally distributed among textures when these are categorized in three major classes: course- (1092), medium- (1238), and fine- to moder-ately fine-textured soils (1447). Table 6 reports on the soil properties that are available in the SWIG database and it gives some simple statistics such as mean, minimum, max-imum, median, and coefficient of variation. Bulk density (available for 66 % of infiltration measurements) and organic carbon content (available for 62 % of infiltration measure-ments) are two other soil properties besides texture that have the highest frequency of availability. Saturated hydraulic conductivity, initial soil water content, saturated soil water content, calcium carbonate equivalent, electrical conductiv-ity, and pH are available in 22 to 38 % of infiltration data. The other soil properties have a frequency lower than 10 %.
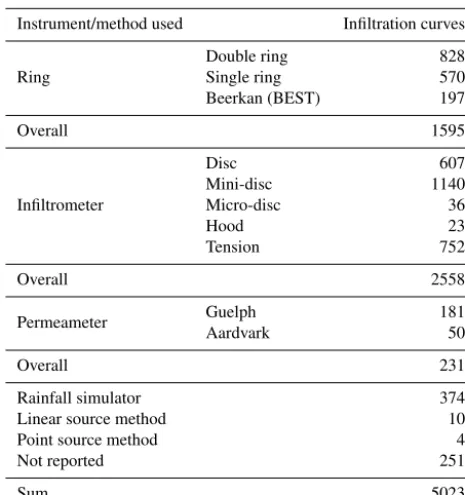
3.3 Infiltration measurements in the SWIG database Different instruments were used to measure soil water infil-tration (Table 8). About 32 % (1595 out of 5023) of the mea-surements were carried out using different types of ring in-filtrometers. The most frequently used methods are the disc infiltrometer methods (disc, mini-disc, and micro-disc, hood, and tension infiltrometers), which have been used in about 51 % of the experiments. About 5 % of the data were sub-mitted to the database without specifying the measurement method (251 infiltration tests) and around 12 % of the mea-surements were carried out with other methods not listed above (Table 7).
3.4 Land use classes represented in the SWIG database
Wa-Table 4.Countries and the number of data sources (n) contributing to the database.
Country n Country n
Iran 38 Slovakia 2
China 23 South Africa 2
USA 15 Sudan 2
Brazil 9 Zambia 2
Spain 9 Argentina 1
France 9 Australia 1
Germany 8 Benin 1
India 8 Cameroon 1
Canada 7 Colombia 1
United Kingdom 7 Indonesia 1
Hungary 6 Iraq 1
Nigeria 6 Japan 1
Greece 5 Jordan 1
Belgium 4 Kenya 1
Italy 4 Lebanon 1
Czech Republic 3 Malawi 1
Saudi Arabia 3 Mexico 1
Australia 2 Mozambique 1
Austria 2 Myanmar 1
Chile 2 Netherland 1
Ghana 2 Poland 1
Morocco 2 Scotland 1
Namibia 2 Tanzania 1
New Zealand 2 Telangana 1
Pakistan 2 UAE 1
Russia 2 Uganda 1
Senegal 2 Zimbabwe 1
Table 5.Number of soils in each soil USDA textural class for which infiltration data are included in the database.
Group Soil texture class Availability Coarse-textured soils 1092
Sand 291
Loamy sand 111
Sandy loam 690
Medium-textured soils 1238
Loam 716
Silt loam 522
Silt 0
Fine- to moderately
1476 fine-textured soil
Clay loam 514
Clay 352
Silty clay loam 253
Sandy clay loam 226
Silty clay 131
Sandy clay 0
Figure 4.Frequency of WRB reference soil subgroups in experi-mental sites derived from SoilGrids (Hengl et al., 2017).
Figure 6.Textural distribution of soils(c)and probability density functions of clay(a)and sand(b)particles (plotted on the USDA textural triangle) for which infiltration data are included in the database. Dots are colored according to their corresponding land use. HCl: highly clayey; SiCl: silty clay; Cl: clay; SiClLo: silty clay loam; ClLo: clay loam; SaCl: sandy clay; SaClLo: sandy clay loam; L: loam; Si: silty; SiLo: silty loam; SaLo: sandy loam; LoSa: loamy sand; and Sa: sandy.
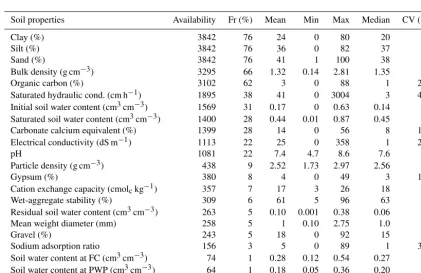
Table 6. Soil properties, number of data entries in the database (out of 5023 soil water infiltration curves in total), and their statistical description.
Soil properties Availability Fr (%) Mean Min Max Median CV (%)
Clay (%) 3842 76 24 0 80 20 64
Silt (%) 3842 76 36 0 82 37 52
Sand (%) 3842 76 41 1 100 38 63
Bulk density (g cm−3) 3295 66 1.32 0.14 2.81 1.35 20
Organic carbon (%) 3102 62 3 0 88 1 200
Saturated hydraulic cond. (cm h−1) 1895 38 41 0 3004 3 426
Initial soil water content (cm3cm−3) 1569 31 0.17 0 0.63 0.14 68
Saturated soil water content (cm3cm−3) 1400 28 0.44 0.01 0.87 0.45 24
Carbonate calcium equivalent (%) 1399 28 14 0 56 8 101
Electrical conductivity (dS m−1) 1113 22 25 0 358 1 249
pH 1081 22 7.4 4.7 8.6 7.6 12
Particle density (g cm−3) 438 9 2.52 1.73 2.97 2.56 9
Gypsum (%) 380 8 4 0 49 3 137
Cation exchange capacity (cmolckg−1) 357 7 17 3 26 18 21
Wet-aggregate stability (%) 309 6 61 5 96 63 37
Residual soil water content (cm3cm−3) 263 5 0.10 0.001 0.38 0.06 86
Mean weight diameter (mm) 258 5 1 0.10 2.75 1.0 54
Gravel (%) 243 5 18 0 92 15 84
Sodium adsorption ratio 156 3 5 0 89 1 351
Soil water content at FC (cm3cm−3) 74 1 0.28 0.12 0.54 0.27 34
Soil water content at PWP (cm3cm−3) 64 1 0.18 0.05 0.36 0.20 47
Geometric mean diameter (mm) 73 1 0.6 0.4 0.8 0.6 18
Table 7.Instruments used to measure soil infiltration curves.
Instrument/method used Infiltration curves
Double ring 828
Ring Single ring 570
Beerkan (BEST) 197
Overall 1595
Disc 607
Mini-disc 1140
Infiltrometer Micro-disc 36
Hood 23
Tension 752
Overall 2558
Permeameter Guelph 181
Aardvark 50
Overall 231
Rainfall simulator 374
Linear source method 10
Point source method 4
Not reported 251
Sum 5023
Table 8.Number of infiltration curves with a given land use type.
Land use n Land use n
Agriculture 2019 Vineyards 22
Grassland 821 Upland 11
Pasture 229 Pure sand 10
Forest 204 Brushwood 6
Garden 152 Road 5
Bare 99 Agro-pastoral 4
Urban soils 82 Park 3
Savannah 41 Salt-marsh soil 3
Abandoned farms 39 Afforestation 2
Idle 32 Campus 2
Shrub 30 Residential 2
Available 3818 Unknown 1205
terloo et al., 2007). Consequently, we collected information on the type of land use at all experimental sites where avail-able. In general, the type of land use was reported in 3818 out
of 5023 infiltration curves (∼76 %) and this information is
reported in the Metadata dataset. For simplicity, we grouped all reported land use types into 22 major groups (Table 8). A frequency analysis showed that agricultural land use, i.e., cropped land, irrigated land, dryland, and fallow land, is the most frequently reported land use in the database with about 53 % (2019 out of 3818) of all land uses. With 22 %, grass-lands are the second most frequently represented land use type. Pasture with 6 % and forest with 5 % are ranked as the third- and fourth-largest reported land use types. The 18
re-maining land use types all together cover only 545 experi-mental sites (less than 15 %).
3.5 Estimating infiltration parameters from infiltration measurements
In order to predict infiltration parameters from infiltration measurements, we classified the SWIG database infiltration curves in two groups: (i) infiltration curves that were ob-tained under the assumption of 1-D infiltration and (ii) infil-tration curves that were obtained under 3-D flow conditions. We fitted the three-parameter infiltration equation of Philip (Kutílek and Krejˇca, 1987), Eq. (6), to the 1-D experimen-tal data and the simplified form of Haverkamp et al. (1994), Eq. (7), to the 3-D experimental data:
I1-D=S t
1
2+A1t+A2t
3
2, (6)
I3-D=S √
t+ 2−
β
3 Ksat+
γ S2 RD(θs−θi)
t. (7)
We reduced the number of parameters in Eq. (6) by defining
A1=0.33×Ksat(Philip, 1957) andA2=AwhereAwas
as-sumed to be a constant. In Eq. (7), we putβ=0.6
(Angulo-Jaramillo et al., 2000) and the second term between brackets on the right-hand side was assumed to be a constant. There-fore, we simplified the equations as follows:
I1-D=S t
1
2+0.33Ksatt+A t
3
2, (8)
I3-D=S √
t+0.47Ksatt+A t. (9)
In our analysis, we assumed that double-ring infiltrometer measurements result in 1-D infiltration conditions, while the different types of disc infiltration and single-ring infiltrom-eter measurements lead to 3-D flow conditions that can be captured by Eq. (9). As 1-D or 3-D infiltration conditions are not guaranteed for measurements made with rainfall simula-tors, Guelph permeameters, Aardvark permeameters, linear and point source methods, and hood infiltrometer measure-ments, these infiltration curves were not considered in our first analysis. By excluding these methods, 596 infiltration curves were excluded from the fitting to Eqs. (8) and (9). In addition, 251 infiltration curves were also excluded from the fitting to Eqs. (8) and (9) as no indication was available on the measurement method used. In total, 4178 infiltration curves were included in our analysis, of which 828 infiltra-tion curves reflected 1-D and 3350 were considered as the results of 3-D infiltration. As no sufficient information was available on the properties of the sand contact layer, we did not correct 3-D infiltration measurements. Finally, the se-lected infiltration curves were fitted to Eq. (8) or (9) using
the lsqnonlin command in Matlab™.
The fitting results of Eq. (8) to the single infiltrometer data
are shown in Table 9.R2values were higher than 0.9 in 97 %
of the cases and higher than 0.99 in 77 % of the cases. Fitting
than 0.9 and 0.99 were obtained in 94 and 68 % of the cases, respectively. The statistics for the fitting process as well as the fitted parameters of two mentioned models are reported in the SWIG database in an additional dataset labeled “Statis-tics”. For infiltration curves excluded from the analysis, an empty cell is reported.
The average values of estimated Ksat and sorptivity (S),
using Eq. (8) or (9) as well as measured Ksat for different
soil texture classes extracted from the current database, are
reported in Table 10. The measured values ofKsatwere
ob-tained by other means by the contributors and tabulated in the
SWIG database. More detailed information of howKsatwas
calculated in individual cases can be found in the references linked to those data points. Comparison between estimated (Ksat-es) and measured (Ksat-m) values ofKsat(Table 10) re-veals that there is reasonably good agreement between mea-surements and estimation, except for loamy sand (with mean
Ksat-es=62 cm h−1 vs. Ksat-m=25 cm h−1), sandy loam
(with meanKsat-es=32 cm h−1vs.Ksat-m=41 cm h−1), silt
loam (with meanKsat-es=27 cm h−1vs.Ksat-m=3 cm h−1),
and silty clay (with mean Ksat-es=26 cm h−1 vs.Ksat-m=
45 cm h−1) textural classes. However, the only significant
difference between measured and estimatedKsatvalues was
found for the silt loam textural class (Table 10) applying an
independentt test.
We also compared our estimatedKsatvalues from the
in-filtration measurements from the SWIG database with Ksat
values from databases that have been published in the
litera-ture (Table 11). The validity of our estimatedKsatvalues is
confirmed by comparing the order of magnitude of the dif-ference between these values, and those tabulated in previ-ous studies, for the variprevi-ous different soil classes. Some of these databases like that of Clapp and Hornberger (1978) and Cosby et al. (1984) have been used to parameterize land
sur-face models. Most of the Ksatvalues in the listed databases
have been obtained from laboratory-scale measurements of-ten performed on disturbed soil samples. In most of the
re-ported databasesKsatis controlled by texture, with the
high-est mean values obtained for the coarse-textured soils and the lowest mean values for the fine-textured soils. This is
not the case for the Ksat values obtained from the SWIG
database. Clayey soils have a mean value that is similar to the coarser textured soils. This may be partly explained by the fact that the measurements collected in the SWIG database are obtained from field measurements on undisturbed soils.
It was observed that the standard deviation of Ksat in the
SWIG database is typically larger than the standard devia-tions obtained from the databases in the literature. This indi-cates that texture is apparently not the most important
con-trol onKsatvalues. However, one would also pose that much
of the lack of correlation between soil texture and predicted
Ksat from the SWIG database is related to the lack of soil
structural information, such as macro porosity quantification or other possible soil attributes. Indeed, many of the datasets presented in our paper on saturated and near-saturated flow
can be used to infer the state of the soil’s structure, namely its macroporosity, by using the slope of the near-saturated conductivity curve, via Philip’s “flow-weighted mean pore-size” analysis. White and Sully (1987) have discussed this in a great detail. Zhang et al. (2015) is another example of where tension infiltrometers can be used to describe the temporal dynamics of the macroporosity which character-izes soil structure. This could inspire researchers to collect such information when conducting additional soil infiltration measurements and include this in the database in the future. This finding indicates that present parameterization in cur-rent land surface models, which are mainly based on texture,
may severely underestimate the variability ofKsat. In
addi-tion, it shows that also mean values are not dominantly con-trolled by textural properties. Other land surface properties such as land use and crusting may, in fact, be much more important.
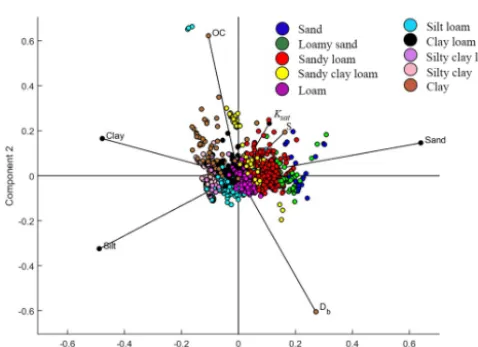
3.6 Exploring the SWIG database using principal component analysis
In order to demonstrate the potential of the SWIG database for analyzing infiltration data and for developing pedotrans-fer functions, principal component analysis (PCA) was per-formed and biplots were generated to show both the obser-vations and the original variables in the principal component space (Gabriel, 1971).
In a biplot, positively correlated variables are closely aligned with each other and the larger the arrows the stronger the correlation. Arrows that are aligned in opposite directions are negatively correlated with each other and the magnitude of the arrows is again a measure of the strength of the
corre-lation. Arrows that are aligned 90◦to each other show
typi-cally no correlation. Figures 7 and 8 show the results of two PCAs. The first PCA (Fig. 7) shows the relationship between
soil textural properties,SandKsat, based on 3267 infiltration
measurements. The first two principal components explain 74.5 % of the variability in the data. Figure 7 shows a
pos-itive correlation betweenKsatandS (0.527) and the largest
values for both variables are found in clay soils. Clay content
appears to only be weakly correlated withKsat andS as is
also shown by the correlation coefficients of 0.112 and 0.025, respectively. Figure 8 shows the biplot of soil textural
prop-erties withKsat,S, organic carbon content, and bulk density
in the principal component space – based on 1910 infiltra-tion measurements. The first two principal components still
explain 55 % of the variability. NeitherS norKsat showed
appreciable correlations with available soil properties. Only
KsatandSare correlated (arrows are aligned but small) with
a value of 0.29. Organic carbon and bulk density show a
neg-ative correlation with a calculated value equal to−0.51. It
informa-Table 9.Accuracy analysis of empirical models fitted to experimental data of infiltration.
Infiltration type n R
2 RMSE (cm)
R2>0.90 R2>0.99
Mean Min Max SD Mean Min Max SD
1-D 828 0.985 0.529 1 0.049 0.900 1.3×10⁻⁴ 69.30 3.31 801 640
3-D 3350 0.975 0.032 1 0.066 0.449 5.5×10⁻¹² 98.95 2.95 3136 2276
All 4178 0.977 0.032 1 0.063 0.538 5.5×10⁻¹² 98.95 3.03 3937 2916
SD: standard deviation.
Table 10.Estimated or measured average values of infiltration parameters for different textural classes extracted from the current database.
Texture class Measured
Independentttest
Estimated by Eq. (8) or (9) between measured
and estimatedKsat
na S(cm h
−0.5) K
sat(cm h−1) na Ksat(cm h−1) df tvalue
Mean Median SD Mean Median SD Mean Median SD
Sand 291 2.3 0.26 4.3 42.2 15 134.5 229 43.6 24 149 518 0.10b
Loamy sand 92 10.6 5.7 17.5 61.4 10 173.2 63 24.6 8.2 72 153 1.59b
Sandy loam 500 9.2 2.95 15.7 32 3.1 94.5 424 41.2 5.7 166 922 1.05b
Silt loam 409 9.4 1.5 19.1 26.5 1.7 61.7 165 2.9 0.96 5.1 572 4.90c
Loam 583 7.9 2.4 12.9 7.8 0.28 26.7 270 4.9 1.18 13.7 851 1.69b
Sandy clay loam 185 5.9 2.1 8.6 7.4 1.4 12.8 84 5.4 2.24 6.9 267 1.35b
Silty clay loam 250 3.2 0.64 12.5 10.6 1.7 24.1 64 12.3 2.42 63.2 312 0.32b
Clay loam 467 6.8 2.1 13.6 8.3 2.3 20 166 7.6 2.97 21.3 631 0.38b
Sandy clay – – – – – – – – – – – – –
Silty clay 121 7.7 2.2 13.4 26.2 7.8 61.5 54 44.8 6.97 88.2 173 1.59b
Clay 333 14.6 1.7 39.5 354.3 1.3 1268.5 79 148.8 2.94 458.4 410 1.42b
Silt – – – – – – – – – – – – –
Total 4179 8.5 2.6 18.2 46 1.8 374.8 1895 41 3.4 174 – –
aThe number soils included in calculation.bns: insignificant;c**: significant at 1 % probability level. SD: standard deviation.
tion to properly estimate Ksat andS. However, the SWIG
database provides additional information such as land use, initial water content, and slope that might prove to be good predictors. A further analysis in this respect is however be-yond the scope of this paper. More importantly, the present analysis in combination with the results provided in Table 11
shows that a texture-dominated derivation ofKsatvalues, as
implemented in most land surface models, does not provide
adequate means to estimateKsat.
Figure 8.The relationships between clay, silt, sand contents,Db,
and OC and estimated hydraulic parameters (SandKsat).
3.7 Potential error and uncertainty in the SWIG database
Similar to any other databases, the data presented in the SWIG database may be subject to different error sources and uncertainties. These include (1) transcription errors that oc-curred when implementing the measurement data into the EXCEL spreadsheets, (2) inaccuracy and uncertainties in de-termining related soil properties such as textural properties, (3) violation of the underlying assumption when performing the experiments, and (4) uncertainty (variability) in estimated soil hydraulic properties due to the different measurement methods. Unfortunately, none of these errors or uncertainty sources are under the control of the SWIG database authors, and quantification of these sources is often difficult, since the required information is often lacking. The uncertainty and variability related to the applied measurement techniques for estimated soil hydraulic properties may be assessed as infor-mation on the applied techniques is available; however, some of these methods may only have been used in few cases, mak-ing a statistical analysis difficult.
With respect to the transcription error, a strong effort has been made to double-check data transcription to prevent or at least to minimize any probable error of this nature. Val-ues of soil properties such as textural composition are known to vary strongly between different laboratories and measure-ment methods. This is especially true for the finer textural classes like clay. Unfortunately, information on the measure-ment used to determine soil properties is mostly lacking or insufficient to assess the magnitude of errors or biases. Inter-nationally, there are a number of standard methods used to measure soil properties and several methods may have been applied to measure the reported soil properties. In this regard, no conversion has been made and only raw data are reported in the database. However, we have supplied the references for all data (where available) that can be used to ascertain
which methodologies were used, if so desired. Although sup-plying such information for each soil property may facilitate the use of the database, it would have required considerable additional work that could not be performed at this stage of development. Such additions could form the basis of a sec-ond version of the database that any readers should feel free to commence.
The uncertainty with respect to the effect of measurement techniques on quantifying the infiltration process itself may be analyzed from the SWIG database as it provides informa-tion on the type of measurement technique used. This analy-sis is again beyond the scope of this paper. Potential error and uncertainty sources with respect to the use of different mea-surements are discussed in the Supplement. The uncertainty of estimated soil hydraulic properties from infiltration mea-surements may be strongly controlled by the person perform-ing the experiment but may also be due the different mea-surement windows of the methods in terms of meamea-surement volume. The SWIG database provides information to quan-tify uncertainties introduced by difference in measurement volume and this analysis will be closely related to the assess-ment of the representative eleassess-mentary volume, REV (see, for example, the work of Pachepsky on the scaling of saturated hydraulic conductivity).
Careful interpretation of the data, with respect to the de-tails of the experimental and soil conditions, is also required when utilizing the SWIG database. For instance, the cases of soils coded 1211–1420 may at first seem odd, as they display very low infiltration rates for soils of a very high
(>95 %) sand content; however, these unusual findings are
explained by the soils being recorded as displaying water re-pellant characteristics. Another example is estimated values
ofKsatfrom clayey soils showing high values ofKsat(e.g.,
soils coded 3746 to 3833 in the SWIG database). TheKsat
values for these soils were obtained using the single-ring in-filtrometer method (Gonzalez-Sosa et al., 2010; Braud, 2015; Braud and Vandervaere, 2015) and were conducted in the field under ponded conditions, with vegetation cut but roots left in place. Macropores could have been activated, leading to an infiltration rate much higher than expected for clayey soils. There were also instances of very high values being obtained for forested land uses, and sometimes for grassland, which is probably explained by the visible cracks in the soil surface present in those cases
3.8 Research potentials of the SWIG database
in-filtration from land surface models, (6) study more complex processes like preferential flow in soils, and (7) highlight the state-of-the-art understanding of the relationships between infiltration and several soil surface characteristics; for exam-ple, the SWIG database has already contributed to the scope of Morbidelli et al. (2018) to advance the knowledge of infil-tration over sloping surfaces.
We are confident that the SWIG database is just a first step in collecting and archiving infiltration data and we ex-pect that increasing amounts of data will become avail-able in the near future. These data will be archived in the SWIG database and thus made available to the world-wide research community. In this regard, we are interested in receiving existing or newly measured infiltration curves and for this purpose the corresponding author will serve as point of contact or data can be made available through the International Soil Modeling Consortium, ISMC (https: //soil-modeling.org/, last access: 1 July 2018), for further archiving in the SWIG database.
4 Data availability
All collected data and related soil characteristics are provided online in *.xlsx and *.csv formats for reference and are avail-able at https://doi.org/10.1594/PANGAEA.885492 (Rahmati et al., 2018). We add a disclaimer that the database is for pub-lic domain use only and can be copied freely by referencing it.
5 Conclusion
We have collected 5023 infiltration curves from field exper-iments from all over the world covering a broad range of soils, land uses, and climate regions. We estimated saturated
hydraulic conductivity,Ksat, and sorptivity from more than
3000 infiltration curves and compared estimatedKsatvalues
with values from different databases published in the liter-ature. We showed that contrary to the assumption made in many land surface and global climate models, texture is not
the main controlling factor forKsat. In addition, the
variabil-ity ofKsatderived from these field measurements is
consid-erably larger than reported in the literature. The collected in-filtration curves were archived as the SWIG database on the PANGAEA platform and are therefore available worldwide. The data are structured into *.xlsx and *.csv files and include metadata information for further use. Data analysis revealed that infiltration curves are lacking for clayey, sandy-textured, and stony soils. Also infiltration curve data are lacking for the northern and permafrost regions. Here, additional efforts are needed to collect more data as these regions are partic-ularly sensitive to climate change, which will clearly affect the soil hydrology.
Supplement. The supplement related to this article is available online at: https://doi.org/10.5194/essd-10-1237-2018-supplement.
Author contributions. The idea of globally collecting soil infil-tration data was put forward by MR and HV. Published data from literature were digitized by MR, LW, NM, and MK. Data contrib-utors are MR, YAP, LM, SHS, HK, ZH, WAY, AAA, MZA, RAJ, ACDA, GA, RAA, HA, YB, JBA, BB, FB, GB, KB, IB, CC, AC, MC, RC, MC, BC, YC, WC, CC, APC, MBdO, JRdM, MFD, HE, IE, AF, AF, NF, MG, MHG, TAG, SG, EGH, RH, JJJ, DJ, SDK, HK, MKH, MKJ, LL, XL, MAL, LL, MVL, DM, DM, MSM, JD-dOM, MRM, JM, FM, MHM, BPM, MPM, SM, RM, DMF, AAM, MRM, SBM, HM, KN, MRN, MVO, TBOF, MRPR, AP, SP, PEP, TP, MP, DJR, SR, MR, FPR, DR, JRC, OCRF, TS, HS, CS, RS, BS, MS, NS, ESM, MS, SS, RS, AAS, PS, ZS, RTM, ET, WGT, ARV, MV, TV, IV, JV, SW, TW, DY, MHY, SZ, YZe, YZh, and HZ. The data were collected by MR, HV, LW, and KVL. The data analysis was conceived, designed, and performed by MR, HV, LW, JV, SHS, CM, KVL, BT, FM, and RTM. The article was written by MR, HV, LW, LM, and HK. The article was actively revised several times by MR, LW, HV, YAP, MHY, SHS, MS, JP, ZH, AC, YC, LL, FM, RM, DMF, RS, WGT, HA, NS, RAA, IB, FPR, and SR. All authors checked the accuracy and/or commented on the contents of the pa-per.
Competing interests. The authors declare that they have no con-flict of interest.
Acknowledgements. First author thanks the International and Scientific Cooperation Office of the University of Maragheh, Iran, as well as the research committee and board members of the univer-sity for their assistance in conducting the current work.
The financial support received from the Forschungszentrum Jülich GmbH is gratefully acknowledged by the first author.
Authors gratefully thank the International Soil Modeling Con-sortium (ISMC) and the International Soil Tillage Research Organi-zation (ISTRO) for their help in distributing our call for data among researchers throughout the world.
Parts of data were gathered from the work that was supported by the UK–China Virtual Joint Centre for Improved Nitrogen Agron-omy (CINAg, BB/N013468/1), which is jointly supported by the Newton Fund, via UK BBSRC and NERC.
The French Claduègne and Yzeron datasets were acquired during the ANR projects FloodScale (ANR-2011-BS56-027) and AVuUR (ANR-07-VULN-01), respectively.
Parts of the database were made available through research work carried out in the framework of LIFE+projects funded by the EC.
The support of the Spanish Ministry of Economy through project CGL2014-53017-C2-1-R is acknowledged.
The support of the Czech Science Foundation through project no. 16-05665S is acknowledged.
The support of the Slovak Research and Development Agency through project no. APVV-15-0160 is acknowledged.