https://doi.org/10.5194/essd-10-677-2018 © Author(s) 2018. This work is distributed under the Creative Commons Attribution 4.0 License.
An inventory of Arctic Ocean data in
the World Ocean Database
Melissa M. Zweng1, Tim P. Boyer1, Olga K. Baranova1, James R. Reagan1,2, Dan Seidov1, and Igor V. Smolyar1
1NOAA National Centers for Environmental Information, Silver Spring, Maryland, USA
2Earth System Science Interdisciplinary Center/Cooperative Institute for Climate and Satellites – Maryland,
University of Maryland, College Park, MD, USA
Correspondence:Melissa M. Zweng ([email protected])
Received: 30 June 2017 – Discussion started: 11 August 2017
Revised: 4 February 2018 – Accepted: 13 February 2018 – Published: 29 March 2018
Abstract. The World Ocean Database (WOD) contains over 1.3 million oceanographic casts (where “cast”
refers to an oceanographic profile or set of profiles collected concurrently at more than one depth between the ocean surface and ocean bottom) collected in the Arctic Ocean basin and its surrounding marginal seas. The data, collected from 1849 to the present, come from many submitters and countries, and were collected using a variety of instruments and platforms. These data, along with the derived products World Ocean Atlas (WOA) and the Arctic Regional Climatologies, are exceptionally useful – the data are presented in a standardized, easy to use format and include metadata and quality control information. Collecting data in the Arctic Ocean is challenging, and coverage in space and time ranges from excellent to nearly non-existent. WOD continues to compile a comprehensive collection of Arctic Ocean profile data, ideal for oceanographic, environmental and climatic analyses (https://doi.org/10.7289/V54Q7S16).
1 Introduction
The Arctic Ocean has a great influence on the earth’s climate (Aagaard and Carmack, 1994) and supports vast and diverse ecosystems. Change in this region has been swift as the Arc-tic has warmed at a much faster rate than the lower latitudes (Serreze and Barry, 2011). Understanding the long-term dy-namics of the Arctic Ocean is critical and research requires data from both the present and the past. Unfortunately, the area is remote and the waters dangerous. The basin is largely ice-covered in winter, rendering ships unable to collect sam-ples at this time of year. This leads to a marked seasonal bias in the data, which lean heavily towards observations in the summer, when there is less ice cover. However, even in the summer months the seas are full of drifting ice, which can present a potential hazard to ships and other sampling plat-forms. Because Arctic data are difficult to gather, they are scarce and scientifically valuable.
The World Ocean Database (WOD) is the largest publicly available, quality-controlled global ocean profile database,
2 History of Arctic data
Local populations have widely traveled and fished Arctic basin coastal areas since antiquity. The early 1800s mark the first recorded European expeditions to seek the North Pole, when William Edward Parry’s expedition traveled to approx-imately 82◦N. Many other explorers attempted to reach the pole with varying degrees of success. Robert Peary’s 1909 expedition, achieved by ship, dogsled and on foot, was the first with a believable claim to have reached the pole. The first surface ship to reach the pole was the Soviet nuclear ice-breakerArktikain 1977.
Many of the polar explorers collected oceanographic data during their travels, typically by bucket or bottle samples and by recording meteorological information. In fact, it was the scientist-explorers such as Nansen, Sverdrup and Ekman who observed the ocean as they explored the Arctic during the late 1800s and early 1900s that formulated and enriched the young science of oceanography. The oceanic and atmo-spheric data they collected were published in the expedition’s cruise reports. These reports remain in library collections and many have been digitized for modern study. Rudels (2013) offers an overview of these early expeditions.
Scientists have continued to conduct research and collect data in the Arctic Ocean. There have been concerted research efforts for each of the International Polar Years (IPY; 1882– 1883, 1932–1933 and 2007–2008), as well as for the Inter-national Geophysical Year (IGY; 1957–1958). These efforts were designed to produce quasi-synoptic snapshots of the en-vironment.
Sampling in the winter was especially difficult due to harsh weather and ice, but scientists found ways to access the win-ter Arctic. Drifting ice camps and buoys, research cruises by submarine and sampling by plane and helicopter have been used to collect data. In 1937, the Soviet Union established the first drifting ice camp, North Pole 1, using aircraft to drop re-searchers at the North Pole. The camp drifted southward and eventually, after nearly a year, currents carried it out of Fram Strait and the crew was evacuated (Shirshov and Federov, 1938). Several more Soviet drifting ice camps at or near the North Pole followed (Treshnikov, 1977). The US and Canada established a number of drifting ice observational programs to study ocean and ice dynamics in the 1950s (Sater, 1964).
Another novel method to gather data in this challenging region involves instrumented marine mammals, who are nat-ural profilers as they dive to feed and surface to breathe. The MEOP project (Marine Mammals Exploring the Oceans Pole to Pole, http://meop.net) maintains a global database of in-strumented marine mammal data. Many CTD profiles from instrumented pinnipeds in the Arctic are already available in the WOD (Fedak, 2013). Other instrumented marine mam-mals such as white whales (Lydersen et al., 2002) and nar-whals (Laidre et al., 2010) were not available in WOD13, but have been added to the database for later releases. These animal-based approaches have the benefit of providing data
during seasons when the ocean is largely ice-covered; the marine mammals surface in the open water of leads and polynyas – biologically vital areas – to breathe and transmit data.
Lee et al. (2009) documents a variety of new, autonomous instrumental approaches that enhance the Arctic observing network. Ice-tethered profiling floats have been developed that are inserted in floating ice floes and profile under the ice whether it is drifting or held fast, sampling areas that were previously inaccessible (Kikuchi et al., 2002; Toole et al., 2011; Krishfield et al., 2008). Argo floats, which have found limited use so far in the Arctic Ocean, are being mod-ified by scientists at Universite Laval in Québec to profile in icy regions and monitor the ice edge in Baffin Bay and the Labrador Sea (Le Traon et al., 2012). Argo floats have been deployed under seasonal ice in the Antarctic (Wong and Riser, 2011) with ice detection technology with plans to de-ploy in the Arctic as well.
3 Description of Arctic Ocean and basic
hydrography
The Arctic Ocean is the smallest of the ocean basins, covering about 14 million km2 (the global ocean covers 361 million km2). It is an estuarine-type basin, with inflow and outflow limited to the following regions: the Bering Strait, between Alaska and Kamchatka; Fram Strait, between Greenland and Svalbard; the Barents Sea; and the straits of the Canadian Archipelago. Figure 1 shows the boundaries, basins and straits of the Arctic Ocean basin, which includes its marginal seas, the Chukchi, Beaufort, Lincoln, Greenland, Norwegian, Barents, Kara, Laptev, and East Siberian seas.
The single interchange between the Arctic Ocean and the Pacific Ocean is the narrow and shallow Bering Strait. The flux through the strait is estimated to vary seasonally between 0.4 Sv (Sverdrup; 1 Sv=1×10⁶m3s−1) and 1.3 Sv from the Pacific into the Arctic (Woodgate et al., 2005). The inter-change between the Arctic Ocean and the Atlantic Ocean is much larger and more complex. The principal interchange, a two-way flow, occurs east of Greenland, through Fram Strait and the Barents Sea. The interchange through Fram Strait is estimated to be about 7 Sv into the Arctic Ocean basin, and 9 Sv out of the basin (Fahrbach et al., 2001), and 1– 3 Sv into the Barents Sea from the Norwegian Sea (Schauer et al., 2002). An outflow estimated at about 1–2 Sv occurs through the Canadian Archipelago (Melling et al., 2008).
Figure 1. Red fill marks the Arctic Ocean Basin in WOD. This includes the Arctic Ocean basin and its marginal seas, the Chukchi, Beaufort, Lincoln, Greenland, Norwegian, Barents, Kara, Laptev, and East Siberian seas.
4 Data discovery, access and archival
The scarcity and high cost of obtaining Arctic Ocean mea-surements makes the data that exist particularly valuable. One challenge is convincing individuals, industry and gov-ernments that the data should be shared freely. Data gathered by military programs often remain classified for long periods of time. In particular, there were extensive Soviet and Rus-sian surveys in the Arctic Ocean – the most extensive long-term observing program – that remain unavailable, except as statistical derivative products as used by, for example, Swift et al. (2005) and Steele and Ermold (2007). However, there are exceptions that show cooperation between the military and civilian scientists. The US Navy-led SCICEX (“Scien-tific Ice Expeditions”) program (Hopkins et al., 1998) pro-vided several nuclear submarines so that civilian scientists could collect measurements under the ice. The data and re-sults of this expedition were made public. This provided in-valuable observations in a previously unstudied environment through a platform uniquely mobile under the ice (Rothrock et al., 1999). The data allowed for breakthrough analysis of the region (e.g., Morison et al., 1998; Steele and Boyd, 1998). With the recent boom in Arctic Ocean natural resource ex-ploration, private industry collects an increasing amount of data in the area. Like data collected by the military, indus-try data provides an advantage to the company that has it, and it is no surprise that historically they have been reluctant to share it. However, the Deepwater Horizon oil spill in the
Gulf of Mexico in 2010 led to an increasing awareness of the volume of industry data holdings and an appreciation of their value to the scientific community in understanding the environment. In particular, Shell, Statoil and ConocoPhillips signed an agreement NOAA to share many of their observa-tions on the Alaska shelf in the Beaufort and Chukchi Seas. This agreement lasted from 2011 to 2016, when Shell ceased operations in the Alaskan Arctic.
Another source of data for climate study involves interna-tional cooperation with historical data archives such as the International Global Oceanographic Data Archaeology and Rescue (GODAR) project (Levitus, 2012), a project of the International Ocean Data and Information Exchange (IODE). This project unearths data at risk of loss, in paper records and obsolete magnetic formats, and preserves them in modern digital format. The developers of WOD have worked closely with GODAR to ensure that all data rescued by the program are archived and available through WOD.
Academic scientists all over the world are often reluctant to share data, in particular until scientists complete their re-search and publish papers based on the data. To improve data exchange, the National Science Foundation (NSF), which funds many US scientists and research, requires principal in-vestigators to submit a data management plan and archive their data within 2 years to ensure that the data be made ac-cessible to the public. However, enforcement of this require-ment can be difficult and the requirerequire-ment only applies to US researchers.
Even for publicly available data, logistical challenges to disseminating that data exist. In the case of Arctic data funded by US projects such as NSF, principal investiga-tors may submit their data to several archives. This in-cludes: the national data centers, which are committed to the long-term archival of the data (National Centers for Envi-ronmental Information (NCEI), https://www.ncei.noaa.gov/ s2n/); the Arctic Observing Network/Advanced Coopera-tive Arctic Data and Information Service (AON/ACADIS) archive (https://www.aoncadis.org/home.htm), now replaced by the Arctic Data Center (https://arcticdata.io); and a num-ber of other topic- and region-specific NSF-funded data archives. Data are also collected and served as part of re-gional observing systems like the Arctic Ocean Observ-ing System (AOOS, http://www.ioos.noaa.gov/regions/aoos. html). In addition, scientists outside the United States have archives to which they may be required to, or prefer to, sub-mit data. At present, a user in search of data may need to visit several websites and projects and combine data in vari-ous formats.
discov-ery that enables people in search of data to view, access and download data from several archives at once. Projects such as DataOne (Strasser et al., 2012) are helping to familiarize sci-entists in the field with the standard formats that these data services require, facilitate data discovery and delivery, and work with archives to steward data for the long-term.
In this context, WOD serves a unique role: an aggrega-tor for ocean profile data, which presents the casts in a uni-form data and metadata uni-format and provides additional ser-vices like quality control and value-added derived products. Users may download the data in CF-compliant netCDF for-mat, comma-separated value (CSV) files, or the WOD na-tive ASCII, which requires tools such as Ocean Data View or other software to interpret. Having the data in a common format allows the data to be used for scientific analysis with-out the burden of having to reformat the original data, helps to unify a fractured data system and provides user-friendly access to Arctic data. As data service technology advances, features like standardized formats and web services will al-low access to data from a variety of sources in a unified way. This unified system will be applied to recent and future ob-servation systems. The WOD will continue to be the main source of historic Arctic data in this unified system.
5 Arctic data in the World Ocean Database
The casts in WOD derive from oceanographic profile data in the NCEI archive. About 10 % of the casts in WOD come from the Arctic Ocean (1 389 689 casts). The follow-ing sections focus on the data included in WOD13 (Boyer et al., 2016). Following the release of WOD13, the database has continued to evolve, adding new ocean profile data archived at NCEI as well as older, historical data either newly archived or previously unprocessed data from the archive. As of Jan-uary 2018, nearly 97 000 more casts have been added to WOD from the Arctic Ocean. The WOD developers encour-age the community to submit new data and alert us to gaps in the data and to previously unknown datasets, so we can keep WOD as up-to-date and comprehensive as possible.
5.1 Data distributions by time, space and instrument
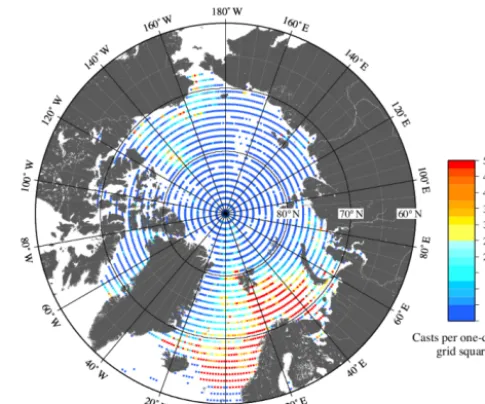
Figure 2 illustrates the data density for the complete dataset. Warmer colors have more data per 1◦×1◦grid square as in-dicated by the legend, and areas in white have no data. It should be noted that the 1◦×1◦grid squares become increas-ingly small in area as latitude increases. The best coverage in the Arctic Ocean, from 1849 to present, is in the Eurasian sector, a slice from Iceland to Novaya Zemlya and north to about 80◦N. This area is geographically well-sampled, with over 100 data points per 1◦×1◦grid square, and closer to the coasts with over 500 data points per grid square. 50 or more data points per 1◦×1◦grid square exist along western coast of Greenland and Davis Strait, northern coast of Alaska, and a swath north of the Mackenzie River delta to about 80◦N.
Figure 2.Data density of Arctic Ocean casts in WOD13. Areas left white indicate no data. Please note that the area of the 1◦grid squares become increasingly small as they approach the pole.
The Russian shelf has some small areas of denser sampling, especially near river mouths and ports.
Outside of these regions, sampling falls off dramatically. Figure 2 displays sparse data coverage for almost all of the northernmost part of the Arctic Ocean (80–90◦N). The small straits of the Canadian Archipelago also have poor cover-age, as does most of the East Siberian Shelf. In these re-gions, there may be as few as one to five samples per 1◦×1◦ grid box over the entire 1849–present period. In a few grid squares, particularly north of Greenland and north of the Canadian Archipelago, there are no data.
Figure 3 shows the distribution of Arctic Ocean casts through time. The rescue ship Herald collected the first Arc-tic Ocean data found in WOD in 1849 while on a mission to rescue the Franklin expedition; the ship’s logs were dig-itized from printed records under the GODAR project. As years passed, the amount of data collected per year gradu-ally increased, falling off somewhat due to World War II, and then increased sharply and decreased after about 1990. The data density plot shows a decline in casts in the Barents Sea, possibly due to the fall of the Soviet Union, the most active surveyor in this area. Peak periods include 1959 (due to the International Geophysical Year, IGY) and the 1980s. More than three-quarters (77 %) of the data was collected between 1950 and 1990.
col-1845 1855 1865 1875 1885 1895 1905 1915 1925 1935 1945 1955 1965 1975 1985 1995 2005 2015
Year
0 5000 10000 15000 20000 25000 30000
Number of casts
IPY1 1882-1883
IPY2 1932-1933 IGY 1957-1958
IPY3 2007-2008
Figure 3.Time series of number of casts per year in WOD13. Notable special observing periods include the International Polar Years (IPY; 1882–1883, 1932–1933 and 2007–2008), as well as the International Geophysical Year (IGY; 1957–1958).
Figure 4.Data distribution by decade. Areas left white indicate no data.
lected in Baffin Bay and on the Canadian/Alaskan and Rus-sian shelves. The 1980s and later also find more data north of 80◦N, much of it collected by drifting buoys and icebreaker surveys.
The largest portion of Arctic Ocean data in WOD, by num-ber of casts, comes from moored buoys (MRBs), making up just under half. However, this counting of data may be
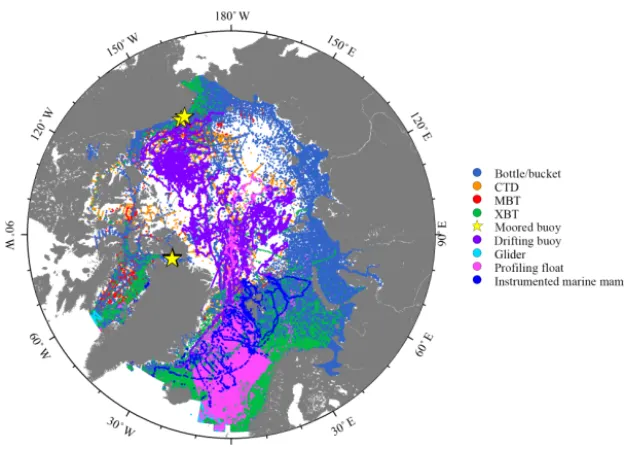
Figure 5.Data distribution by instrument.
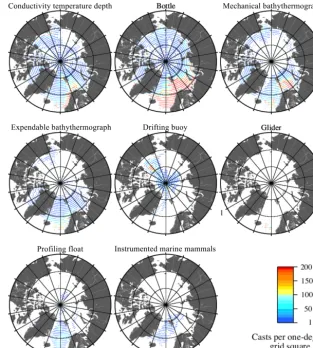
5.8 %), profiling floats (PFL, 1 %), glider data (GLD, 0.3 %) and instrumented marine mammal data (APB, 1.5 %). How-ever, if the dataset is examined not in terms of cast numbers but rather as daily averages of measurements by platform and location per instrument type, the moored buoy makes up a much smaller part (bottle 50 %, CTD 14 %, MBT 13 %, drifting buoys 12 %, XBT 4 %, instrumented marine mam-mal 2.9 %, profiling floats 1.6 %, moored buoy 1.3 %, glider <1 %). Figure 5 shows the distribution of samples of the dif-ferent instrument types on a single map, and Fig. 6 shows the data density of each instrument type separately.
As previously mentioned, a small number of moored buoys collected a large number of casts. The observations collected by these buoys span long time periods, different in character from the snapshot nature of oceanographic casts. WOD contains data from two sets of moored buoys in the Arctic Ocean. The first is located in the Chukchi Sea, and sampled at five moorings from 2003 to 2006 as part of the research project Circulation of the North Central Chukchi Sea led by Tom Weingartner of the University of Alaska, Fairbanks (Weingartner et al., 2005). The second is from six moorings across Nares Strait, north of Baffin Bay, from 2003 to 2010 submitted by Andreas Muenchow, University of Delaware as part of the Arctic-Subarctic Ocean Fluxes (ASOF) program (Rabe et al., 2010). The moorings col-lected current information using acoustic Doppler current profilers (ADCPs) as well as hydrographic data with moored CTDs. However, WOD contains only the hydrographic data. The associated ADCP data are available from the NCEI archive. The mooring data in WOD is certainly not exhaus-tive. There are mooring data in the archive that were not added to WOD13 (such as the 1997–1990 moorings across
Davis Strait), and additional data held in other archives, such as the deep moorings across Fram Strait maintained by the Alfred-Wegener-Institut für Polar und Meeresforschung (AWI) (Soltwedel et al., 2005). After the release of WOD13, we continue to add data and are working on agreements with other data archives to include data from their holdings in WOD.
The drifting buoy data (DRB) from the Arctic Ocean comes from ice drifters. Measurements from drifting ice floes are constrained by the motion of the ice in which they are deployed, but still provide a unique and gener-ally long-lived Lagrangian perspective on the state of the Arctic Ocean. Starting in the 1990s, the Japan Agency for Marine-Earth Science and Technology (JAMSTEC) devel-oped and deployed JAMSTEC Compact Arctic Drifters (J-CAD) (Kikuchi et al., 2002). In 2006, scientists at Woods Hole Oceanographic Institution (WHOI) developed and be-gan to deploy an ice-tethered profiler (ITP) instrument that combines an ice drifter with a profiling float (Krishfield et al., 2008; Toole et al., 2011). Both of these instruments pro-vide data coverage in areas previously unreachable during icy seasons. The instruments continue to take and transmit measurements regardless of whether the ice in which they are deployed is drifting or held fast.
Figure 6.Data distribution by instrument. Areas left white indicate no data.
WOD13. The most represented variables are temperature and salinity. Table 1 shows the number of casts that contain each variable.
5.2 Data submitters and projects
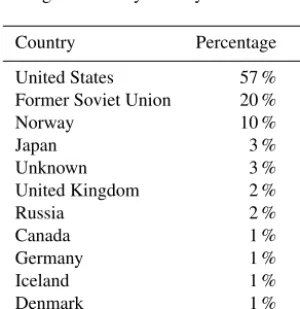
Table 2 shows the distribution of data by country: 57 % of the data were submitted from institutions based in the United States, 20 % from the former Soviet Union (FSU), 10 % from Norway and 3 % from Japan. However, the notion of assign-ing a country to data can be complicated as different infor-mation can be used to determine a country of origin (i.e., data can be based on the submitting institution, collecting institu-tion, ship or collecting scientists). In most cases, the country code reflects the ship or submitting institution.
Table 3 lists the institutions that have submitted the largest number of casts making up about 70 % of the Arctic Ocean casts in WOD. However, 141 other groups have also con-tributed data. Not all casts have institution information at-tached to them, although WOD includes this metadata wher-ever available.
Table 1.Number of Arctic Ocean casts in the bottle (OSD) database that contain each data variable.
Variable Number of casts
Temperature 363 207
Salinity 307 737
Dissolved oxygen 72 136
Phosphate 42 613
Silicate 33 808
pH 24 777
Nitrate 21 391
Nitrite 20 565
Plankton 13 975
Alkalinity 12 937
Chlorophyll 3282
Ammonia 3108
Total CO2 2060
Pheophytin 1618
CFC-11 1488
CFC-12 1446
Nitrate+nitrite 1280
CFC-113 1115
Total phosphorus 1081
Dissolved organic carbon 607
Oxygen-18 544
Particulate organic carbon 535 Primary productivity 226
Tritium 139
Helium 136
δHe-3 134
δCarbon-14 45
δCarbon-13 14
Total casts 374 524
Table 2.Percentage of casts by country.
Country Percentage
United States 57 %
Former Soviet Union 20 %
Norway 10 %
Japan 3 %
Unknown 3 %
United Kingdom 2 %
Russia 2 %
Canada 1 %
Germany 1 %
Iceland 1 %
Denmark 1 %
Other <1 %
The International Global Oceanographic Data Archaeol-ogy and Rescue (GODAR) project (Levitus, 2012) is one of the most successful projects to rescue large volumes of oceanographic profile data from historical sources, including those from the former Soviet Union. The Arctic Ocean casts
Figure 8.Data density of casts received from ICES.
are 19 % of the entire contribution from GODAR, which is over 1.1 million casts. In the Arctic Ocean, GODAR con-tributed 214 764 casts (16 % of all Arctic Ocean casts in WOD). Of these casts, 198 999 (93 %) are from the for-mer Soviet Union and Russia, representing invaluable coop-eration and collaboration between the US and these coun-tries. Figure 7 shows the distribution of casts added to WOD through the GODAR project.
The International Council for the Exploration of the Sea (ICES) is an important contributor to the Arctic Ocean data inventory in the WOD. Currently, WOD contains 50 373 bot-tle casts and 22 778 CTD casts from ICES in the Arctic Ocean. ICES data are generally from the Atlantic side of the Arctic, with heavy profile density in the Norwegian and Barents seas. While the Arctic data from ICES is geograph-ically constrained, it is very important to scientific research. The regions of high profile density lie along the pathways of the Atlantic water inflow into the Arctic, allowing for several studies of the inflow variability (e.g., Furevik, 2001; Smolyar and Adrov, 2003; Carton et al., 2011; Korablev et al., 2014; Yashayaev and Seidov, 2015). Figure 8 shows the distribution of Arctic Ocean casts submitted to WOD by ICES.
The primary projects that have contributed Arctic Ocean data to WOD are the Arctic/Subarctic Ocean Fluxes (ASOF) program (active 2000–2008, 635 124 moored buoy casts), the Shelf-Basin Interaction (SBI) project (active 2002–2004, 44 594 casts), the North Pole Environmental Observatory (NPEO) project (2000–present, 14 178 casts) and the Inter-national Arctic Buoy Program (1991–present, 8240 casts). These projects combined contribute about half of all Arctic Ocean data in WOD. As with institutions, not all casts have project information associated with them, but we include that metadata where possible.
Table 3.Institutions submitting the most casts from the Arctic Ocean to WOD, and number of casts submitted.
Institution Number of casts
University of Delaware, USA 635 203∗
Arctic Antarctic Research Institute (AARI), St. Petersburg, Russia 60 896
University of Alaska, Fairbanks, USA 44 487∗
Institute of Marine Research, Bergen, Norway 39 994
Woods Hole Oceanographic Institution, USA 33 085
Murmansk Directorate of the Russian Hydrometeorological Service 28 553 Hydrometeorological Service of the Russian Navy 20 422
Russia Northern Directorate of Fisheries 15 468
Murmansk Marine Biological Institute of the Russian Academy of Sciences 23 165 Japan Agency for Marine-Earth Science and Technology (JAMSTEC) 14 275
University of Washington, Seattle, USA 10 736
∗Indicates a moored buoy dataset with a large number of profiles.
FSU contributors have been, and continue to be, an invalu-able source of Arctic data, and it underscores the scope of the Russian/Soviet Union exploration of the Arctic region. Many of these casts were submitted to NCEI through GODAR and the World Data Service for Oceanography in Silver Spring, Maryland, USA.
5.3 Derived products
In order to more widely distribute the Arctic data in the WOD, further quality control the data, and understand the large-scale structure of the Arctic Ocean and environs, NCEI has produced a number of products specific to the Arctic re-gion. The World Ocean Atlas (WOA), climatological mean fields of temperature, salinity, oxygen and nutrients at stan-dard depths for the global ocean, is created using the data in WOD. While the Arctic Ocean is included in the WOA, a finer-scale grid and additional expert scrutiny of the data were used to create an Arctic regional climatology, (http: //www.nodc.noaa.gov/OC5/regional_climate/arctic). Seidov et al. (2015) describes results of a pilot study of the Arc-tic Ocean and adjacent seas using this regional climatol-ogy along with data distribution analysis, demonstrating the Barents and Nordic seas are well-covered by histor-ical observations. Overlapping with the Arctic Ocean, a Greenland-Iceland-Norwegian Seas (GINS) Regional Cli-matology is available at http://www.nodc.noaa.gov/OC5/ regional_climate/gin-seas-climate/. Both regional climatolo-gies have 0.1◦resolution, in addition to the 0.25 and 1◦ anal-yses in WOA.
In addition to these products and studies, NCEI is in-volved in international cooperation to increase data hold-ings and understanding of the Arctic region. In particular the International Atlas Series (https://www.nodc.noaa.gov/OC5/ indprod.html#inter), in collaboration with Russian institutes and scientists, has greatly increased public data holdings in the Russian Arctic.
6 Data availability
The WOD13 data used in this study are archived at NCEI and available online (https://doi.org/10.7289/V54Q7S16). Users may also visit the WODSelect web application at http:// www.nodc.noaa.gov/OC5/WOD/pr_wod.html to subset and download the data in CF-compliant netCDF format, comma-separated value (CSV) files, or the WOD native ASCII for-mat. The online version of WOD is updated with newly added near-real-time and historic data every 3 months, and every 4 years full quality control is performed on the data and the full WOD product is released. The updates and product releases are available from the NCEI archive at https://data. nodc.noaa.gov/cgi-bin/iso?id=gov.noaa.nodc:NCEI-WOD.
7 Conclusions
WOD contributes to Arctic Ocean, environmental and cli-mate science by providing a “one-stop” source of ocean data in a uniform data and metadata format, with quality control applied, that makes it simple for scientists to apply the infor-mation to their research.
Analysis of the Arctic is difficult due to scarcity of data. WOD has the best spatial and temporal coverage in the Eurasian sector, and the data there support long-term stud-ies. On a basin scale, the sparse distribution of data in space and time make robust analyses of change difficult.
WOD is a unique product that brings together in situ data from many different countries and institutions, and repre-sents a great international collaboration. This is especially true in the Arctic, where data from the former Soviet Union and Russia make up a large and important component, par-ticularly of historic data rescued by the GODAR project.
Competing interests. The authors declare that they have no con-flict of interest.
Acknowledgements. The authors would like to acknowledge the work of OCL staff in maintaining the WOD, NCEI staff in maintaining the archive and the data providers past and present who have archived their ocean data at NCEI. In addition, we would like to acknowledge all of the scientists and technicians who braved Arctic conditions to make invaluable measurements and also the national data centers, institutional repositories and individual investigators who provided the data found in the WOD.
Edited by: Giuseppe M. R. Manzella
Reviewed by: Mike Steele and one anonymous referee
References
Aagaard, K. and Carmack, E. C.: The Arctic Ocean and Climate: A Perspective, in: The Polar Oceans and Their Role in Shaping the Global Environment, edited by: Johan-nessen, O. M., Muench, R. D., and Overland, J. E., AGU, https://doi.org/10.1029/GM085p0005, 2013.
Boyer, T. P., Antonov, J. I., Baranova O. K., Coleman, C., Garcia,H. E., Grodsky, A., Johnson, D. R., Locarnini, R. A., Mishonov, A. V., O’Brien, T. O., Paver, C. R., Reagan, J. R., Seidov, D., Smol-yar, I. V., and Zweng, M. M.: World Ocean Database 2013, edited by: Levitus, S. and Mishonov, A. V., NOAA Atlas NESDIS 72, 209 pp., 2013.
Boyer, T. P., Antonov, J. I., Baranova O. K., Coleman, C., Gar-cia, H. E., Grodsky, A., Johnson, D. R., Locarnini, R. A., Mishonov, A. V., O’Brien, T. O., Paver, C. R., Reagan, J. R., Seidov, D., Smolyar, I. V., and Zweng, M. M.: World Ocean Database 2013 (NCEI Accession 0117075), 2016. Version 1.1. NOAA National Centers for Environmental Information, Dataset, https://doi.org/10.7289/V54Q7S16, last access: 25 July 2016.
Carton, J. A., Chepurin, G. A., Reagan, J., and Häkkinen, S: Interannual to decadal variability of Atlantic Water in the Nordic and adjacent seas, J. Geophys. Res., 116, C11035, https://doi.org/10.1029/2011JC007102, 2011.
Dickson, R. R., Meincke, J., Malmberg, S.-A., and Lee, A. J.: The “Great Salinity Anomaly” in the northern North Atlantic 1968– 1982, Prog. Oceanogr., 20, 103–151, 1988.
Fahrbach, E., Meincke, J., Osterhus, S., Rohardt, G., Schauer, U., Tverberg, V., and Verduin, J.: Direct measurements of volume transports through Fram Strait, Polar Res., 20, 217–224, 2001. Fedak, M. A.: The impact of animal platforms on polar
ocean observations, Deep-Sea Res. Pt. II, 88–89, 7–13, https://doi.org/10.1016/j.dsr2.2012.07.007, 2013.
Furevik, T.: Annual and interannual variability of At-lantic Water temperatures in the Norwegian and Bar-ents Seas: 1980–1996, Deep–Sea Res. Pt. I, 48, 383–404, https://doi.org/10.1016/S0967-0637(00)00050-9, 2001. Hopkins, T. S., Mustafa, M. S., Kinder, C., and Cook, M. O.:
SCI-CEX 96 hydrographic data report, USS Pogy cruise, September– November 1996, Dep. of Mar., Earth and Atmos. Sci., N.C. State Univ., Raleigh, N.C., 1998.
Kikuchi, T., Hatakeyama, K., Shimada, K., Takizawa, T., and Mori-son, J.: Oceanographic observation under the multi-year ice of the Arctic Ocean using J-CAD (JAMSTEC Compact Arctic Drifter), Mombetsu-02 Symposium 24–28 February 2002, Mom-betsu, Hokkaido, JAPAN, 2002.
Korablev, A., Smirnov, A., and Baranova, O. K.: Climatological At-las of the Nordic Seas and Northern North Atlantic, edited by: Seidov, D. and Parsons, A. R., NOAA Atlas NESDIS 77, 122 pp., NOAA Dataset, https://doi.org/10.7289/V5K64G16, 2014. Krishfield, R., Toole, J., Proshutinsky, A., and Timmermans,
M.-L.: Automated Ice-Tethered Profilers for seawater observations under pack ice in all seasons, J. Atmos. Ocean. Tech., 25, 2091– 2095, 2008.
Laidre, K. L., Heide-Jørgensen, M. P., Ermold, W., and Steele, M.: Narwhals document continued warming of southern Baffin Bay, J. Geophys. Res., 115, C10049, https://doi.org/10.1029/2009JC005820, 2010.
Lee, C. M., Melling, H., Eicken, H., Schlosser, P., Gascard, J.-C., Proshutinsky, A., Fahrbach, E., Mauritzen, C., Mori-son, J., and Polykov, I.: Autonomous Platforms in the Arc-tic Observing Network, in: Proceedings of OceanObs’09: Sus-tained Ocean Observations and Information for Society (Vol. 2), Venice, Italy, 21–25 September 2009, edited by: Hall, J., Harrison, D. E., and Stammer, D., ESA Publication WPP-306, https://doi.org/10.5270/OceanObs09.cwp.54, 2009.
Le Traon, P.-Y., D’Ortenzio, F., Babin, M., Claustre, H., Pouliquen, S., Le Reste, S., Thierry, V., Brault, P., Guigue, M., and Le Menn, M.: NAOS: Preparing the New Decade for Argo, Mercator Ocean-Coriolis Quarterly Newsletter, Special Issue #45, April, 3–4, 2012.
Levitus, S.: The UNESCO-IOC-IODE “Global Oceanographic Data Archeology and Rescue” (GODAR) Project and “World Ocean Database” Project, Data Science Journal, 11, 46–71, https://doi.org/10.2481/dsj.012-014, 2012.
Lydersen, C., Nøst, O. A., Lovell, P., McConnell, B. J., Gammel-srød, T., Hunter, C., Fedak, M. A., and Kovacs, K. M.: Salinity and temperature structure of a freezing Arctic fjord – monitored by white whales (Delphinapterus leucas), Geophys. Res. Lett., 29, 2119, https://doi.org/10.1029/2002GL015462, 2002. Melling, H., Falkner, K. K., Woodgate, R. A., Prinsenberg, S.,
Muenchow, A., Greenberg, D., Agnew, T., Samelson, R., Lee, C., and Petrie, B.: Freshwater Fluxes via Pacific and Arctic Outflows across the Canadian Polar Shelf, in: Arctic-Subarctic Ocean Fluxes, edited by: Dickson, R. R., Meincke, J., and Rhines, P., Springer, Dordrecht, https://doi.org/10.1007/978-1-4020-6774-7_10, 2008.
Morison, J. H., Steele, M., and Anderson, R.: Hydrography of the upper Arctic Ocean measured from the nuclear submarine USS Pargo, Deep-Sea Res. Pt. I, 45, 15–38, 1998.
Rabe, B., Münchow, A., Johnson, H. L., and Melling, H.: Nares Strait hydrography and salinity field from a 3-year moored array, J. Geophys. Res., 115, C07010, https://doi.org/10.1029/2009JC005966, 2010.
Rudels, B: Arctic Ocean circulation, processes and water masses: A description of observations and ideas with focus on the period prior to the International Polar Year 2007–2009, Prog. Oceanogr., 132, 22–67, 2013.
Sater, J. E.: Arctic Drifting Stations, Arctic Institute of North Amer-ica, Washington, DC, 475 pp., 1964.
Schauer, U., Loeng, H., Rudels, B., Ozhigin, V. K., and Dieck, W.: Atlantic Water flow through the Barents and Kara Seas, Deep-Sea Res. Pt. I, 49, 2281–2298,2002.
Seidov, D., Antonov, J. I., Arzayus, K. M., Baranova, O. K., Biddle, M., Boyer, T. P., Johnson, D. R., Mishonov, A. V., Paver, C., and Zweng, M. M.: Oceanography north of 60◦N from World Ocean Database, Prog. Oceanogr., 132, 153–173, https://doi.org/10.1016/j.pocean.2014.02.003, 2015.
Serreze, M. C. and Barry, R. G.: Processes and impacts of Arctic Amplification, Global Planet. Change, 77, 85–96, https://doi.org/10.1016/j.gloplacha.2011.03.004, 2011.
Serreze, M. C., Barrett, A. P., Slater, A. G., Woodgate, R. A., Aagaard, K., Lammers, R. B., Steele, M., Moritz, R., Meredith, M., and Lee, C. M.: The large-scale freshwa-ter cycle of the Arctic, J. Geophys. Res., 111, C1101, https://doi.org/10.1029/2005JC003424, 2006.
Shirshov, P. and Fedorov, E.: Scientific work of the drifting north polar station, Nature, 141, 629–632, 1938.
Smolyar, I. and Adrov, N.: The quantitative definition of the Bar-ents Sea Atlantic Water: Mapping of the annual climatic cy-cle and interannual variability, ICES J. Mar. Sci., 60, 836–845, https://doi.org/10.1016/S1054-3139(03)00071-7, 2003. Soltwedel, T., Bauerfeind, E., Bergmann, M., Budaeva, N., Hoste,
E., Jaeckisch, N., von Juterzenka, K., Matthiessen, J., Mok-ievsky, V., Nöthig, E.-M., Quéric, N.-V., Saboltny, B., Sauter, E., Schewe, I., Urban-Malinga, B., Wegner, J., Wlodarska-Kowalczuk, M., and Klages, M.: HAUSGARTEN: multidisci-plinary investigations at a deep-sea, long-term observatory in the Arctic Ocean, Oceanography, 3, 46–61, 2005.
Steele, M. and Boyd, T.: Retreat of the cold halocline layer in the Arctic Ocean, J. Geophys. Res., 103, 10419–10435, 1998. Steele, M. and Ermold, W.: Steric sea level change in the Northern
Seas, J. Climate, 20, 403–417, 2007.
Strasser, C., Cook, R., Michener, W., and Budden, A.: Primer on data management: What you always wanted to know, A DataONE publication, https://doi.org/10.5060/D2251G48, 2012. Swift, J. H., Aagaard, K., Timokhov, L., and Nikiforov, E. G.: Long-term variability of Arctic Ocean waters: Evidence from a re-analysis of the EWG data set, J. Geophys. Res., 110, C03012, https://doi.org/10.1029/2004JC002312, 2005.
Toole, J. M., Krishfield, R. A., Timmermans, M.-L., and Proshutin-sky, A: The Ice-Tethered Profiler: Argo of the Arctic, Oceanog-raphy, 24, 126–135, https://doi.org/10.5670/oceanog.2011.64, 2011.
Treshnikov, A. F.: Results of the oceanological investigations by the “North Pole” drifting stations, Polar Geography, 1, 22–40, 1977. Weingartner, T., Aagaard, K., Woodgate, R., Danielson, S., Sasaki, Y., and Cavalieri, D.: Circulation on the North Central Chukchi Sea Shelf, Deep-Sea Res. Pt. II, 52, 3150–3174, 2005.
Wong, A. and Riser, S.: Profiling float observations of the upper ocean under sea ice off the Wilkes Land coast of Antarctica, J. Phys. Oceanogr., 41, 1102–1115, https://doi.org/10.1175/2011JPO4516.1, 2011.
Woodgate, R. A., Aagaard, K., and Weingartner, T. J.: Monthly temperature, salinity, and transport variability of the Bering Strait through flow, Geophys. Res. Lett., 32, L04601, https://doi.org/10.1029/2004GL021880, 2005.