Clinical outcomes of transcatheter aortic
valve implantation: from learning curve
to pro
fi
ciency
Mattia Lunardi,1Gabriele Pesarini,1Carlo Zivelonghi,1Anna Piccoli,1
Giulia Geremia,1Sara Ariotti,1Andrea Rossi,1Alessia Gambaro,1Leonardo Gottin,2 Giuseppe Faggian,2Corrado Vassanelli,1Flavio Ribichini1
To cite:Lunardi M, Pesarini G, Zivelonghi C, et al. Clinical outcomes of transcatheter aortic valve implantation: from learning
curve to proficiency.Open
Heart2016;3:e000420. doi:10.1136/openhrt-2016-000420
Received 8 February 2016 Revised 2 April 2016 Accepted 3 May 2016
1Division of Cardiology,
Department of Medicine, University of Verona, Verona, Italy
2Division of Cardiac Surgery,
Department of Surgery, University of Verona, Verona, Italy
Correspondence to Dr Flavio Ribichini; flavio.ribichini@univr.it
ABSTRACT
Objective:The use of transcatheter aortic valve implantation (TAVI) is growing rapidly in countries with a predominantly elderly population, posing a huge challenge to healthcare systems worldwide. The increment of human and economic resource consumption imposes a careful monitoring of clinical outcomes and cost-benefit balance, and this article is aimed at analysing clinical outcomes related to the TAVI learning curve.
Methods:Outcomes of 177 consecutive transfemoral TAVI procedures performed in 5 years by a single team were analysed by the Cumulative Sum of failures method (CUSUM) according to the clinical events comprised in the Valve Academic Research Consortium (VARC-2) safety end point and the VARC-2 definition of device success. Margins for events acceptance were extrapolated from landmark trials that tested both balloon or self-expandable percutaneous valves. Results:30-day and 1-year survival rates were 97.2% and 89.9%, respectively. Achievement of the primary end point (number of cases needed to provide the acceptable margin of the composite end point of any death, stroke, myocardial infarction, life-threatening bleeding, major vascular complications, stage 2–3 acute kidney injury and valve-related dysfunction requiring a repeat procedure) required the performance of 54 cases, while the learning curve to achieve‘device success’identified 32 cases to reach the expected proficiency. In this experience, the baseline clinical risk as assessed by the Society of Thoracic Surgeons (STS) score determined the long-term survival rather than the adverse events related to the learning curve.
Conclusions:A relatively large number of cases are required to achieve clinical outcomes comparable to those reported in high-volume centres and controlled trials. According to our national workload standards, this represents more than 2 years of continuous activity.
INTRODUCTION
Transcatheter aortic valve implantation (TAVI) is a safe therapeutic alternative to sur-gical aortic valve replacement (SAVR) in inoperable and high-risk patients.1–3
The superiority of TAVI over medical therapy has been shown in inoperable patients.1It is also non-inferior compared with SAVR in high-risk patients2and self-expandable valves are even better than SAVR.3
Transcatheter interventional options for high-risk patients with aortic valve stenosis (AVS) have dramatically changed the thera-peutic perspectives in a very short lapse of time, posing a huge therapeutic challenge to healthcare systems worldwide. Given the
KEY QUESTIONS
What is already known about this subject?
▸ Very little is known as to the number of cases required to overcome complications and failures of transcatheter aortic valve implantation (TAVI) at centres that start their activity in high-risk aortic patients. Some authors have shown an improvement in ancillary indicators of outcome with growing experience such as procedural time, dose of contrast media and radiation exposure, but differences in clinical terms have not been reported.
What does this study add?
▸ This study identifies a precise number of trans-femoral TAVI cases needed to overcome the learning curve, using a dedicated statistical method that is regularly applied to monitor the operator’s performances in cardiac surgery over time.
How might this impact on clinical practice?
▸ Our results indicate that a relatively long period of activity (about 2 years) is needed to warrant acceptable clinical outcomes during the start-up phase. Therefore, TAVI procedures should be concentrated in high-volume centres, and a proctoring on-site should be maintained over the first 50 cases rather than the few 8 or 10 currently advised by the valve manufacturers. This would optimise clinical outcomes from the beginning of a TAVI experience with a beneficial impact on clinical and economic results.
on September 12, 2020 by guest. Protected by copyright.
exponential growth of the workload represented by the elderly population with AVS, more centres are rapidly getting involved in this new treatment modality, and the
consequent increment of human and economic
resource consumption imposes a careful monitoring of clinical outcomes and cost-benefit balance.4
The present article reports on the TAVI experience of an Italian centre performing the first case in March 2010 and describes the evolution and results of the tech-nique over 5 years of continuous activity.
The aim of this report is to analyse the immediate and follow-up clinical outcomes of a TAVI programme since its implementation in relation to the learning curve, as an opportunity for evaluating results and determining options for further improvement.
METHODS
Study design, aims and patient population
Prospective single-centre study aimed at analysing retro-spectively the safety and efficacy of TAVI performed in patients with symptomatic AVS categorised as high risk, performed between March 2010 and March 2015 at the University Hospital of Verona, Italy.
Inclusion criteria were presence of severe symptomatic AVS; high surgical risk predicted by a logistic European
System for Cardiac Operative Risk Evaluation
(EuroSCORE)5 ≥20% or Society of Thoracic Surgeons (STS)6 score ≥10%. Patients at lower surgical risk (EuroSCORE<20%) were included when presenting comorbidities not well captured by current risk scores, such as porcelain aorta, previous chest radiotherapy, severe obstructive pulmonary disease, previous organ transplantation or any previous cardiac surgery.
Exclusion criteria were mechanical aortic prosthesis, obstructive hypertrophic cardiomyopathy, intraventricu-lar masses, sepsis or active endocarditis, and diseases with a <2-year life expectancy. All patients included in this analysis provided written informed consent as required by the Health Technology Assessment Agency of the Regione Veneto.
Clinical follow-up was planned at 1, 6 and 12 months and then yearly to assess: vascular complications; need for permanent pacemaker (PPM) implantation and renal function; functional status (New York Heart Association (NYHA) classification) and clinical events: death, myocardial infarction (MI), stroke and heart failure needing rehospitalisation. The survival status was determined by direct clinical contact of all living patients, or by verification of death certificates in all fatal cases.
The primary end point was: the learning curve analysis for TAVI procedures performed by a single interven-tional team, aimed at detecting a correlation between experience and the 30-day safety composite end point included in the Valve Academic Research Consortium (VARC-2), that is, any death, stroke, periprocedural MI, life-threatening bleeding, major vascular complications,
stage 2–3 acute kidney injury (AKI) and valve-related dysfunction requiring a repeat procedure.7 The Cumulative Sum of failures Analysis (CUSUM) was used to assess the team performances over time.8
Secondary end points: learning curve analysis for VARC-2 device success;7 the global survival rate at 30 days and 1 year; the survival-free from the composite of death from any cause, stroke, MI and rehospitalisation for heart failure, at 30 days, and 1 year.
Clinical events were adjudicated by an internal com-mittee that followed each patient during the first year follow-up. The same three TAVI operators performed all the procedures during the study period.
Devices and procedure
Both Edwards SAPIEN (Edwards Lifesciences, Irvine, California, USA) and Medtronic CoreValve (Medtronic, Minneapolis, Minnesota, USA) were implanted. Thefirst 17 cases were performed with the SAPIEN Novaflex 23F system, the first 8 of which were proctored by an exter-nal expert. From case number 18, the SAPIEN XT valve replaced the Novaflex. From July 2012, the Medtronic CoreValve prosthesis was also implemented in the routine practice, thefirst 6 cases also being proctored by an external expert.
Indications to TAVI and the access site for valve implantation were discussed and decided by the Institutional Heart Team. This analysis of the learning curve refers to the transfemoral experience only. Indeed, transapical TAVI was performed in 25 cases during the same study period but was not included in this study.
All patients received dual antiplatelet therapy with standard loading doses of aspirin and clopidogrel before the procedure. At follow-up, only one antiplatelet agent was continued (usually aspirin), or oral anticoagulation when clinically indicated. Patients treated with coronary angioplasty received either bare metal, or second-generation drug-eluting stents, and dual antiplatelet therapy or a triple association (when required) were was maintained from 1 or 3 months respectively. All patients stayed in the intensive care unit during thefirst 24 hours after the procedure and then were transferred to the cardiology ward if no complications ensued.
Definitions
Cardiovascular mortality, MI, stroke, AKI, bleeding, vas-cular complications, device success and residual aortic regurgitation (AR) were defined according to the VARC-2 recommendations.7 Clinical risk was ranked
according to the logistic EuroSCORE5 the new
EuroSCORE-II9and the STS score.6
Statistical analysis
Categorical data are expressed as numbers and percen-tages, and compared by χ2 test, as appropriate. Continuous variables are reported as mean±SD for normal distributions are otherwise reported as median
on September 12, 2020 by guest. Protected by copyright.
±IQR. Differences between means were tested by the t-test or Mann-Whitney U test, where appropriate. Univariate and multivariate stepwise Cox regression ana-lyses were performed to identify independent predictors of events. ORs and their corresponding 95% CIs are pro-vided. Cumulative survival curves were drawn using the Kaplan-Meier method, and the log-rank test was used to compare differences between groups. The learning curve of the TAVI procedure was evaluated using an unadjusted CUSUM.8 This method, initially created for industrial analyses, can generate quality control charts for monitoring the operator’s performances over time. On the vertical axis is reported the cumulative number of failures, whereas the horizontal axis reports the oper-ation number in a consecutive fashion (I). The end point (failure) definition is reported for each chart. Type I(α) and type II(β) errors were both set at 0.05. To identify acceptable (lower p0) and unacceptable (higher p1) failure limits, end points incidence reported in seminal high-risk TAVI trials was analysed (Partner ‘B’,1 US Pivotal Trial,3CHOICE Trial)10and used to calculate the boundaries for the control charts. Rates of 30 days VARC-2 safety end point in such trials indicated a 20% threshold as ‘acceptable’, while a 30% rate was consid-ered unacceptable. Following the same method, the pro-cedural non-success acceptable limit was set at 10%, while a 20% rate denoted an out of control procedure. Since major bleeding alone occurred in 17–25% of cases, the limits for the CUSUM regarding this event plus the primary end point were set, respectively, at 30% and 40%. The lower boundary was constructed using the formula L0=I{ln[(1−p0/1−p1)]/ln(OR)}−{ln[(1−α)/
β]/[ln(OR)]}, and the higher boundary using the formula L1=I{ln[(1−p0/1−p1)]/ln(OR)}+{ln[(1−β)/α]/ [ln(OR)]}, where I is the operation number and OR is defined as [ p1(1−p0)]/[ p0(1−p1)]. When the cumula-tive failure line intersects the lower boundary, the team’s performance is considered proficient. A p value <0.05 for two-sided tests was considered statistically significant. Statistical analysis was carried out using the statistical software SPSS V.20.0 (SPSS, Chicago, Illinois, USA).
RESULTS
Baseline characteristics and procedure details
A total of 177 patients were analysed. Baseline character-istics are shown in table 1. The logistic EuroSCORE was
≥20% in 100 patients (56.5%), and 10–20% in 77 (43.5%).
Procedural details are listed intable 2.
As for the initial manufacturer’s indications, vascular access was obtained with surgical approach in the first 20 patients (11.2%), and then percutaneous access was performed in all cases. The same percutaneous closure device (Prostar, Abbott, Abbott Park, Illinois, USA) was used in all cases. No patient died or needed surgery during the TAVI procedure. Valve-related dysfunction occurred in four cases (2.3%): one case of embolisation
of an Edwards valve during the delivery phase, and in the other three cases because of a severe AR after afirst CoreValve (two cases) or a first Edwards valve (one case). In all cases, the implantation of a second valve was successful.
Clinical outcomes
The global survival rate at 30 days and 1 year was 97.2% and 89.9%, respectively. The survival-free from the com-posite of death from any cause, stroke, MI and rehospita-lisation for heart failure, at 30 days and 1 year was 95.5% and 76%, respectively.
Nine patients (5.1%) suffered AKI with increment of creatinine levels >26.4μmol/L compared with baseline (7). In seven cases, AKI was stage 1, and in two patients transient kidney replacement therapy was required (stage 3 AKI), but in all cases creatinine levels returned to baseline; and no patient needed permanent dialysis. Implantation of a PPM was necessary in 14 cases (7.9%),
Table 1 Baseline characteristics
Variables Total population (177)
Age, years 80.8±7.7
Logistic EuroSCORE (%) 28.6±20.1
Male, n (%) 79 (44.6%)
BMI, kg/m2 24.7±6.2
GFR<30 mL/min, n (%) 41 (23.2%)
Anaemia,* n (%) 91 (51.4%)
Dyslipidaemia, n (%) 127 (71.8%)
COPD, n (%) 47 (26.6%)
Diabetes, n (%) 59 (33.3%)
Hypertension, n (%) 150 (84.7%)
Previous AMI, n (%) 40 (22.6%)
Atrial fibrillation, n (%) 66 (37.3%)
Previous stroke, n (%) 15 (8.5%)
PVD, n (%) 79 (44.6%)
CAD, n (%) 105 (59.3%)
Previous CABG, n (%) 35 (19.8%)
Previous AVR, n (%) 10 (5.6%)
Previous MVR, n (%) 3 (1.7%)
PM, n (%) 19 (10.7%)
Syncope, n (%) 52 (29.4%)
Stable angina, n (%) 66 (37.3%)
Unstable angina, n (%) 12 (6.8%)
Cardiogenic shock, n (%) 59 (33.3%)
NYHA class I or II, n (%) 30 (17%)
NYHA class III or IV, n (%) 147 (83%)
Recent PCI, n (%) 24 (13.6%)
Continuous variables are expressed as average±SD.
*Anaemia: cut-off Hb≤13 g/dL for male, Hb≤12 g/dL for female. AMI, acute myocardial infarction; AVR, aortic valve replacement; BMI, body mass index; CABG, coronary artery bypass graft; CAD, coronary artery disease; COPD, chronic obstructive pulmonary disease; EuroSCORE, European System for Cardiac Operative Risk Evaluation; GFR, glomerular filtration rate (based on Cockroft-Gault); MVR, mitral valve replacement; NYHA, New York Heart Association; PM, pacemaker; PVD, peripheral vascular disease; recent PCI, percutaneous coronary intervention <3 months before TAVI; TAVI, transcatheter aortic valve implantation.
on September 12, 2020 by guest. Protected by copyright.
of which 9 were after Medtronic CoreValve (17.6%), and 5 after Edwards SAPIEN (4%).
Primary end point: Figure 1A shows the relation between the learning curve and the 30-day VARC-2 safety end point included in the model. The perform-ance of 54 cases was found to determine a level of
‘acceptable performance’ according to the prespecified parameters. Figure 1B indicates the primary end point for either the balloon of the self-expandable valve types.
Occurrence of singular clinical events is shown in
table 3.
Secondary end points: Figure 1C shows the relation between the number of cases performed and device success.
When the clinical outcomes were correlated to the learning curve adjusting for the baseline clinical risk, the results were identical since the risk profile of the patients’ population was the same during the whole
dur-ation of the study (mean logistic EuroSCORE,
EuroSCORE-II and STS in thefirst 53 patients vs subse-quent cases: 27.7% vs 29.4% ( p=0.63), 11.7% vs 11.7% ( p=0.99) and 8.9% vs 9.2% ( p=0.83), respectively). Therefore, our results related to the learning curve apply to very high-risk patients, and may differ in lower risk populations.
The contrast media used during the procedure amounted to 156.8±10 mL (161.5 for thefirst 53 cases vs 153.9 from case 54, p=0.59). Also, the procedural and fluoroscopy times show a downward trend between the two groups of patients: from 114.5 to 102.4 ( p=0.15) and from 22.2 to 18.7 ( p=0.7) minutes, respectively. Median hospital stay was 10 days (IQR=5–14 days), of which 2 were in the intensive care unit. There was a
significant reduction of the hospital stay from case 54 (12 days, IQR=5–18 days vs 9 days, IQR=5–12 days; p=0.005), with a reduction also of the intensive care from 2 (IQR=1–3 days) days to 1 (IQR=0.5–2 days) day ( p=0.02).
At univariate analysis, predictors of the primary end point were previous stroke (OR=4.9; 95% CI 2.1 to 9.17; p=0.001) and coronary artery disease (OR=2.67; 95% CI 1 to 7.1; p=0.05). Of these, only previous stroke (OR=4.51; 95% CI 1.8 to 10.2; p<0.001) was an inde-pendent predictor of the primary end point at a multi-variate analysis.
Long-term outcome: Survival-free of major events was analysed in all patients who reached 1 year after the pro-cedure (129). The global survival rate was 89.9%. Patients with a EuroSCORE≥20% had a trend to higher
mortality from any cause than patients with a
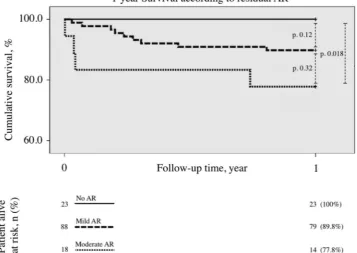
EuroSCORE<20% (13.3% vs 5.6%, p=0.24). According to EuroSCORE-II, mortality was 15% in the group≥10% and 9.2% in the group <10% ( p=0.42), and according to the STS score it was 19% in those with STS≥10% and 5.7% in STS score <10 ( p=0.028). Cardiovascular events accounted for one-third of the total causes of death during the follow-up period. It is worth mentioning that survival at 1 year was significantly different according to the degree of residual AR after TAVI (regardless of the type of valve; figure 2). At 1 year, stroke occurred in 5.4% of cases, MI in 2.3% of patients, heart failure in 10.9% and the composite event rate of death, stroke, MI and heart failure needing hospitalisation occurred in 24% of patients. No statistically significant difference in mortality (11.3% vs 9.2%, p=0.77) or in the composite event rate (30.2% vs 19.7%, p=0.21) was observed at
Table 2 Procedural details according to device
Variables Total population (177)
Edwards SAPIEN
(126) Medtronic CoreValve (51) p Value
Preventive PCI pre-TAVI, n (%) 24 (13.6%) 17 (13.5%) 7 (13.7%) 0.99
Iliac PTA before TAVI, n (%) 15 (8.5%) 8 (6.3%) 7 (13.7%) 0.14
PCI during TAVI, n (%) 6 (3.4%) 3 (2.4%) 3 (5.9%) 0.54
Valvular pathology, n (%)
AS 142 (80%) 115 (91.3%) 27 (52.9%)
AS+AR 25 (14.1%) 8 (6.3%) 17 (33.3%)
Degenerated aortic prosthesis (VIV) 10 (5.6%) 3 (2.4%) 7 (13.7%)
Prosthesis size, n (%)
20 mm 1 (0.6%) 1 (0.8%) 0
23 mm 56 (31.6%) 51 (40.5%) 5 (9.8%)
26 mm 74 (41.8%) 61 (48.4%) 13 (25.5%)
29 mm 38 (21.5%) 13 (10.3%) 25 (49%)
31 mm 8 (4.5%) 0 8 (15.7%)
Balloon post dilation, n (%) 13 (7.3%) 4 (3.2%) 9 (17.6%) 0.002
Conversion to heart surgery, n (%) 0 0 0
Death during procedure, n (%) 0 0 0
VARC-2 device non-success, n (%) 6 (3.4%) 4 (3.2%) 2 (3.9%) 0.99
AR, aortic regurgitation; AS, aortic stenosis; PCI, percutaneous coronary intervention; PTA, percutaneous transluminal angioplasty; VARC-2, Valve Academic Research Consortium; VIV, valve in valve.
on September 12, 2020 by guest. Protected by copyright.
Figure 1 (A) CUSUM analysis for the primary end point (VARC-2 safety end point at 30 days composite of: death, stroke, life-threatening bleeding, major vascular complications, AKI stage 2–3 and valve-related dysfunction requiring a repeat procedure), showing in-control procedure. Formal proficiency was obtained at operation n.54 when the cumulative failure curve crossed the predicted lower reference (estimated 20%). (B) CUSUM analysis for the primary end point for Edwards
balloon-expandable valves (n=126) and CoreValve self-expandable valves (n=51). Formal proficiency was obtained at operation n.50 for Edwards (yellow line) and operation n. 36 for CoreValve (red line) prostheses. Of note, our centre began the TAVI programme with Edwards devices; therefore, early CoreValve implants may have benefited from the acquired experience. (C) CUSUM analysis for secondary end point (VARC-2 device non-success). Acceptable event rate was set to 10% and the total number of failures were six. Proficiency level for this end point was formally reached after 32 cases. AKI, acute kidney injury; CUSUM, Cumulative Sum of failures Analysis; TAVI, transcatheter aortic valve implantation; VARC-2, Valve Academic Research Consortium.
on September 12, 2020 by guest. Protected by copyright.
1 year between thefirst 53 cases and the rest. Patients in NYHA class I or II were 17% before TAVI and 70% after 1 year. Renal function improved significantly, in particu-lar among those with the worst estimated glomeruparticu-larfi l-tration rate before TAVI: serum creatinine changed from 163.7±114.4μmol/L at baseline to 127.6±52.8μmol/L at 1 year, p=0.015.
DISCUSSION
Our study reports the immediate and 1-year clinical out-comes of a consecutive series of high-risk patients with symptomatic AVS treated with transfemoral TAVI mostly performed with first-generation transcatheter valve systems in a single Italian institution from its learning period. The study population is comparable to that enrolled in the Partner Trial cohort B that had a mean logistic EuroSCORE of 26.4%.11 Recent studies have enrolled lower risk patients: the CoreValve US Pivotal High-Risk Study had a mean logistic EuroSCORE of 17.6%,3 similar to other European series (EuroSCORE: 21.9%, 18.5% and 14.7%, respectively).12–14
The degree of expertise developed during a 5-year period of activity before the advent of the most recent devices suggests the following results:
More than 50 cases are required to control the most relevant complications, and 32 to avoid device non-success. These numbers take into account the use of balloon-expandable and self-expandable aortic bio-prosthesis, the latter requiring smaller numbers most likely because of the experience previously acquired with the former, a result that confirms the validity of the CUSUM model. The use of the two valve types reflects the needs of a referral centre that receives a high risk and complex population.
Our experience suggests that the good performance of the transcatheter valves since the first models, the accurate diagnostic workout and afirst learning process assisted by an on-site proctor enable a reliable start-up
Table 3 Events at 30 days
Variables
30 days (177 patients)
30 days (first 53 cases)
30 days (last 124 cases)
Death, n (%) 5 (2.8%) 2 (3.8%) 3 (2.4%)
Cardiovascular 2 (1.1%) 1 (1.9%) 1 (0.8%)
Non-cardiovascular 3 (1.7%) 1 (1.9%) 2 (1.6%)
Stroke, n (%) 4 (2.3%) 2 (3.8%) 2 (1.6%)
AMI, n (%) 0 0 0
Major vascular complications, n (%)
18 (10.2%) 6 (11.3%) 12 (9.7%)
Life-threatening bleeding, n (%)
6 (3.4%) 2 (3.8%) 4 (3.2%)
AKI, n (%) 9 (5.1%) 3 (5.7%) 6 (4.8%)
Stage 1 7 (4%) 3 (6.1%) 4 (3.2%)
Stage 2 or 3 2 (1.1%) 0 2 (1.6%)
PPM post-TAVI, n (%) 14 (7.9%) 2 (3.8%) 12 (9.7%)
30-day safety end point, n (%)
24 (13.6%) 8 (15.1%) 16 (12.9%)
AKI, acute kidney insufficiency; AMI, acute myocardial infarction; PPM, permanent pacemaker; RBC, red blood cell units; TAVI, transcatheter aortic valve implantation.
Figure 2 Survival curve at 1 year follow-up (129 patients) according to the entity of residual AR: the figure shows a significant survival reduction when residual AR was moderate (independently of the type of valve). Event rates were calculated by the Kaplan-Meier method and compared with the use of the log-rank test. AR, aortic regurgitation.
on September 12, 2020 by guest. Protected by copyright.
period with good long-term results despite relatively fre-quent complications, mainly related to the vascular access site. However, it is worth mentioning that although a trend towards better clinical outcomes was apparent with more experience, the long-term survival was not strongly affected by the learning curve-related events, but rather by the baseline risk as identified by the STS score.
Our results related to the learning curve do notfind a comparison in available publications. A first assessment of the TAVI learning curve was performed by Webb and colleagues.15 In a rough analysis comparing the clinical outcomes obtained in thefirst half of their 270 patients caseload versus the second half, a trend towards better clinical outcomes was observed in the second half, but these later patients had a significantly lower STS risk score (8.5%) compared with the former (10.5%), p=0.01. Subsequently, Alli et al16 monitored the duration of the intervention, the contrast media amount and thefl uoros-copy time, and compared thefindings observed in tertiles based on sequence. Despite the small sample size of this analysis (44 cases), the authors claimed that 30 cases were needed to improve some procedural results with the Edwards Sapien valve, but the clinical outcomes were not analysed. Following these findings, Cerilloet al17 argued that the CUSUM analysis would be more a sensible mean to detect deviations from the expected clinical outcomes and suggested that this method should be used to monitor clinical expertise rather than procedural surro-gates. Accordingly, our study has detected a precise number of cases needed to define the learning curve process using the proposed CUSUM analysis as first described by Rogers et al.8 This finding supports the goodness of the CUSUM applied in interventional cardi-ology as initially estimated by Cerilloet al.17
Other observations derived from our experience are aligned with previous data.
Overall mortality at 30 days (2.8%) is low comparable to that observed in monitored high-volume centres18 and much lower than that predicted by the logistic EuroSCORE (28.6%). Other risk scores are needed to better assess periprocedural risks in complex TAVI candi-dates. Despite the complexity of the procedure and the administration of contrast media, AKI occurs in very few cases (5.1%) and no patient needed permanent dialysis after the procedure. This finding suggests that the improvement of renal perfusion after a percutaneous replacement of the stenotic aortic valve largely super-sedes the possible risks of renal damage related to the procedure. PPM implantation was needed in <8% of cases within 30 days with a significantly higher rate with the implantation of the first-generation CoreValve. Other series reported a PPM implantation of around 15%.12–14 Lower rates of PPM implantation are expected with the availability of new valve types.
Major stroke occurred in 2.3% of cases at 30 days and 5.4% within 1 year; most cases reported in the long term occurred in patients with atrialfibrillation.
The rate of rehospitalisation for heart failure at 30 days was low, but it increased to 9% at 6 months, and 10.9% at 1 year. This complication is most likely related to the multiple comorbidities of the elderly rather than to the procedure itself, and was always managed by medical therapy adjustment.
CONCLUSION
The clinical results of this initial experience replicate those obtained in randomised studies and in large series per-formed in centres of excellence. This is coherent with our observation of a similar clinical outcome at 1 year regardless of the learning curve. Patient selection granted by a Heart Team discussion, a meticulous diagnostic workout and a learning period assisted by an expert proctor on-site allow to obtain good clinical results since the beginning of a TAVI programme. This concept, however, applies to a large volume interventional centre with all necessary facilities, and a previous consolidated experience in coronary, struc-tural and peripheral endovascular therapeutics performed by the same operators. Nevertheless, a relatively large number of cases were needed to reduce the most common periprocedural complications that negatively impact the length of hospital stay and resource consumption.
A careful monitoring of the learning curve may there-fore have important clinical and economic implications in the perspective of a more widespread availability of TAVI procedures. Indeed, in-hospital complications are common at the beginning, and a relatively large number of cases are needed to obtain proficiency, a work volume that in most European countries would require about 2 years of activity according to some national statistics.19 On-site proctoring and monitoring during this period may prove cost-effective. However, with the advent of smaller, simpler and more effective transcatheter valve systems, the learning curve will most likely be shorter in the near future. Similarly, the entity of the residual AR will most likely decline with new valves, and this may have an important impact on the long-term survival of patients with TAVI. All these are important considera-tions given the high cost of the procedure, the continu-ous growth of the elderly population with AVS and the parallel exponential increment of the need for TAVI.
Study limitations
This is a single-centre experience that started in 2010. As such, the use of the very first valve designs is limited to few cases, therefore reducing the chance of complica-tions that were common in the first TAVI era. On the other hand, the most recent valve models that signifi -cantly reduce complications (mainly vascular and residual AR) are not included in this analysis. The stan-dardised screening and procedures, and the complete-ness of follow-up may provide however, results that are indicative of a developing experience from learning to proficiency also elsewhere.
on September 12, 2020 by guest. Protected by copyright.
Contributors ML and FR conceived the research and drafted the manuscript. CZ, AP and GG collected and controlled the haemodynamic/procedural data. AR and AG collected and controlled the echocardiography and baseline clinical data. SA and LG obtained, collected and interpreted the 30 days follow-up data. GP planned and performed the statistical analysis and drafted the manuscript. GF and CV reviewed the manuscript for the final form.
Competing interests FR is a proctor for Edwards Lifescience and member of
the EMEA Advisory Board of Medtronic.
Patient consent Obtained.
Ethics approval CESC Verona.
Provenance and peer review Not commissioned; internally peer reviewed.
Data sharing statement No additional data are available.
Open Access This is an Open Access article distributed in accordance with
the Creative Commons Attribution Non Commercial (CC BY-NC 4.0) license, which permits others to distribute, remix, adapt, build upon this work non-commercially, and license their derivative works on different terms, provided the original work is properly cited and the use is non-commercial. See: http:// creativecommons.org/licenses/by-nc/4.0/
REFERENCES
1. Makkar RR, Fontana GP, Jilaihawi H,et al. Transcatheter aortic-valve replacement for inoperable severe aortic stenosis.
N Engl J Med2012;366:1696–704.
2. Kodali SK, Williams MR, Smith CR,et al. Two-year outcomes after transcatheter or surgical aortic-valve replacement.N Engl J Med
2012;366:1686–95.
3. Adams DH, Popma JJ, Reardon MJ,et al. Transcatheter aortic-valve replacement with a self-expanding prosthesis.N Engl J Med
2014;370:1790–8.
4. Ribichini F, Taggart D, Vassanelli C. Numbers needed to treat (lives!) and numbers needed to save (money).EuroIntervention
2013;9:175–7.
5. Nashef SA, Roques F, Michel P,et al. European system for cardiac operative risk evaluation (euroscore).Eur J Cardiothorac Surg
1999;16:9–13.
6. O’Brien SM, Shahian DM, Filardo G,et al. The society of thoracic surgeons 2008 cardiac surgery risk models: part 2—isolated valve surgery.Ann Thorac Surg2009;88:S23–42.
7. Kappetein AP, Head SJ, Généreux P,et al. Updated standardized endpoint definitions for transcatheter aortic valve implantation: the valve academic research consortium-2 consensus document (VARC-2).Eur J Cardiothorac Surg2012;42:S45–60.
8. Rogers CA, Reeves BC, Caputo M,et al. Control chart methods for monitoring cardiac surgical performance and their interpretation.
J Thorac Cardiovasc Surg2004;128:811–19.
9. Nashef SA, Roques F, Sharples LD,et al. Euroscore-II.
Eur J Cardiothorac Surg2012;41:734–44; discussion 744–5. 10. Abdel-Wahab M, Mehilli J, Frerker C,et al. Comparison of
balloon-expandable vs self-expandable valves in patients undergoing transcatheter aortic valve replacement: the choice randomized clinical trial.JAMA2014;311:1503–14.
11. Leon MB, Smith CR, Mack M,et al. Transcatheter aortic-valve implantation for aortic stenosis in patients who cannot undergo surgery.N Engl J Med2010;363:1597–607.
12. Gilard M, Eltchaninoff H, Iung B,et al. Registry of transcatheter aortic-valve implantation in high-risk patients.N Engl J Med
2012;366:1705–15.
13. Moat NE, Ludman P, de Belder MA,et al. Long-term outcomes after transcatheter aortic valve implantation in high-risk patients with severe aortic stenosis: The U.K. TAVI (United Kingdom Transcatheter Aortic Valve Implantation) registry.J Am Coll Cardiol2011;58:2130–8. 14. D’Errigo P, Barbanti M, Ranucci M,et al. Transcatheter aortic valve
implantation versus surgical aortic valve replacement for severe aortic stenosis: results from an intermediate risk propensity-matched population of the Italian observant study.Int J Cardiol
2013;167:1945–52.
15. Gurvitch R, Tay EL, Wijesinghe N,et al. Transcatheter aortic valve implantation: lessons from the learning curve of the first 270 high-risk patients.Catheter Cardiovasc Interv2011;78:977–84. 16. Alli OO, Booker JD, Lennon RJ,et al. Transcatheter aortic valve
implantation: assessing the learning curve.JACC Cardiovasc Interv
2012;5:72–9.
17. Cerillo AG, Murzi M, Glauber M,et al. Quality control and the learning curve of transcatheter aortic valve implantation.JACC Cardiovasc Interv2012;5:456; author reply 456–7.
18. Badheka AO, Patel NJ, Panaich SS,et al. Effect of hospital volume on outcomes of transcatheter aortic valve implantation.Am J Cardiol
2015;116:587–94.
19. Società Italiana di Cardiologia. Dati di attività dei Laboratori di Emodinamica 2013.Giornale Italiano di Cardiologia Invasiva
2014;2:5–39.
on September 12, 2020 by guest. Protected by copyright.