Journal of Industrial Engineering and Management Studies
Vol. 4, No. 2, 2017, pp. 85-102
DOI: 10.22116/JIEMS.2017.54609
www.jiems.icms.ac.ir
A New Model to Speculate CLV Based on Markov Chain Model
MohammadJafar Tarokh1,*, Mahsa EsmaeiliGookeh1
Abstract
The present study attempts to establish a new framework to speculate customer lifetime value by a stochastic approach. In this research the customer lifetime value is considered as combination of customer’s present and future value. At first step of our desired model, it is essential to define customer groups based on their behavior similarities, and in second step a mechanism to count current value, and at the end estimate the future value of customers. Having a structure in modeling customer churn is also important to have complete customer lifetime value computation. Clustering as one of data mining techniques is practiced to help us analyze the different groups of customers, and extract mathematical model to count the customers value. Thereafter by using Markov chain model as stochastic approach, we predict future behavior of the customer and as a result, estimate future value of different customers. The proposed model is demonstrated by the customer demographic data and historical transaction data in a composite manufacturing company in Iran.
Keywords: Customer Lifetime Value; Markov Chain Model; Clustering; Classification; Customer Behavior.
Received: August 2017-24
Revised: November 2017-05
Accepted: December 2017-18
1. Introduction
The major purpose of enterprises is establishing sustainable relationships with beneficial customers (Ryals & Knox 2005); So that many companies try to create relationships, consider the profitability of the relationships, and maintain good relationships with good customers. To do so, counting customers profitability and ranking them by their value is an important issue. One of the useful functions to measure the value of the customers is CLV† (Ekinci, Uray, et al. 2014).
Lots of studies have been done on concept of CLV. They can be categories in two main groups. The first group of CLV researches, develops new models to calculate CLV based on different approaches, such as RFM, probabilistic models, economic models, persistence models and so on (Lin et al. 2017) (Farzanfar & Delafrooz 2016) (Estrella-ramón et al. 2016) (Hamdi & Zamiri 2016) (Segarra-moliner & Moliner-tena 2016) (Hwang 2016) (Zhang et al. 2016) (Safari et al. 2016) (Samizadeh 2015) (Sunder 2015) (Abrahamsson 2015) (Hwang
2015) (Bagheri & Tarokh 2014) (Ekinci, Uray, et al. 2014) (Clempner & Poznyak 2014) (Safari et al. 2014) (Chen & Fan 2013) (Holm et al. 2012) (Khajvand & Jafar 2011) (Chan et al. 2010) (Koopaei 2009) (Aeron et al. 2008) (Haenlein et al. 2007) (Gupta et al. 2006) (Ho et al. 2005) (Ching et al. 2004) (Pfeifer & Carraway 2000) (Berger & Nasr 1998) .The second group uses existing CLV models to support decision making, and strategy development (Horák 2017) (Wang & Huang 2016) (Danaee et al. 2013) (Dwyer 1997). Ranking customers by CLV can help organizations to plan for promotion, which is another conceptual application of second group of CLV papers (Hu et al. 2018) (Ekinci, Ulengin, et al. 2014). In 2017, CLV was measured to account all direct revenues stream of a fan attending major league Baseball (MLB) games. Such studies are categorized as the second group of CLV researches, and can measure the effectiveness of marketing activities (Drea et al. 2017).
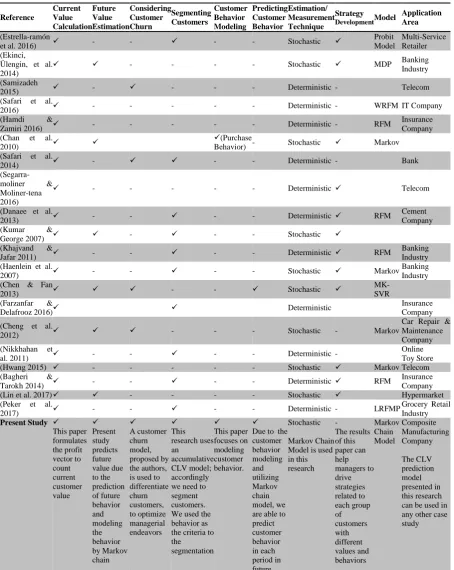
The present article can be categorized in first group, because we are going to develop a new model to calculate CLV. Although lots of CLV models were established, but more new models are needed to cover all necessary aspects in CLV calculation. The proposed model in this study uses Markov chain model and data mining techniques to calculate the value of different groups of customers. This model also can calculate the churn probability of customers.
Table 1. Comparing CLV Models Reference Current Value Calculation Future Value Estimation Considering Customer Churn Segmenting Customers Customer Behavior Modeling Predicting Customer Behavior Estimation/ Measurement Technique Strategy DevelopmentModel Application Area (Estrella-ramón
et al. 2016) - - - - Stochastic
Probit Model
Multi-Service Retailer (Ekinci,
Ülengin, et al. 2014)
- - - - Stochastic MDP Banking
Industry
(Samizadeh
2015) - - - - Deterministic - Telecom
(Safari et al.
2016) - - - Deterministic - WRFM IT Company
(Hamdi &
Zamiri 2016) - - - Deterministic - RFM
Insurance Company (Chan et al.
2010)
(Purchase
Behavior) - Stochastic Markov (Safari et al.
2014) - - - Deterministic - Bank
(Segarra-moliner & Moliner-tena 2016)
- - - Deterministic Telecom
(Danaee et al.
2013) - - - - Deterministic RFM
Cement Company (Kumar &
George 2007) - - - Stochastic
(Khajvand &
Jafar 2011) - - - - Deterministic RFM
Banking Industry (Haenlein et al.
2007) - - - - Stochastic Markov
Banking Industry (Chen & Fan
2013) - - Stochastic
MK-SVR (Farzanfar &
Delafrooz 2016) Deterministic
Insurance Company
(Cheng et al.
2012) - - - Stochastic - Markov
Car Repair & Maintenance Company (Nikkhahan et
al. 2011) - - - - Deterministic -
Online Toy Store
(Hwang 2015) - - - Stochastic Markov Telecom
(Bagheri &
Tarokh 2014) - - - - Deterministic RFM
Insurance Company
(Lin et al. 2017) - - - - Stochastic Hypermarket
(Peker et al.
2017) - - - - Deterministic - LRFMP
Grocery Retail Industry
Present Study
This paper formulates the profit vector to count current customer value Present study predicts future value due to the prediction of future behavior and modeling the behavior by Markov chain A customer churn model, proposed by the authors, is used to differentiate churn customers, to optimize managerial endeavors This research uses an accumulative CLV model; accordingly we need to segment customers. We used the behavior as the criteria to the segmentation This paper focuses on modeling customer behavior. Due to the customer behavior modeling and utilizing Markov chain model, we are able to predict customer behavior in each period in future Stochastic Markov Chain Model is used in this research - The results of this paper can help managers to drive strategies related to each group of customers with different values and behaviors Markov Chain Model Composite Manufacturing Company The CLV prediction model presented in this research can be used in any other case study
The present research calculates and predicts CLV by the desired Markov chain model. To validate the new model, 2300 transactional data from a composite manufacturing company were gathered and analyzed, and results were shown in section 5.
Gupta et al. (2006). In section 3 we propose an improved model to calculate CLV. In section 4 we define processes to determine the parameters of our new CLV model. The proposed customer lifetime value computation model is applied to a composite manufacturing company in Iran in the 5th section. Section 6 concludes the paper with some future research directions.
2. CLV Prediction Model
For the first time customer lifetime value concept was introduced by Kotler in 1974; He defined it as, present value of the future profit stream expected given a time horizon of transacting with the customer. Some other definitions can be found in articles. In many studies CLV is calculated from the beginning of the relationship to the present time, which is named present value of the customer, but in some other studies, CLV is the summation of present value and future value, where the future value is related to the profit contributed from the customer from now till future, an undefined time in future where the relationship will be terminated (Cheng et al. 2012). To have a complete CLV calculation, the lifetime of the customer must start from the time when the customer is a potential customer, and the company is paying cost to attract him, till the churn time in future (Hwang 2015).
The basic formulation of CLV is (Berger & Nasr 1998):
𝐶𝐿𝑉 = 𝑅𝑒𝑣𝑒𝑛𝑢𝑒 − (𝑐𝑜𝑠𝑡 𝑜𝑓 𝑠𝑎𝑙𝑒𝑠 + 𝑝𝑟𝑜𝑚𝑜𝑡𝑖𝑜𝑛 𝑒𝑥𝑝𝑒𝑛𝑠𝑒𝑠) (1)
Other models of CLV are derived from the above formulation which is common formulation in many studies:
LTV= ∑𝑛𝑡=0𝜋(𝑡).(1+𝑟)1 𝑡 (2)
where (t) is the profit contributed by a customer at time t, r is the interest rate, and n is the number of considering periods of the customer lifetime (Cheng et al. 2012).
In 2006, Gupta classified CLV models into six groups. The first group was RFM, which expanded to WRFM1 and ERFM2. Simple RFM models count CLV based on Recency3 (R),
Frequency4 (F) and Monetary5 (M). In WRFM models, based on the case study, each parameter weighs differently (Liu & Shih 2005).
𝐶𝐼𝑗 = 𝑤𝑟𝐶𝑅𝑗+ 𝑤𝐹𝐶𝐹𝑗+ 𝑤𝑀𝐶𝑀𝑗 (3)
Extended RFM models add essential parameters to R, F and M. For example RFMTC, adds two new parameters related to the case study (Yeh et al. 2009). Some probabilistic methods have been used to calculate CLV, such as Markov chain model in Pfeiffer study (Kumar & George 2007). Probabilistic model is the second group that tries to predict customer behavior and count future CLV by stochastic approaches. Markov chain model is a stochastic model that can predict the customers’ possible behavior changes in future transaction periods (Cheng et al. 2012). Third models are Economic models, which work on the underlying philosophy of the probability models. NBD/Pareto model is used in this group of CLV models.
(1) Weighted RFM (2) Extended RFM
(3) Time spent from the last purchase (4) Number of purchase
Persistence Models, Computer science and Diffusion/growth models are next groups of CLV models based on the Gupta’s study.
3. Improved CLV Model
In this paper we are going to propose a new model to calculate CLV. To do so, we will predict the customer behavior and segment customers by their behavior. The advantages of this model, which differentiate it from other studies, is duration of customer behavior monitoring, which does not finish in churn time, but continues after the churn time, to have a complete and even beneficial CLV estimation and modeling customer behavior that helps to predict future behavior and future lifetime value of the customers. In this part we will explain the methodology of the paper.
First of all we identify customers, after that cluster customer to find similar behaviors, Afterward cluster analysis will be done to name each group with a suitable title. Thereafter we will classify data by data mining methods to understand the effective parameters that shape customer groups. By analyzing the parameters, the profit-making function (named profit vector) can be extracted. To estimate the potential CLV in future we need a stochastic approach. As it was explained in sections 2, Markov chain model can be a good choice. In Markov chain model, states must be defined in a form that makes researchers able to track the customers’ behavior in next periods. For this purpose each class of customers, achieved by data mining techniques, were defined as a state in Markov chain model. The transition matrix of the Markov chain models represents the transition probabilities between different states that can be measured according to the Ching’s method (Ching, 2004).
4. Model Parameters Estimation
The approaches to determine service length, customer classes, effective parameters, profit vector, Markov chain states, state transition probability matrix are discussed in the following subsections. The desired model must be verified. To do so we use data of a composite manufacturing company in Iran.
4.1. Estimation of service length
company decreases from customer, the churn happens (Zhang et al. 2015). Anyway the churn models can be divided into two main groups, always-a-share and lost-for-good (Esmaeiligookeh & Tarokh 2017).
Always-a-share can model customer migration (EsmaeiliGookeh & Tarokh 2013); it means when a buyer stops purchasing from a company, and experiments a competitor is considered as a churn customer, but when he/she decides to come back to vendor, is considered as a return customer (or past customer). In this case the past information of the customer is not forgotten and previous costly attempts in gathering the customer’s information are not neglected in this model (Berger & Nasr 1998).
Lost-for-good model, forgets churn customers. In this model the buyer purchases from one vendor for a period of time. If the customer churns the company and return to the vendor after a while, the company considers him as a new customer and does not notice the past information (Dwyer 1997).
Each of the churn models has pros and coins. In lost-for-good models, the volume of the paid cost is fewer; meanwhile the previous costs spent for customer and benefits gathered from them, is neglected. In always-a-share model it is vice versa. In our paper published in January 2017, a combination model, as a new churn model, was introduced. The new churn model has advantages of both lost-for-good and always-a-share models, based on two concepts of temporal churn and permanent churn customers (Esmaeiligookeh & Tarokh 2017). To distinguish these two groups, it is needed to define two parameters named Tt (time spent from the last purchase) and F (threshold- maximum acceptable measure to Tt to invest). Tt can be easily found by looking at the data, but F must be defined. F can be different in various case studies. In the case study of this paper, F is equal to 6 periods, based on experts’ suggestions, where each transaction period is one month. If Tt passes 6, it means the customer is considered as temporal churn customer, but while Tt fluctuates between 1 and 6, the customer is a temporal churn customer.
4.2. Defining customer classes
In this part we explain the process to determine customer classes, and we will exemplify it in the next section. At first we should identify customers and accumulate their data. The final dataset contains demographic and transactional parameters. Data mining techniques should be used to separate customers into clusters containing similar customers. K-means algorithm is used to cluster the customer. To find the optimized number of clusters Dann index is used. Although Dann index can help us find the right number of clusters, we repeat customers clustering by a hierarchy technique called EM, the same number of clusters can validate the accuracy of clustering. After clustering customers, the achieved clusters must be analyzed to find the reason of similarities in each one. If each cluster can separate customers based on their main behaviors, the clusters can be labeled. After that the data is ready to be classified, to extract the essential parameters in modeling customer behaviors. Algorithm J48 of Decision Tree technique is used. The results of the algorithm can model the profit vector.
4.3. Defining Markov Chain elements
probability among different states in one period. Due to the number of states (n), the transition matrix will contain n×n elements.
State 1 State 2 State n
P12
Pn1 P21
P2n P1n
Pn2
…
Figure 1. A Markov Chain with n states
P = [
𝑝11 𝑝12 … 𝑝1𝑛
𝑝21 𝑝22 … 𝑝2𝑛
… … … …
𝑝𝑛1 𝑝𝑛2 … 𝑝𝑛𝑛
]
5. Empirical Study
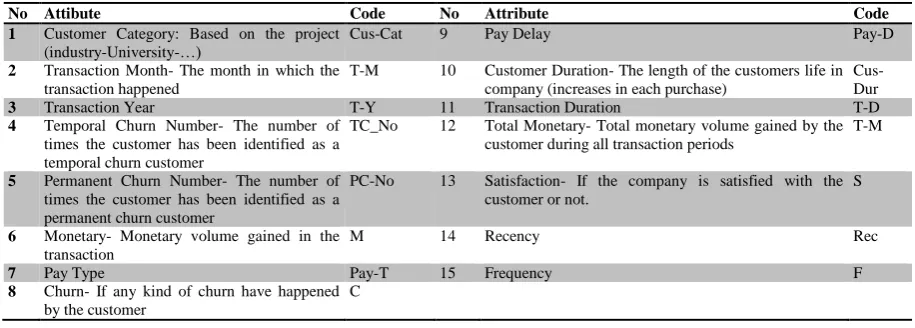
The case study is a composite manufacturing company in Iran active since 2001. About 50 customers randomly were chosen from the database. To verify the proposed model, 45 months were considered where the transactional periods are set to 1 month. Number of transaction data to analyze is 2300 records. Each record has 15 attributes, which are shown in table number 2.
Table 2. Customer attributes of the case study
No Attibute Code No Attribute Code 1 Customer Category: Based on the project
(industry-University-…)
Cus-Cat 9 Pay Delay Pay-D
2 Transaction Month- The month in which the transaction happened
T-M 10 Customer Duration- The length of the customers life in company (increases in each purchase)
Cus-Dur
3 Transaction Year T-Y 11 Transaction Duration T-D
4 Temporal Churn Number- The number of times the customer has been identified as a temporal churn customer
TC_No 12 Total Monetary- Total monetary volume gained by the customer during all transaction periods
T-M
5 Permanent Churn Number- The number of times the customer has been identified as a permanent churn customer
PC-No 13 Satisfaction- If the company is satisfied with the customer or not.
S
6 Monetary- Monetary volume gained in the transaction
M 14 Recency Rec
7 Pay Type Pay-T 15 Frequency F
8 Churn- If any kind of churn have happened by the customer
C
The number of clusters was adjusted from 2 to 11. The optimized number of clusters must be found by a clustering index such as Dann index. The more the Dann index, the better the clustering. Due to Dann criteria, number of clusters must be 6. To ensure the results, we repeated clustering by EM algorithm, which is a hierarchy clustering method. The results of the EM algorithm in Weka software package show that the number of clusters must be 6. In table 3 we review results of the clustering by k-means algorithm.
Table 3. The results of K-means Clustering
Cluster Number Number of dedicated Instances Percent of Instances
0 584 25 %
1 427 19 %
2 276 12 %
3 194 8 %
4 298 13 %
5 521 23 %
We analyzed the instances of each cluster, and found that the data in each cluster have behavioral similarities that can separate customers. Here the analysis is gathered:
Cluster number 0- The behavior of the customers of this group can be modeled as potential customers. This cluster contains customers whose parameters such as “Pay-T”, “M”, “T-M” “S”, “Cus-Dur”, and “Pay-D” is unidentified.
Cluster number 1- Monetary is unidentified in this cluster (coded as NULL in database). “S”, “Pay-T” and “Pay-D” is unidentified for the customers of this cluster; whereas “Rec” parameter average of this cluster in many more than others’, we can conclude these group is related to permanent churn customer.
Cluster number 2- Monetary equals to zero. “Pay-T” and “Pay-D” is unidentified and the Recency average is high, but less than the Recency average of cluster number 1. The customers of this cluster are not active certainly, but can be grouped in temporal churn customers.
Cluster number 3, 4 and 5- The data in these clusters is related to active customers; but there are differences in some attributes which may help us to label them. The satisfaction and monetary parameters in cluster number 5 are larger than other two clusters (3 & 4). Recency is more in cluster number 3. We can conclude that these three clusters are trying to group active customers into three clusters based on their worthiness for the company. Most valuable customers (named A1) are related to the data in cluster number 5. Second important active customers (named A2) are related to cluster number 4, and third level active customers (named A3) are related to cluster number 3.
Now we know the main group of our customers which are POTENTIAL (P), ACTIVE RANK 1 (A1), ACTIVE RANK 2 (A2), ACTIVE RANK 3 (A3), TEMPORAL CHURN CUSTOMERS (TC) AND PERMANENT CHURN CUSTOMRS (PC).
To calculate CLV, we used Markov chain model, as it was mentioned in section 4, the states of the Markov chain model must be customers with different behaviors, therefore the Markov chain model construction is as follows:
i=1, P- Potential Customers: Those who are not still customer, but have the potential to become customer are in this group. The company pays cost for this group of customers in order to attract them.
i=2, A1 - Active Customers by first priority- Customers with the first priority are the most valuable customers of the firm. It is important to retain these customers; therefore retention cost is applied to these customers.
i=3, A2 - Active Customers by second priority- Customer of this group are active customer with the second priority. The firm tries to retain them and convert them to first priority active customers; therefore retention cost is applied for this state too.
i=4, A3 - Active Customers by thirst priority- Active customers with the least priority are gathered in this state. The churn probability of these customers is more than other groups. For these customers, the retention cost is applied too, but the amount of the cost for these customers, is less than the costs applied for first and second priority active customers.
i=5, TC - Temporal Churn Customers- This state is related to the customers which had been active in past. Few transaction periods is spent from their last transaction with firm. The return probability of these customers is not too low; therefore some winback cost should be applied to these customers. The number of periods spent from last purchase is shown by “Tt” in this model. We also define a churn threshold that is modeled by “F”. For customers of this state, the Tt is less than F.
i=6, PC - Permanent Churn Customers- This state is related to those customers who left the company, and many periods have been passed from the churn time. For the customers of this state, Tt exceeds F.
Tt: Number of periods passed from the last purchase of a churn customer.
F: Churn threshold period number.
Cost Vector: The transition between different states of customers causes cost for the company. The cost is shown by cost vector (C). The elements of the cost vector are:
C1: Acquisition Cost
C2: Retention Cost - Cost to retain first-priority active customer
C3: Retention Cost - Cost to retain second-priority active customer
C4: Retention Cost - Cost to retain third-priority active customer C5: Temporal Churn customer’s applied return cost
C6: Permanent Churn customer’s applied return cost
P =
[
P11 P12 P13 P14 P15 P16
P21 P22 P23 P24 P25 P26
P31 P32 P33 P34 P35 P36
P41
P51
P61
P42
P52
P62
P43
P53
P63
P44 P45 P46
P54 P55 P56
P64 P65 P66]
Steady state: The Markov chain of our desired model is a regular Markov chain, and then the steady state of the Markov chain can be calculated by:
𝜋𝑘 = lim
𝑚→∞𝑃𝑖𝑘
(𝑚) ∀𝑖
𝜋𝑘 = lim𝑛→∞𝑃(𝑋𝑛 = 𝑘) = 𝑙𝑖𝑚𝑛→∞𝜋𝑘(𝑛)
𝜋𝑗 = ∑ 𝜋𝑖 ∗ 𝑃𝑖𝑗
6
𝑖=1
Following relations exist among parameters that can help to derive the model.
1) P15, P16, P21, P26, P31, P36, P41, P46, P51, P61, P62, P63, P64, P65 =0
2) P66 =1
3) P11 + P12 +P13 + P14 =1
4) P22 + P23 + P24 + P25 =1
5) P32 + P33 + P34 + P35 =1
6) P42 + P43 + P44 + P45 =1
7) P52 + P53 + P54 + P55 + P56 =1
8) P62 + P63 + P64 + P66 =1
8) 1 × P11 = 1
9) 1 × P12 + 2 × P22 + 3 × P32 + 4 × P42 + 5 × P52 + 6 × P62 = 2 10) 1 × P13 + 2 × P23 + 3 × P33 + 4 × P43 + 5 × P53 + 6 × P63 = 3 11) 1 × P14 + 2 × P24 + 3 × P34 + 4 × P44 + 5 × P54 + 6 × P64= 4 12) 2 × P25 + 3 × P35 + 4 × P45 + 5 × P55 = 5
13) 5 × P56 + 6 × P66 = 6
14) 1 + 2 + 3 + 4 + 5 + 6 = 1
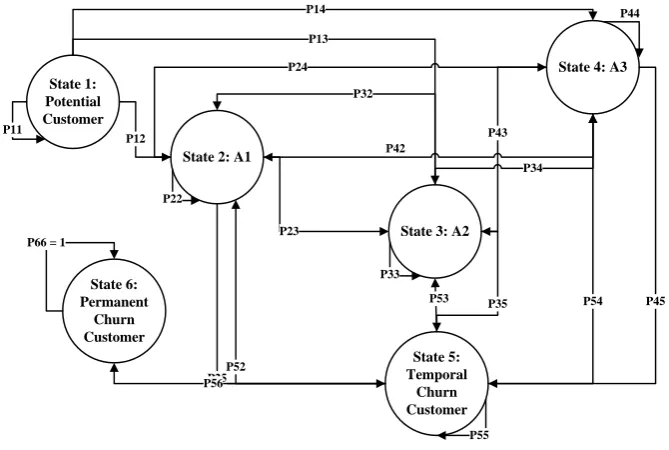
Based on the defined states, above equations lead to a Markov chain which is shown in
State 1: Potential Customer
State 2: A1
State 6: Permanent
Churn Customer
P11
P12
P32 P24
P66 = 1 State 3: A2
State 4: A3
State 5: Temporal
Churn Customer
P23
P43 P34 P42
P13 P14
P25
P35 P54 P45
P53
P52 P56
P55 P22
P33
P44
Figure 2. Markov Chain Model
By the Markov chain shown above, it is possible to calculate the CLV. The CLV model is:
CLV= ∑𝑡𝑡=0𝑃𝐶 𝜋(𝑡) × (1+𝑟)1 𝑡 (4)
R, is invest rate, which equals 0.1% in the case study, t is the transaction period which starts from when the customer is potential customer (t=0), until the time the customer churns the company permanently (t=tPC). 𝜋(𝑡) is the profit contributed by a customer at time t. To extract the profit function of a customer, we use decision tree and regression analysis. Algorithm J48 of the decision tree technique in Weka software package was used on the dataset, which is partitioned in six clusters labeled already.
Result of running algorithm on 2300 data with 15 attributes show that all parameters are not effective in customer classification. Results are:
Table 4. Result of the J48 algorithm
Total number of instances 2300
Correctly classified instances 1853 80.5652% Incorrectly classified instances 447 19.4348%
Kappa statistics 0.7647
Mean absolute error 0.0889
Coverage of cases 98.087%
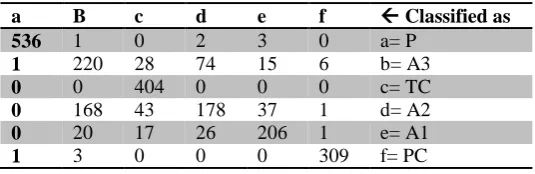
Table 5. The confusion matrix is shown below:
a B c d e f Classified as
536 1 0 2 3 0 a= P
1 220 28 74 15 6 b= A3
0 0 404 0 0 0 c= TC
0 168 43 178 37 1 d= A2 0 20 17 26 206 1 e= A1
1 3 0 0 0 309 f= PC
Important parameters due to the result of decision tree are Frequency, Recency, Monetary and Churn. The extracted rules are as bellow:
If (Rec = NULL) (Customer = Potential) If [(Rec = 0) & (5 ≤ M < 10)] (Customer = A3) If [(Rec = 0) & (10 ≤ M < 15)] (Customer = A2) If [(Rec = 0) & (15 ≤ M)] (Customer = A1) If [(Rec = 1) & (0 < M < 10)] (Customer = A3) If [(Rec = 1) & (10 ≤ M < 15)] (Customer = A2) If [(Rec = 1) & (15 ≤ M)] (Customer = A1) If [(Rec = 2) & (0 ≤ M < 5)] (Customer = A3) If [(Rec = 2) & (15 ≤ M)] (Customer = A1) If [(Rec = 2) & (10 ≤ M < 15)] (Customer = A2)
If [(Rec = 2) & (5 ≤ M < 10) & (F = 1)] (Customer = A3) If [(Rec = 2) & (5 ≤ M ≤ 10) & (5 ≤ F)] (Customer = A2)
If [(Rec = 2) & (5 ≤ M ≤ 10) & (2 ≤ F ≤ 4) & (Churn = 0)] (Customer = A2) If [(Rec = 2) & (5 ≤ M ≤ 10) & (2 ≤ F ≤ 4) & (Churn = 1)] (Customer = A3) If [(Rec = 3) & (0 ≤ M < 10)] (Customer = A3)
If [(Rec = 3) & (10 ≤ M < 15)] (Customer = A2) If [(Rec = 3) & (15 ≤ M)] (Customer = A1) If [(Rec = 4) & (0 ≤ M < 10)] (Customer = A3) If [(Rec = 4) & (10 ≤ M < 15)] (Customer = A2) If [(Rec = 4) & (15 ≤ M < 30)] (Customer = A1) If [(Rec = 5) & (0 ≤ M < 5)] (Customer = A3) If [(Rec = 5) & (10 ≤ M < 15)] (Customer = A2) If [(Rec = 5) & (15 ≤ M)] (Customer = A1)
If [(Rec = 5) & (5 ≤ M < 10) & (F ≤ 3)] (Customer = A3)
If [(Rec = 5) & (5 ≤ M < 10) & (F = 4) & (Churn = No)] (Customer = A2)
If [(Rec = 5) & (5 ≤ M < 10) & (5 ≤ F ≤ 7)] (Customer = A3) If [(Rec = 5) & (5 ≤ M < 10) & (8 ≤ F)] (Customer = A2) If (6 ≤ Rec ≤ 11) (Customer = TC)
If (12 ≤ Rec) (Customer = PC)
We need to assure that the extracted features are really effective; therefore we use regression analysis to check the parameters. The results certify that (F-Rec-M-C) are effective. The mathematical function to predict the class of a customer is:
Customer state = 3.48 + 0.14 × Frequency – 0.1 × Recency + 0.03 × Monetary – 0.43 × Churn (5)
Now we need to extract the value of (t). To do so we consider the data. The vector of customers benefit is a 6 elements vector, related to the six states of the Markov chain model in figure 2.
The profit vector is summation of cost vector and income vector which can be achieved from:
𝜋 (𝑡) = 𝐼(𝐼𝑛𝑐𝑜𝑚𝑒 𝑉𝑒𝑐𝑡𝑜𝑟) − 𝐶(𝐶𝑜𝑠𝑡 𝑉𝑒𝑐𝑡𝑜𝑟) (6)
𝐼 (𝑡) =
[ 0 20 14 10 0 0 ]
𝐶 (𝑡) =
[ 20 2.5 4 0.99 15.23
5.85 ]
𝜋 (𝑡) =
[ −20 17.5 10 9.01 −15.23
−5.85 ]
To measure the elements of transition matrix, we use method used in Ching study (Ching et al. 2004); therefore the transition matrix is:
𝑃 =
[
0.7 0.005 0.095 0.2 0 0
0 0.7 0.15 0.05 0.1 0
0 0.2 0.5 0.15 0.15 0
0 0.08 0.02 0.7 0.2 0
0 0.1 0.38 0.1 0.27 0.15
0 0.01 0.05 0.04 0 0.9 ]
Calculating CLV- Based on the CLV model mentioned in formula (4), and proposed Markov chain and profit vector, the CLV is measured as follows:
𝐶𝐿𝑉 =
[ −9.73
85.16 66.73 57.28 26.94 −0.10]
Results show that to measure CLV, it is possible to classify customer by similar behaviors, and predict future behavior by Markov chain. The above vector, which is CLV vector, is the result of the CLV computation for each 6 group of customers in the case study.
6. Conclusions & Further Research Direction
This study has presented a new model to predict CLV, and was verified by the dataset of a composite manufacturing company in Iran. The customer lifetime value which is mentioned in this study is the summation of current value and future value of the customer. To count the current value, a profit vector was formulated, using the affecting parameters in customer value, which were chosen from demographic, behavioral and financial data. We modeled the behavior of customers, and grouped them into different segments based their behavioral similarities. After that we used Markov chain model to predict the future behavior of a customer in each transactional period, as a result the future value of the customer could be predicted. In the desired Markov chain model, the lifetime of the customers is modeled by a new churn approach, developed by the writers, in January 2017.
According to the new churn model, the temporal churn customers are those who did not have done purchase for a while, but still it is reasonable to apply managerial strategies to control them. Versus permanent churn customers are those who do not deserve managerial marketing charges. The churn model profits from advantages of both lost-for-good, and always-a-share churn models. Lifetime of customers in our new CLV model starts from time that customer is considered as a potential customer, until he/she starts to be a permanent churn customer.
To validate the CLV prediction model, we used 2300 data of 45 months related to a composite manufacturing company in Iran. Results of behavior modeling, by data mining techniques, show that customers have 6 different behaviors. We analyzed the behavior of each cluster and labeled them based on their behavior. The label of customers are: Potential customers, Temporal churn customer, Permanent churn customers, Active rank 1 customers, Active rank 2 customers and Active rank 3 customers. Then we classified labeled customers to find out the effective parameters that can help to forecast the behavior of customers in future transaction periods. Results from decision tree and regression analysis both show that four attributes (Recency-Monetary-Frequency-Churn) affect behavior of customers. Furthermore we presented mathematical formula to calculate CLV. Defining a profit function ((t)) was important in calculation. The profit vector is the consequence of income and cost vector. Therefore based on the six states of the desired Markov chain models, the cost, income and profit vectors were extracted. In the Markov chain model we need a transition matrix; each element represents transition probability among states. The transition matrix is achieved from dataset. At the end customer lifetime value was calculated for any six groups of customers.
is estimated by a new churn model, according to which, customer’s lifetime ends when he/she starts to be a permanent churn customer. CLV model represented in this paper is able to count customer’s current value based on a profit vector, gathered from affecting parameters, also can predict future value, by predicting customer’s behavior in each transactional period using Markov chain model. The computed CLV can help managers to take strategies to help changing customer’s behavior and value.
In future, we aim to represent a CLV model by the approach of fuzzy Markov chain model, which would be able to classify the behavior of customers based on fuzzy approach. Another future research issue is to develop a personalized marketing strategy for each customer based on the measured CLV. Adopting the appropriate strategy based on the CLV can be done by fuzzy decision-making approach to best fit the customer, which can be considered as another future research direction.
References
Abrahamsson, S., (2015). “Determination of potential value drivers by identifing customer expectations and percieved value. Lappeenranta university of technology.
Aeron, H. et al., (2008). “A metric for customer lifetime value of credit card customers”, Database Marketing & Customer Strategy Management, Vol. 15, No. 3, pp.153–168.
Bagheri, F. and Tarokh, M.J., (2014). “Customer Behavior mining based on RFM model to improve the customer relationship management”, Journal of Industrial Engineering and Management Studies, Vol. 1, No. 1, pp.43–57.
Berger, P.D. and Nasr, N.I., (1998). "Customer lifetime value: Marketing models and applications", Journal of Interactive Marketing, Vol. 12, No. 1, pp.17–30.
Chan, S.L., Ip, W.H. and Cho, V., (2010). "Expert Systems with Applications A model for predicting customer value from perspectives of product attractiveness and marketing strategy", Expert Systems with Applications, Vol. 37, pp.1207–1215.
Chen, Z. and Fan, Z., (2013). "Knowledge-Based Systems Dynamic customer lifetime value prediction using longitudinal data : An improved multiple kernel SVR approach", Knowledge-Based Systems, Vol. 43, pp.123–134.
Cheng, C. et al., (2012). "Customer lifetime value prediction by a Markov chain based data mining model : Application to an auto repair and maintenance company in Taiwan", Scientia Iranica, Vol. 19, No. 3, pp.849–855.
Ching, W.-K., Michael, N. and Wong, K., (2004). "Customer Lifetime Value: Stochastic Optimisation Approah", Journal of Operational Research Society.
Clempner, J.B. and Poznyak, A.S., (2014). "SIMPLE COMPUTING OF THE CUSTOMER LIFETIME VALUE : A FIXED LOCAL-OPTIMAL POLICY APPROACH", Journal of Systems Science and Systems Engineering, Vol. 23, No. 4, pp.439–459.
Danaee, H. et al., (2013). "Classifying and Designing Customer ’ s Strategy Pyramid by Customer Life Time Value ( CLV ) ( Case study : Shargh Cement Company )", Journal of Basec Applied Science Research, Vol. 3, No. 7, pp.473–483.
Drea, J.T., Marlow, L. and Lauren, K., (2017). "Applying Customer Lifetime Value to Major League Baseball Season Tickets', Journal of Applied Sport Management2, Vol. 9, No. 2, pp.37–49.
Ekinci, Y., Ülengin, F., et al., (2014). "Analysis of customer lifetime value and marketing expenditure decisions through a Markovian-based model", European Journal of Operational Research, Vol. 237, No. 1, pp.278–288.
Ekinci, Y., Ulengin, F. and Uray, N., (2014). "Using customer lifetime value to plan optimal promotions", The Service Industries Journal, Vol. 34, No. 2, pp.103–122.
Ekinci, Y., Uray, N. and Ulengin, F., (2014). "A customer lifetime value model for the banking industry : a guide to marketing actions", European Journal of Marketing, Vol. 48, pp.761–784.
EsmaeiliGookeh, M. and Tarokh, M., (2013). "Customer Lifetime Value Models: A literature survey", International Journal of Industrial Engineering and Production Management, Vol. 24, No. 4, pp.317–336.
Esmaeiligookeh, M. and Tarokh, M.J., (2017). "A Novel Customer Churn Model by Markov Chain", In Electrical & Computer Engineering. pp. 1–11.
Estrella-ramón, A., Sánchez-pérez, M. and Swinnen, G., (2016). "Estimating Customer Potential Value using panel data of a Spanish bank", Journal of Business Economics and Management, Vol. 17, No. 4, pp.580–597.
Fader, P.S., Hardie, B.G.S. and Lee, K.L., (2005). "?Counting Your Customers? the Easy Way: An Alternative to the Pareto/NBD Model", Marketing Science, Vol. 24, No. 2, pp.275–284.
Farzanfar, E. and Delafrooz, N., 2016. "Determining the Customer Lifetime Value based on the Benefit Clustering in the Insurance Industry', Indian Journal of Science and Technology, Vol. 9, No. 1, pp.1–8.
Gupta, S. et al., (2006). "Modeling Customer Lifetime Value", Journal of Service Research, Vol. 9, No. 2, pp.139–155.
Haenlein, M., Kaplan, A.M. and Beeser, A.J., (2007). "A Model to Determine Customer Lifetime Value in a Retail Banking Context", European Management Journal, Vol. 25, No. 3, pp.221–234. Available at: http://linkinghub.elsevier.com/retrieve/pii/S0263237307000163 [Accessed August 19, 2013].
Hamdi, K. and Zamiri, A., (2016). "Identifying and Segmenting Customers of Pasargad Insurance Company Through RFM Model (RFM)". International Business Management, Vol. 10, No. 18, pp.4209–4214.
Ho, T., Park, Y. and Zhou, Y., (2005). "Incorporating Satisfaction into Customer Value Analysis : Optimal Investment in Lifetime Value".
Holm, M., Kumar, V. and Rohde, C., (2012). "Measuring customer profitability in complex environments : an interdisciplinary contingency framework", Journal of Academic Marketing Science, Vol. 40, pp.387–401.
Horák, P., (2017). "Customer Lifetime Value in B2B Markets : Theory and Practice in the Czech Republic", International Journal of Business and Management, Vol. 12, No. 2, pp.47–55.
Hu, H. et al., (2018). "Strategies for new product di ff usion : Whom and how to target ?", Journal of Business Research, Vol. 83, pp.111–119.
Hwang, H., (2015). "A Dynamic Model for Valuing Customers : A Case Study", Advanced Science and Technology Letters, Vol. 120, pp.56–61.
Hwang, H., (2016). "A Stochastic Approach for Valuing Customers : A Case Study", International Journal of Software Engineering and Its applications, Vol. 10, No. 3, pp.67–82.
Koopaei, M., (2009). "A New Method for Ranking Changes in Customer ’ s Behavioral Patterns in Department Stores", In ICEC ’09. pp. 317–322.
Kumar, V. and George, M., (2007). "Measuring and maximizing customer equity: a critical analysis", Journal of the Academy of Marketing Science, 35(2), pp.157–171.
Lin, H. et al., (2017). "Predicting customer lifetime value for hypermarket private label products", Journal of Business Economics and Management, Vol. 18, No. 4, pp.619–635.
Liu, D.-R. and Shih, Y.-Y., (2005). "Integrating AHP and data mining for product recommendation based on customer lifetime value", Information & Management, Vol. 42, No. 3, pp.387–400. Available at: http://linkinghub.elsevier.com/retrieve/pii/S0378720604000394 [Accessed August 19, 2013].
Miguéis, V.L. et al., (2012). "Modeling partial customer churn: On the value of first product-category purchase sequences", Expert Systems with Applications, Vol. 39, No. 12, pp.11250– 11256.
Nikkhahan, B. et al., (2011). "Customer lifetime value model in an online toy store", Journal of engineering international, Vol. 7, No 12, pp.19–31.
Pachidi, S., Spruit, M. and Weerd, I. Van De, (2014). "Computers in Human Behavior Understanding users ’ behavior with software operation data mining", Computers in Human Behavior, Vol. 30, pp.583–594.
Peker, S., Kocyigit, A. and Eren, P.E., (2017). "LRFMP model for customer segmentation in the grocery retail industry: a case study", Marketing Intelligence & Planning, Vol. 35, No. 4, pp.544– 559.
Pfeifer, P.E. and Carraway, R.L., (2000). "Modeling customer relationships as Markov chains", Journal of Interactive Marketing, Vol. 14, No. 2, pp.43–55. Available at: http://linkinghub.elsevier.com/retrieve/pii/S1094996800702052..
Ryals, L.J. and Knox, S., (2005). "Measuring Risk-adjusted Customer Lifetime Value and its Impact on Relationship Marketing Strategies and Shareholder Value", European Journal of Marketing, Vol. 39, No. 5, pp.456–472.
Safari, F., Safari, N. and Montazer, G.A., (2016). "Customer lifetime value determination based on RFM model", Marketing Intelligence & Planning, Vol. 34, No. 4, pp.446–461.
Safari, M. et al., (2014). "Analyzing the applications of customer lifetime value ( CLV ) based on benefit segmentation for the banking sector". Procedia - Social and Behavioral Sciences, Vol. 109, pp.590–594. Available at: http://dx.doi.org/10.1016/j.sbspro.2013.12.511.
Samizadeh, R., (2015). "A New Model for the Calculation of Customer Life-time Value in Iranian Telecommunication Companies", International Journal of Management, Accounting and Economics, Vol. 2, No. 5, pp.394–403.
Segarra-moliner, J.R. and Moliner-tena, M.Á., (2016). "Customer equity and CLV in Spanish telecommunication services", Journal of Business Research, Vol. 69, No. 10, pp.4694–4705. Available at: http://dx.doi.org/10.1016/j.jbusres.2016.04.017.
Sunder, S., (2015). Measuring the Lifetime Value of a Customer in the Consumer Packaged Goods ( CPG ) industry.
Wang, J. and Huang, R., (2016). "Can You Get a Ticket ? Adaptive Railway Booking Strategies by Customer Value", Journal of Public Transportation, Vol. 19, No. 4, pp.1–17.
Yeh, I.-C., Yang, K.-J. and Ting, T.-M., (2009). "Knowledge discovery on RFM model using Bernoulli sequence", Expert Systems with Applications, Vol. 36, No. 3, pp.5866–5871.
Zhang, H., Liang, X. and Wang, S., (2016). "Customer value anticipation , product innovativeness , and customer lifetime value : The moderating role of advertising strategy", Journal of Business Research, Vol. 69, No. 9, pp.3725–3730.