AbstrAct
Objective To determine common patterns of recorded primary care for osteoarthritis (OA), and patient and provider characteristics associated with the quality of recorded care.
Design An observational study nested within a cluster-randomised controlled trial.
setting Eight UK general practices who were part of the Management of Osteoarthritis in Consultations study. Participants Patients recorded as consulting within the eight general practices for clinical OA.
Primary outcomes Achievement of seven quality indicators of care (pain/function assessment, information provision, exercise/weight advice, analgesics,
physiotherapy), recorded through an electronic template or routinely recorded in the electronic healthcare records, was identified for patients aged ≥45 years consulting over a 6-month period with clinical OA. Latent class analysis was used to cluster patients based on care received. Clusters were compared on patient and clinician-level characteristics.
results 1724 patients (median by practice 183) consulted with clinical OA. Common patterns of recorded quality
care were: cluster 1 (38%, High) received most quality
indicators of care; cluster 2 (11%, Moderate) had pain and
function assessment, and received or were considered
for other indicators; cluster 3 (17%, Low) had pain and
function assessment, and received or were considered for paracetamol or topical non-steroidal anti-inflammatory
drugs; cluster 4 (35%, None) had no recorded quality
indicators. Patients with higher levels of recorded care consulted a clinician who saw more patients with OA, consulted multiple times and had less morbidity. Those
in the High cluster were more likely to have recorded
diagnosed OA and have knee/hip OA.
conclusions Patterns of recorded care for OA fell into four natural clusters. Appropriate delivery of core interventions and relatively safe pharmacological options for OA are still not consistently recorded as provided in primary care. Further research to understand clinical recording behaviours and determine potential barriers to quality care alongside effective training for clinicians is needed. trial registration number ISRCTN06984617; Results.
IntrODuctIOn
Osteoarthritis (OA) is a common reason for adults aged ≥45 years to consult primary care.
Annually, in the UK, 4% of such adults are recorded as consulting in general practice for diagnosed OA, with an additional 8% recorded with joint pain likely to be attrib-utable to OA.1 OA is a common reason for disability, and was ranked the 11th biggest cause of disability by the 2010 Global Burden of Disease study.2
The UK National Institute for Health and Care Excellence (NICE) OA management guidelines recommend core strategies of information provision, physical activity and exercise, and weight management, supplemented with use of relatively safe pharmacological management strategies (eg, topical non-steroidal anti-inflamma-tory drugs (NSAID)), as necessary.3 Inten-sification of management should depend on response to these initial approaches. However, there is evidence that patients diagnosed with OA do not receive care that
Patterns of routine primary care for
osteoarthritis in the UK: a
cross-sectional electronic health records study
Holly Jackson,1,2 Lauren A Barnett,1 Kelvin P Jordan,1,3 Krysia S Dziedzic,1 Elizabeth Cottrell,1 Andrew G Finney,1 Zoe Paskins,1,4 John J Edwards1
To cite: Jackson H, Barnett LA, Jordan KP, et al. Patterns of routine primary care for osteoarthritis in the UK: a cross-sectional electronic health records study. BMJ Open 2017;7:e019694. doi:10.1136/ bmjopen-2017-019694
►Prepublication history for this paper is available online. To view these files, please visit the journal online (http:// dx. doi. org/ 10. 1136/ bmjopen- 2017- 019694).
Received 19 September 2017 Revised 22 November 2017 Accepted 29 November 2017
1Arthritis Research UK Primary Care Centre, Keele University Research Institute for Primary Care and Health Sciences, Keele, UK
2School of Mathematical Sciences, University of Nottingham, Nottingham, UK 3Keele Clinical Trials Unit, Keele University, Staffordshire, UK 4Rheumatology Department, The Haywood Hospital, Stoke-on-Trent, UK
correspondence to
Dr John J Edwards; j. j. edwards@ keele. ac. uk
strengths and limitations of this study
► This paper describes a novel use of latent class
analysis to identify patterns of primary care for osteoarthritis (OA).
► The population studied was large and diverse,
increasing generalisability, and based on a broad definition of clinical OA to reduce selection bias.
► The analysis used some quality indicators of
care newly implemented in practices through an electronic template (pain/function assessment, information provision, exercise/weight advice, analgesics, physiotherapy), which may have increased the recorded quality of care compared with routine practice.
► Four clusters of recorded care were identified:
approximately one-third of patients had a high probability of delivery of most care processes while another third had a low probability of any such delivery. The remaining patients had a high probability of pain and function assessment but were distinguished by the probability of delivery or consideration of other aspects of care.
on September 22, 2020 by guest. Protected by copyright.
Table 1 Seven quality Indicators and categories used for latent class analysis
Quality indicator Categories Definition
1. Pain assessed Assessed
Not assessed Recorded level of pain*No entry recorded*
2. Function assessed Assessed
Not assessed Recorded level of function*No entry recorded*
3. OA information Given
Considered, but not given Not considered
Recorded written or verbal* Recorded not appropriate* No entry recorded*
4. Exercise advice Given
Considered, but not given Not considered
Recorded written or verbal* Recorded not appropriate* No entry recorded* 5. Weight loss advice† Given
Considered, but not given Not considered
Recorded written or verbal* Recorded not appropriate* No entry recorded* 6. Paracetamol or topical NSAID Prescribed
Considered, but not prescribed Not considered
Either drug prescribed‡
Neither drug prescribed but recorded tried, offered, patient declined, or not appropriate*
Neither drug prescribed, recorded unknown or no entry recorded for both drugs*
7. Physiotherapy Referred
Considered, but not referred Not considered
Recorded referral‡
No referral but recorded as offered, or not necessary or not appropriate*
No referral, recorded not this time or no entry recorded*
*From e-template.
†Patients without a recorded BMI of ≥25 within the last 3 years were allocated to ‘Considered, but not given’ category. ‡From routine records.
BMI, body mass index; NSAID, non-steroidal anti-inflammatory drug; OA, osteoarthritis.
is well aligned to evidence-based recommendations and which may be overly dependent on pharmacolog-ical methods.4
We have previously identified variation between clini-cians in recorded quality of individual indicators of OA care.5 However, patterns of OA care and factors linked with increased probability of adherence to OA quality standards are less well studied. Using electronic general practice records data, the objectives of this study were to determine patterns of recorded primary care for OA based on quality indicators, and to determine associations between higher quality recorded care and patient and clinician characteristics.
MethODs
This analysis used data from the Management of Osteo-arthritis in Consultations (MOSAICS) study (trial registration number ISRCTN06984617).6 MOSAICS was a mixed-methods study, which investigated the effect of a model consultation for clinical OA. It was set within eight general practices in Cheshire, Shropshire and Staffordshire, UK. Practice eligibility has been reported elsewhere.6 The current analysis, reported in line with Strengthening the Reporting of Observa-tional Studies in Epidemiology guidelines, used anony-mised information from the electronic health records (EHR) of these practices for the 6-month baseline
period before randomisation of practices to interven-tion or control arms.6 At the beginning of the base-line period, a computerised template (‘e-template’, described below) was installed within the EHR and all practices continued with otherwise usual care until the end of the baseline period.
The study population was all patients aged ≥45 years regis-tered with the eight general practices who consulted with clinical OA in the baseline 6-month period. UK general practice uses a system of Read codes (similar in principle to the International Classification of Diseases codes) to record symptoms, morbidities and care processes7; within MOSAICS, clinical OA was defined as either a recorded OA Read code or a peripheral joint pain Read code for the hand, hip, knee or foot, to reduce the potential for selection bias in clinician coding. Patients were allocated to an index clinician, being the clinician recording the first formally diagnosed (ie, OA Read-coded) OA consul-tation in the baseline period or, if none, the first periph-eral joint pain coded consultation in the same period.
Outcome measures were the seven indicators of quality of care for OA in general practice recorded in the EHR (table 1). These could be entered into the EHR as routinely recorded data or captured through the e-tem-plate. The identification and synthesis of appropriate quality indicators using a systematic review and NICE 2008 guidelines has previously been reported.5 8 9
on September 22, 2020 by guest. Protected by copyright.
Achievement of prescribing and referral indicators (recorded prescription of topical NSAIDs or paracetamol, and onward physiotherapy referral) were determined from data in the routinely recorded component of the EHR and were determined to have been achieved if they were recorded within 14 days of any clinical OA consulta-tion in the 6-month period.
The e-template facilitated recording of achievement of indicators that are known to be poorly captured in routinely recorded data5: (1) assessment of pain and func-tion; (2) provision or consideration of OA information, exercise advice and weight loss advice; (3) consideration of paracetamol or topical NSAID; and (4) consideration of physiotherapy referral. The entry of a code for clinical OA for a patient aged ≥45 years triggered the e-template. The design, effects, and interpretation of the e-template have previously been reported.5 The clinicians could complete the e-template at any point throughout the consultation and could choose to complete all, some or none of the e-template. The e-template has been endorsed by NICE to facilitate enhanced uptake of quality standards.10
Data from the EHR (derived from both routinely recorded data and the e-template) were amalgamated within the relevant quality indicator. For example, consideration of paracetamol and topical NSAIDs (entered using e-template) was combined with actual prescription of these agents (routinely recorded data). Outcomes (table 1) were dichotomous for pain and function assessments. For all other indicators, the possibilities were for the indicator to be achieved, consid-ered (without record of having been delivered) or not considered. There is evidence that weight recording is more common in people who are overweight compared with those who are not.11 To minimise the effect of missing data and to preserve the ability of the model to iden-tify people who needed weight loss advice but were not recorded as receiving it, any patient recorded as being of normal weight or who did not have a weight recorded was allocated to considered for weight loss advice.
We investigated how patterns of care based on the quality indicators were associated with other OA care processes, recorded in the routine EHR within 14 days of any clinical OA consultation: prescriptions for oral NSAIDs and opioids, and relevant X-rays (hand, hip, knee or foot).
Factors potentially associated with patterns of quality of care that were considered were: patient age, gender, body mass index, the site of clinical OA, whether patients had multiple or a single consultation for clinical OA within the 6-month time period, whether the patient was a new consulter (no clinical OA consultations within the previous 12 months) and total morbidity. Total morbidity was measured by a count of British National Formulary subchapters from which prescriptions had been issued in the previous 12 months.12 A proxy measure of OA work-load for the patients’ index clinician was determined by dichotomising the number of index clinical OA consulta-tions at the median value (14) across clinicians.
statistical analysis
Latent class analysis (LCA) was used to cluster patients into groups based on recorded achievement of the seven quality indicators. All patients within a cluster should have similar recorded care for their OA or joint pain, but care should differ between patients belonging to different clusters.13
Latent class models were fitted, beginning with a one-cluster model where all the patients were assumed to have been given the same pattern of treatment of OA, up to a seven-cluster model. To determine the optimum number of clusters, we considered the Bayes informa-tion criterion14 (BIC, where the lowest BIC indicated the best model) with the size of each cluster, and the inter-pretability of the model. Posterior probabilities (PP) for a patient (the probabilities of that patient belonging to each of the clusters within the model) were identified. The cluster that had the largest PP for a patient was the cluster that patient was assigned to. We used the mean PP for patients allocated to each cluster to measure cluster separation; a mean PP of more than 0.7 indicated that the patients were clearly assigned to that specific cluster.15
Using a two-level (patient within index clinician) multinomial multilevel logistic regression, associations between the patient and clinician-level covariates and cluster membership were estimated and reported as rela-tive risk ratios (RRR) with 95% CIs. We also used Χ2 tests to compare between clusters on levels of pain and func-tional limitation (none, mild, moderate, severe) as recorded in the e-template.
Statistical analysis was performed using R studio V.3.3.0, and MLwiN V.2.35 for Windows.
results
During the 6-month period, 1724 patients (median per practice n=183) consulted with a recorded clinical OA code and triggered the e-template. All were included in the analysis. 1014 (59%) of these were female, mean age was 66.1 years (SD: 11.9) and 582 (34%) patients were recorded with a diagnosis of OA rather than periph-eral joint pain. Among consulters, 50% were recorded as having clinical OA at the knee, 21% at the hip, and the remainder with ankle/foot, wrist/hand, multisite, or unspecified clinical OA.
As previously reported,5 pain (63%) and function (62%) assessments were the most commonly achieved indicators. Recorded provision of OA information (44%) and exercise advice (45%) were achieved in under half of patients, and weight loss advice in less than a third of patients (31%). Up to 609 (35%) patients were prescribed paracetamol or topical NSAIDs. A referral for physio-therapy was made in 7% of patients.
Table 2 shows the goodness-of-fit statistics for the LCA models with one to seven clusters. The four-cluster model gave the lowest BIC, and each of the clusters in the three, four and five-cluster models had a mean PP for patients belonging to that cluster above 0.83. In the three-cluster
on September 22, 2020 by guest. Protected by copyright.
Table 3 Conditional item response probabilities for the quality indicators for each cluster
Quality indicators
Overall Cluster
n (%) High (n=659, 38%) Moderate (n=184, 11%) Low (n=286, 17%) None (n=595, 35%)
Pain assessment Assessed 1092 (63) 0.978 0.961 0.922 0.014
Not assessed 632 (37) 0.022 0.039 0.078 0.987
Function assessment Assessed 1070 (62) 0.981 0.955 0.873 0.000
Not assessed 654 (38) 0.019 0.045 0.127 1.000
OA information Given 764 (44) 0.930 0.463 0.319 0.001
Considered, not given 85 (5) 0.009 0.330 0.011 0.000
Not considered 875 (51) 0.062 0.207 0.670 1.000
Exercise advice Given 768 (45) 0.994 0.417 0.237 0.000
Considered, not given 96 (6) 0.007 0.313 0.067 0.000
Not considered 860 (50) 0.000 0.270 0.696 1.000
Weight advice Given 536 (31) 0.593 0.115 0.089 0.000
Considered, not given 153 (9) 0.298 0.733 0.347 0.441
Not considered 1035 (60) 0.109 0.152 0.564 0.559
Topical NSAID/
paracetamol PrescribedConsidered, not prescribed 609 (35)570 (33) 0.4760.496 0.2730.641 0.3940.406 0.2390.004
Not considered 545 (32) 0.028 0.086 0.200 0.757
Referred 124 (7) 0.111 0.037 0.101 0.032
Physiotherapy Considered, not referred 532 (31) 0.559 0.732 0.080 0.000
Not considered 1068 (62) 0.330 0.230 0.819 0.968
Median count (IQR): assessed/prescribed/given/referred 5 (4. 6) 3 (2. 3) 3 (2. 3) 0 (0. 1)
Median count (IQR): considered 1 (1. 2) 3 (2. 4) 1 (0. 1) 0 (0. 1)
NSAID, non-steroidal anti-inflammatory drug; OA, osteoarthritis.
Table 2 Latent class analysis of goodness-of-fit statistics Number of
clusters BIC Χ2 goodness of fit Population (%) of smallest cluster Range of mean PP across clusters n (%) with PP<0.7
1 20 994.14 32 978.08 1724 (100) 1.000 0 (0)
2 15 160.57 3332.77 1071 (62) 0.992, 0.987 3 (<1)
3 14 715.82 1727.74 430 (25) 0.906, 0.991 138 (8)
4 14 627.48 1522.28 184 (11) 0.848, 0.994 157 (9)
5 14 661.55 809.88 142 (8) 0.830, 0.993 207 (12)
6 14 699.79 733.23 112 (6) 0.754, 0.996 257 (15)
7 14 771.09 818.78 22 (1) 0.701, 0.996 267 (15)
BIC, Bayes information criterion; PP, posterior probabilities.
model, the smallest cluster size was 430 (25%), in the four-cluster model it was 184 (11%), and the five-cluster model had the smallest cluster size of 142 (8%). Based on the cluster sizes, goodness-of-fit statistics and clinical interpretability, the four-cluster model was chosen as the optimal model.
Table 3 shows the probability of recorded receipt of each of the seven quality indicators for patients allocated to each cluster. Patients in cluster 1 (n=659, 38%) had a high probability of having pain and function assessment
recorded (probabilities over 0.97) and of being given OA information and exercise advice (probabilities over 0.93). Patients’ care within this cluster was recorded as having achieved a median of five indicators and consid-ered for, but not achieved, a median of one further indi-cator. Cluster 1 was therefore labelled as having a High level of recorded quality of care. Cluster 2 (n=184, 11%; Moderate) had a high probability of pain and function assessment (probabilities over 0.95) and of consideration for (but not receipt of) physiotherapy and topical NSAID
on September 22, 2020 by guest. Protected by copyright.
or paracetamol. They also had a high probability of being given or considered for OA information and exercise advice. Their recorded care achieved a median of three indicators and they were considered for care relating to a median of three further indicators. Cluster 3 (n=286, 17%; Low) had a high probability of pain and function assessment (probabilities over 0.87), and was likely to be prescribed or considered for paracetamol or topical NSAIDs but generally was not recorded as receiving or being considered for other indicators (received a median of three processes and considered for a median of one further). Cluster 4 (n=595, 35%; None) had low proba-bilities of a record of receiving or being considered for any indicator (received and considered median zero indicators).
Table 4 compares the number of people in each cluster who were expected, based on the model, to receive each care process (identified by the indicators) and the number actually recorded as receiving them. Differences between observed and expected values were small and generally related to distinguishing between care received compared with care considered. For example, in the pain assessment domain, there was no difference between the counts of observed and expected provision for the High and Moderate clusters, and a difference of only one patient in the Low and None clusters; for OA information provi-sion, this was observed more frequently than expected for the High cluster (observed n=620 compared with 613 expected) but less frequently for the Moderate (59 vs 85) and Low (85 vs 91) clusters.
Patient and clinician characteristics for each cluster are shown in table 5 with results from the multinomial model comparing clusters in table 6. Compared with the None cluster, patients in the High and Moderate clusters tended to consult with a clinician with a higher OA work-load, consult multiple times and have less total morbidity (table 6). The patients with High level of recorded care were more likely to have diagnosed OA (adjusted RRR 1.81, 95% CI 1.41 to 2.32) and less likely to have hand or foot clinical OA than patients in the None cluster, while patients in the Moderate cluster were less likely to have diagnosed OA (RRR 0.55, 95% CI 0.35 to 0.85) or be over-weight (RRR 0.57, 95% CI 0.39 to 0.85), but more likely to have clinical OA in multiple sites (RRR 1.89, 95% CI 0.99 to 3.59) than patients in the None cluster. Patients in the Low cluster were less likely than patients in the None cluster to have a single consultation (RRR 0.45, 95% CI 0.34 to 0.60), have clinical OA in the foot (RRR 0.25, 95% CI 0.13 to 0.51) or have multimorbidity.
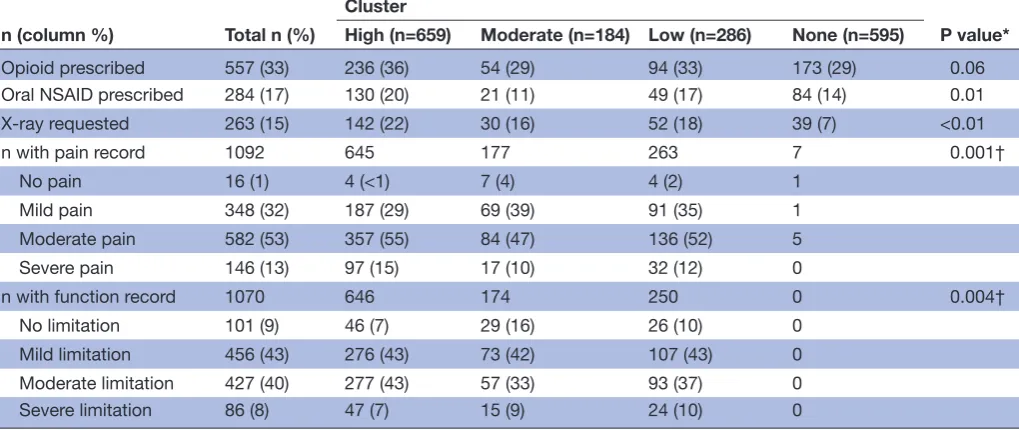
Those in the High cluster had slightly higher levels of opioid prescription (36%; Χ2 test, P=0.06), oral NSAID prescription (20%; P=0.01) and recorded X-rays (22%; P<0.01) than patients in the other clusters, although differences between the High and Low clusters, in partic-ular, were small (table 7).
In those with a record of a pain assessment, patients in the High cluster were more likely to have recorded moderate or severe pain (70% vs 57% in the Moderate
cluster and 64% in the Low cluster). The same pattern was seen for functional limitation although differences between clusters were smaller (table 7).
DIscussIOn
This study has identified four patterns of recorded primary care management of OA based on previously identified quality indicators of care. Just over a third of patients consulting for clinical OA had recorded care meeting the majority of quality indicators. Another third were not recorded as having received or been considered for any of these quality indicators. Factors associated with higher recorded quality of care included receiving an OA diagnosis, OA in the knee or hip rather than foot or hand, lower total morbidity burden, multiple consultations for clinical OA, and initial consultation with a clinician who was recorded as seeing more than the median number of patients with OA. Previous evidence has demonstrated that guidelines for treatment of OA within primary care are not consistently adhered to.16–18 The way in which receipt of different recommended care processes for OA are grouped within patients has not previously been inves-tigated. In our study, 38% of the patients were recorded as having received a relatively large number of quality indi-cators and could be regarded as a group achieving the closest to optimal care based on these indicators (the High group). Care for members of two clusters (Moderate and Low) achieved some quality indicators overall but can be distinguished by the fact that information, advice (exer-cise, weight loss) and physiotherapy were more likely to be considered in the Moderate cluster than the Low cluster. A third of patients were in the None cluster which demon-strated the weakest recorded quality of care with the majority of this group lacking recorded achievement or consideration of any indicator. The patients in the cluster with the best recorded care (High) were also more likely to receive other elements of care such as oral NSAIDs and referral for X-ray. NICE does not recommend routine use of X-ray for OA diagnosis and suggests that opioids and oral NSAIDS should be used only if topical NSAIDs and paracetamol do not relieve pain.3 The greater use of these approaches in the High cluster may reflect worse severity of OA and this cluster did have slightly higher levels of clinician-recorded pain and functional limitation than those in the Moderate and Low clusters. While one hypothesis may be that patients in the High cluster are given all possible care elements, this is unlikely to be the case as differences between clusters on the non-quality indicator elements of care were generally small, and most patients in the High cluster were not in receipt of these non-recommended approaches.
It is possible that the clinicians treating those in the High cluster were more engaged with, or more confi-dent in managing OA. Confidence in OA management could be associated with confidence in OA diagnosis, which may explain the increased use of OA Read codes in these patients. Conversely, where OA Read codes were
on September 22, 2020 by guest. Protected by copyright.
Table 4
Expected number compar
ed with observed for each category of indicators, by cluster
Quality indicators
Cluster High (n=659, 38%)
Moderate (n=184, 11%)
Low (n=286, 17%)
None (n=595, 35%)
E O ∆ E O ∆ E O ∆ E O ∆
Pain assessment
Assessed (n=1092, 63%)
645 645 0 177 177 0 264 263 1 8 7 1 N
ot assessed (n=632, 37%)
14 14 0 7 7 0 22 23 −1 587 588 −1
Function assessment
Assessed (n=1070, 62%)
646 646 0 176 174 2 250 250 0 0 0 0 N
ot assessed (n=655, 38%)
13 13 0 8 10 −2 36 36 0 595 595 0 OA information
Given (n=764, 44%)
613 620 −7 85 59 26 91 85 6 0 0 0 Consider ed, n
ot given (n=85, 5%)
6 3 3 61 81 −20 3 1 2 0 0 0 N ot consider
ed (n=875, 51%)
41 36 5 38 44 −6 192 200 −8 595 595 0 Exer cise advice
Given (n=768, 45%)
655 658 −3 77 53 24 68 57 11 0 0 0 Consider ed, n
ot given (n=96, 6%)
4 1 3 58 77 −19 19 18 1 0 0 0 N ot consider
ed (n=860, 50%)
0 0 0 50 54 −4 199 211 −12 595 595 0 W eight advice
Given (n=536, 31%)
391 370 21 21 20 1 26 22 4 0 0 0 Consider ed, n
ot given (n=153, 9%)
196 213 −17 135 140 −5 99 99 0 262 262 0 N ot consider
ed (n=1035, 60%)
72 76 −4 28 24 4 161 165 −4 333 333 0
Topical NSAID or paracetamol
Pr
escribed (n=609, 35%)
314 311 3 50 47 3 113 111 2 142 140 2 Consider ed, n ot pr
escribed (n=570, 33%)
327 330 −3 118 119 −1 116 118 −2 2 3 −1 N ot consider
ed (n=545, 32%)
18 18 0 16 18 −2 57 57 0 450 452 −2 Physiotherapy Referr
ed (n=124, 7%)
73 69 4 7 6 1 29 30 −1 19 19 0 Consider ed, n ot r eferr
ed (n=532, 31%)
369 371 −2 135 147 −12 23 14 9 0 0 0 N ot consider
ed (n=1068, 62%)
218 219 −1 42 31 11 234 242 −8 576 576 0
E, expected number; NSAID, non-ster
oidal anti-inflammatory drug; O, observed number; OA, osteoarthritis; ∆, dif
fer
ence.
on September 22, 2020 by guest. Protected by copyright.
Table 5 Patient and clinician characteristics for each cluster
Total n (%)
Cluster
High (n=659) Moderate (n=18) Low (n =286) None (n=595) Patient factors
Age
45–64 817 277 (34) 109 (13) 293 (43) 138 (17)
65–74 442 213 (48) 20 (5) 144 (33) 65 (15)
75–84 349 133 (38) 35 (10) 116 (33) 65 (19)
85+ 116 36 (31) 20 (17) 42 (36) 18 (6)
Gender
Male 710 286 (40) 68 (10) 113 (16) 243 (34)
Female 1014 373 (37) 116 (11) 173 (17) 352 (35)
BMI category
Normal 315 111 (35) 54 (17) 48 (15) 102 (32)
Overweight 1080 471 (44) 83 (8) 193 (18) 333 (31)
Not recorded 329 77 (23) 47 (14) 45 (14) 160 (49)
Diagnosis
Recorded with joint pain
only 1142 366 (32) 148 (13) 207 (18) 421 (37)
OA diagnosis 582 293 (50) 36 (6) 79 (14) 174 (30)
Site of OA
Knee 855 359 (42) 80 (9) 149 (17) 267 (31)
Hip 363 135 (37) 41 (11) 68 (19) 119 (33)
Foot 125 30 (24) 15 (12) 10 (8) 70 (56)
Hand 152 33 (22) 25 (16) 31 (20) 63 (41)
Unspecified 99 30 (30) 8 (8) 16 (16) 45 (46)
Multiple 130 72 (55) 15 (12) 12 (9) 31 (24)
Morbidity load* BNF count
0–4 485 156 (32) 68 (14) 89 (18) 172 (36)
5–9 578 240 (42) 56 (10) 99 (17) 183 (32)
10+ 661 263 (40) 60 (9) 98 (15) 240 (36)
Number of OA consultations†
Multiple 532 250 (47) 63 (12) 99 (19) 120 (23)
Single 1192 409 (34) 121 (10) 187 (16) 475 (40)
Median (IQR) number of
OA consultations† 1 (0, 1) 1 (1, 2) 1 (1, 2) 1 (1, 2) 1 (1, 1)
Consulter status
Repeat 566 232 (41) 53 (9) 84 (15) 197 (35)
New‡ 1158 427 (37) 131 (11) 202 (17) 398 (34)
Clinician factors Clinician OA workload†
Below the median 197 41 (21) 16 (8) 36 (18) 104 (53)
Above the median 1527 618 (41) 168 (11) 250 (16) 491 (32)
*Number of BNF subchapters from which prescription was made in previous 12 months. †During 6-month period.
‡No clinical OA consultations within the previous 12 months.
BMI, body mass index; BNF, British National Formulary; OA, osteoarthritis.
on September 22, 2020 by guest. Protected by copyright.
Table 6 Associations of patient and clinician characteristics with cluster membership
n=1724
High versus None Moderate versus None Low versus None
RRR* (95% CI) RRR* (95% CI) RRR* (95% CI)
Patient factors Age
45–64 1 1 1
65–74 1.41 (1.07 to 1.84) 0.45 (0.27 to 0.74) 0.97 (0.69 to 1.37)
75–84 1.13 (0.83 to 1.52) 1.02 (0.65 to 1.60) 1.42 (0.99 to 2.05)
85+ 0.91 (0.56 to 1.47) 1.56 (0.85 to 2.89) 1.24 (0.69 to 2.23)
Gender
Male 1 1 1
Female 0.86 (0.69 to 1.07) 1.03 (0.75 to 1.43) 1.04 (0.80 to 1.36)
BMI category
Normal 1 1 1
Overweight 1.20 (0.91 to 1.60) 0.57 (0.39 to 0.85) 1.33 (0.93 to 1.90)
Not recorded 0.39 (0.27 to 0.56) 0.52 (0.33 to 0.81) 0.52 (0.33 to 0.82)
Diagnosis
Recorded with joint pain only 1 1 1
OA diagnosis 1.81 (1.41 to 2.32) 0.55 (0.35 to 0.85) 0.93 (0.68 to 1.29)
Site of OA
Knee 1 1 1
Hip 0.86 (0.66 to 1.14) 1.14 (0.76 to 1.71) 1.04 (0.75 to 1.44)
Foot 0.38 (0.24 to 0.60) 0.73 (0.39 to 1.36) 0.25 (0.13 to 0.51)
Hand 0.45 (0.30 to 0.70) 1.18 (0.70 to 1.98) 0.88 (0.56 to 1.39)
Unspecified 0.48 (0.30 to 0.80) 0.85 (0.38 to 1.90) 0.74 (0.41 to 1.34)
Multiple 1.13 (0.75 to 1.74) 1.89 (0.99 to 3.59) 0.65 (0.34 to 1.24)
Morbidity load† BNF count
0–4 1 1 1
5–9 0.95 (0.71 to 1.26) 0.74 (0.50 to 1.11) 0.75 (0.54 to 1.06)
10+ 0.64 (0.47 to 0.87) 0.55 (0.35 to 0.86) 0.50 (0.35 to 0.73)
Number of OA consultations‡
Multiple 1 1 1
Single 0.43 (0.34 to 0.54) 0.47 (0.33 to 0.66) 0.45 (0.34 to 0.60)
Consulter status
Repeat 1 1 1
New§ 1.12 (0.89 to 1.41) 1.09 (0.76 to 1.55) 1.18 (0.88 to 1.59)
Clinician factors Clinician OA workload‡
Below the median 1 1 1
Above the median 2.90 (1.98 to 4.25) 2.32 (1.33 to 4.03) 1.46 (0.98 to 2.18)
*Relative risk ratio from multilevel multinomial regression (patients within initial clinician seen) adjusted for all presented covariates, None cluster is reference.
†Number of BNF subchapters from which prescription was made in previous 12 months. ‡During 6-month period.
§No clinical OA consultations within the previous 12 months.
BMI, body mass index; BNF, British National Formulary; OA, osteoarthritis; RRR, relative risk ratios.
on September 22, 2020 by guest. Protected by copyright.
Table 7 Use of management processes other than those used as quality indicators, and recorded severity of pain and functional limitation, by cluster
n (column %) Total n (%)
Cluster
P value* High (n=659) Moderate (n=184) Low (n=286) None (n=595)
Opioid prescribed 557 (33) 236 (36) 54 (29) 94 (33) 173 (29) 0.06
Oral NSAID prescribed 284 (17) 130 (20) 21 (11) 49 (17) 84 (14) 0.01
X-ray requested 263 (15) 142 (22) 30 (16) 52 (18) 39 (7) <0.01
n with pain record 1092 645 177 263 7 0.001†
No pain 16 (1) 4 (<1) 7 (4) 4 (2) 1
Mild pain 348 (32) 187 (29) 69 (39) 91 (35) 1
Moderate pain 582 (53) 357 (55) 84 (47) 136 (52) 5
Severe pain 146 (13) 97 (15) 17 (10) 32 (12) 0
n with function record 1070 646 174 250 0 0.004†
No limitation 101 (9) 46 (7) 29 (16) 26 (10) 0
Mild limitation 456 (43) 276 (43) 73 (42) 107 (43) 0
Moderate limitation 427 (40) 277 (43) 57 (33) 93 (37) 0
Severe limitation 86 (8) 47 (7) 15 (9) 24 (10) 0
*χ2 test.
†Excluding None cluster.
NSAID, non-steroidal anti-inflammatory drug.
not given there may have been uncertainty about both diagnosis and management. Previous qualitative obser-vational research of primary care consultations has iden-tified confusion about the construct of OA, with family doctors tending not to use the term ‘osteoarthritis’ with patients but instead, normalising symptoms.19 A formal diagnosis of OA, delivered explicitly, may be needed for holistic components of care such as patient education and self-management support to be offered.5 19 Patients with greater morbidity received a lower recorded quality of care and this may be because they were (perhaps erro-neously) considered less suitable for non-pharmacolog-ical and relatively safe pharmacolognon-pharmacolog-ical options. It is also possible that OA was given lower priority compared with their other problems.19 20 Patients with foot (and to some extent hand) OA may also have been particularly suscep-tible to lower levels of recorded quality of care and this site has been less well investigated with regard to effective interventions.21 22
This is the first study known to the authors which examines patterns of quality of care of chronic condi-tions such as OA. Other analyses of recorded quality of care for OA have reported some influences on individual process measures. Broadbent et al identified older age as being associated with reduced information provision but increased initial use of paracetamol and, where an oral NSAID was prescribed, greater first use of ibuprofen or a cyclooxygenase-2 selective NSAID; female sex was associ-ated with increased information provision; severe OA was associated with increased pain and function assessment in the previous year.23 Unlike in this analysis, Min et al identified an association between multimorbidity (using
a count of conditions) and better quality of care among vulnerable elders, some of whom had OA.24
This study has important strengths. The study popu-lation was large and the practices were diverse with respect to urbanisation, staffing, deprivation and size of registered population, implying good generalisability. Prescription recording is likely to be near complete since most prescribing is electronic and use of the e-template mitigates against missing data from patients using over-the-counter pharmacological approaches. The e-template also facilitates enhanced data collection in general prac-tice without incurring biases such as social desirability. LCA uses probabilistic modelling and finite mixture distributions to collect participants into clusters, which is a different method from traditional clustering techniques (eg, cluster analysis). Given this, LCA should produce a lower misclassification rate and better statistical criteria for investigating model fit.25 While there was variation in quality of care between clinicians and practices,5 clus-tering effects of patients within clinicians were adjusted for through the multilevel model. There are some limita-tions in this analysis. Due to the inherent nature of EHR studies, the data extracted are a function of both the individual clinician’s clinical and recording behaviours. It is therefore possible that some patients were misclas-sified as the lack of a record of a care process does not conclusively demonstrate that it did not occur. Compared with prescription recording, it is less certain how well-re-corded referrals are. However, despite the limitations of EHR data, the differences in levels of prescribed analgesia between the clusters suggest there were real differences in care between the four clusters identified. Conversely,
on September 22, 2020 by guest. Protected by copyright.
patients may have been coded as receiving some elements of care without this necessarily having been conducted in a comprehensive or meaningful way. Triangulation of medical record indicators with patient-reported indicators would be needed to evaluate this further. Our assumption that those without a weight recorded were considered for weight loss advice was based on the increased like-lihood of a weight recording if a patient appears over-weight11 but will have overestimated the proportion of patients considered for weight loss advice. However, over 80% of patients did have a weight record. The associa-tion between multiple consultaassocia-tions for OA and clusters with higher recorded quality of care may reflect greater opportunity to provide and record care but may also have reflected a greater disease severity and healthcare need. Although we considered comorbidities, previous research has identified that OA may be discussed in complex consultations about multiple problems19 and the length of time discussing OA in a consultation would likely be an important influence on the level of recorded care. It is also possible that those with recorded peripheral joint pain rather than recorded OA may not have OA, partic-ularly in the foot.26 The e-template itself was previously found to be associated with increased prescription of paracetamol and topical NSAIDs and so the patterns of care recorded may not be generalisable to practices not using the e-template.5
Promotion of core interventions (information, exer-cise and weight loss advice), alongside appropriate use of the relatively safe pharmacological options, remains an important strategy in the primary care management of OA, but many patients receive few or none of these. This is particularly true for patients with higher levels of morbidity, or hand or foot OA. While there is substantial variation in recorded care of OA, high-quality care appears feasible given we found that over a third of patients with OA were recorded as receiving most core recommen-dations. A lack of a systematic approach to people with OA has previously been reported.27 A structured annual review for people with OA28 as recommended by NICE10 may help. This may possibly be nurse led and inte-grated, where appropriate, into a multimorbidity long-term condition review. However, causes of variation in providing and recording of high-quality care still need to be identified and mechanisms need to be explored to ensure appropriate delivery of care to all patients.
Acknowledgements The authors thank the OA Research Users’ Group, NIHR West Midlands CRN Primary Care, and the network, health informatics, study coordinator, research nurse and administrative staff at Keele University’s Arthritis Research UK Primary Care Centre and Keele Clinical Trials Unit for all their support and assistance with this study. The authors give special thanks to all of the staff and patients at the participating general practices, and the GP facilitators who provided support to the general practices involved in the study.
contributors HJ and LAB performed the analysis and drafted and revised the paper. KPJ and JJE developed the analysis plan, cleaned the data, and drafted and revised the paper; KSD is the PI for the study, led the design of the MOSAICS study, and revised the paper; EC, ZP and AGF were involved in the interpretation of the findings and revised the paper. All authors have approved the final version.
Funding This paper presents independent research funded by the National Institute for Health Research (NIHR) Programme Grant (RP-PG-0407-10386). The views expressed in this paper are those of the authors and not necessarily those of the NHS, the NIHR or the Department of Health. This research was also funded by the Arthritis Research UK Primary Care Centre grant (Grant No. 18139). HJ and LAB were funded by an NIHR Research Methods Training Fellowship. KSD is partly funded by the NIHR Collaborations for Leadership in Applied Health Research and Care West Midlands and a Knowledge Mobilisation Research Fellowship (KMRF-2014-03-002) from the NIHR. EC and JJE are Academic Clinical Lecturers in Primary Care funded by the NIHR; JJE was previously supported by an In-Practice Fellowship from the NIHR.
competing interests KPJ reports grants from National Institute for Health Research, grants from Arthritis Research UK, during the conduct of the study. KSD reports grants from Arthritis Research UK Centre in Primary Care grant, grants from National Institute for Health Research (NIHR) Programme Grant (RP-PG-0407-10386), during the conduct of the study; grants from Knowledge Mobilisation Research Fellowship (KMRF-2014-03-002), non-financial support from National Institute of Health and Care Excellence, other from Bone and Joint Decade 2015 Conference Oslo, non-financial support from National Institute of Health and Care Excellence Quality Standards, grants from EIT-Health, other from Osteoarthritis Research Society International, outside the submitted work; and Member of the NICE Osteoarthritis Guidelines Development Group CG 59 (2008) and CG 177 (2014). The other authors declare no competing interests.
ethics approval North West Research Ethics Committee, Cheshire (reference: 10/ H1017/76)
Provenance and peer review Not commissioned; externally peer reviewed.
Data sharing statement The Centre has established data sharing arrangements to support joint publications and other research collaborations. Applications for access to anonymised data from our research databases are reviewed by the Centre's Data Custodian and Academic Proposal (DCAP) Committee and a decision regarding access to the data is made subject to the NRES ethical approval first provided for the study and to new analysis being proposed. Further information on our data sharing procedures can be found on the Centre’s website (http://www. keele. ac. uk/ pchs/ publications/ datasharingresources/) or by emailing the Centre’s data manager ( primarycare. datasharing@ keele. ac. uk).
Open Access This is an Open Access article distributed in accordance with the terms of the Creative Commons Attribution (CC BY 4.0) license, which permits others to distribute, remix, adapt and build upon this work, for commercial use, provided the original work is properly cited. See: http:// creativecommons. org/ licenses/ by/ 4. 0/
© Article author(s) (or their employer(s) unless otherwise stated in the text of the article) 2017. All rights reserved. No commercial use is permitted unless otherwise expressly granted.
reFerences
1. Jordan KP, Jöud A, Bergknut C, et al. International comparisons of the consultation prevalence of musculoskeletal conditions using population-based healthcare data from England and Sweden. Ann Rheum Dis 2014;73:212–8.
2. Vos T, Flaxman AD, Naghavi M, et al. Years lived with disability (YLDs) for 1160 sequelae of 289 diseases and injuries 1990-2010: a systematic analysis for the Global Burden of Disease Study 2010.
Lancet 2012;380:2163–96.
3. National Institute for Health & Care Excellence. NICE clinical guideline [CG177] Osteoarthritis: Care and management in adults. London: National Institute for Health & Care Excellence, 2014. 4. Hagen KB, Smedslund G, Østerås N, et al. Quality of
community-based osteoarthritis care: A systematic review and meta-analysis.
Arthritis Care Res 2016;68:1443–52.
5. Edwards JJ, Jordan KP, Peat G, et al. Quality of care for OA: the effect of a point-of-care consultation recording template.
Rheumatology 2015;54:844–53.
6. Dziedzic KS, Healey EL, Porcheret M, et al. Implementing the NICE osteoarthritis guidelines: a mixed methods study and cluster randomised trial of a model osteoarthritis consultation in primary care--the Management of OsteoArthritis In Consultations (MOSAICS) study protocol. Implement Sci 2014;9:95.
7. Health and Social Care Information Centre. Read codes. Secondary read codes. 2017 https:// digital. nhs. uk/ article/ 1104/ Read- Codes
on September 22, 2020 by guest. Protected by copyright.
8. Edwards JJ, Khanna M, Jordan KP, et al. Quality indicators for the primary care of osteoarthritis: a systematic review. Ann Rheum Dis
2015;74:490–8.
9. National Institute for Health & Clinical Excellence. NICE clinical guideline [CG59] Osteoarthritis: the care and management of osteoarthritis in adults. London: National Institute for Health & Clinical Excellence, 2008.
10. National Institute for Health & Care Excellence. Quality standard for osteoarthritis (NICE quality standard 87). Secondary Quality standard for osteoarthritis (NICE quality standard 87). 2015 https://www. nice. org. uk/ guidance/ qs87
11. Waring ME, Roberts MB, Parker DR, et al. Documentation and management of overweight and obesity in primary care. J Am Board Fam Med 2009;22:544–52.
12. Brilleman SL, Salisbury C. Comparing measures of multimorbidity to predict outcomes in primary care: a cross sectional study. Fam Pract
2013;30:172–8.
13. Magidson J, Vermunt JK. Latent class models. Thousand Oaks: Sage Publications, 2004.
14. Schwarz G. Estimating the dimension of a model. Ann Stat
1978;6:461–4.
15. Clark DB, Jones BL, Wood DS, et al. Substance use disorder trajectory classes: diachronic integration of onset age, severity, and course. Addict Behav 2006;31:995–1009.
16. Conrozier T, Marre JP, Payen-Champenois C, et al. National survey on the non-pharmacological modalities prescribed by French general practitioners in the treatment of lower limb (knee and hip) osteoarthritis. Adherence to the EULAR recommendations and factors influencing adherence. Clin Exp Rheumatol 2008;26:793–8. 17. DeHaan MN, Guzman J, Bayley MT, et al. Knee osteoarthritis clinical
practice guidelines–how are we doing? J Rheumatol 2007;34. 18. Denoeud L, Mazières B, Payen-Champenois C, et al. First line
treatment of knee osteoarthritis in outpatients in France: adherence to the EULAR 2000 recommendations and factors influencing adherence. Ann Rheum Dis 2005;64:70–4.
19. Paskins Z, Sanders T, Croft PR, et al. The identity crisis of osteoarthritis in general practice: A qualitative study using video-stimulated recall. Ann Fam Med 2015;13:537–44.
20. Coxon D, Frisher M, Jinks C, et al. The relative importance of perceived doctor's attitude on the decision to consult for symptomatic osteoarthritis: a choice-based conjoint analysis study.
BMJ Open 2015;5:e009625.
21. Iagnocco A, Rizzo C, Gattamelata A, et al. Osteoarthritis of the foot: a review of the current state of knowledge. Med Ultrason
2013;15:35–40.
22. Conaghan PG, Kloppenburg M, Schett G, et al. Osteoarthritis research priorities: a report from a EULAR ad hoc expert committee.
Ann Rheum Dis 2014;73:1442–5.
23. Broadbent J, Maisey S, Holland R, et al. Recorded quality of primary care for osteoarthritis: an observational study. Br J Gen Pract
2008;58:839–43.
24. Min LC, Wenger NS, Fung C, et al. Multimorbidity is associated with better quality of care among vulnerable elders. Med Care
2007;45:480–8.
25. Hougaard P. Frailty models for survival data. Lifetime Data Anal
1995;1:255–73.
26. Thomas MJ, Roddy E, Rathod T, et al. Clinical diagnosis of symptomatic midfoot osteoarthritis: cross-sectional findings from the Clinical Assessment Study of the Foot. Osteoarthritis Cartilage
2015;23:2094–101.
27. Rosemann T, Wensing M, Joest K, et al. Problems and needs for improving primary care of osteoarthritis patients: the views of patients, general practitioners and practice nurses. BMC Musculoskelet Disord 2006;7:48.
28. Healey EL, Main CJ, Ryan S, et al. A nurse-led clinic for patients consulting with osteoarthritis in general practice: development and impact of training in a cluster randomised controlled trial. BMC Fam Pract 2016;17:173.
on September 22, 2020 by guest. Protected by copyright.