ARTICLE
Natural occurrence of aflatoxins
and ochratoxin A in
meju
and soybean paste
produced in South Korea
Seong Eun Jeong, Soo Hyun Chung and Sung‑Yong Hong
*Abstract
In this study, we investigated the occurrence of aflatoxins (AFs) and ochratoxin A (OTA) in meju and soybean paste produced in South Korea. Samples were collected from three regions divided on the basis of climate in South Korea. A total of 100 meju samples were analyzed over 3 years (2012–2015), and 45 soybean paste samples were analyzed in 2016. Mycotoxins were extracted with an immunoaffinity column method and quantified by high‑performance liquid chromatography. AFs were detected in 10 of meju (10%) and 11 of soybean paste samples (24.4%) with concentra‑ tions of 0.2–48.3 μg/kg and 0.88–16.17 μg/kg, respectively. OTA was detected in 50 of meju (50%) and 22 of soybean paste samples (48.9%) with concentrations of 0.1–193.2 μg/kg and 0.88–26.29 μg/kg, respectively. Mycotoxin con‑ tamination in meju was more common in the central region than in the southern areas. Thus, more mycotoxins were produced in the central region owing to less fungal competition in meju during fermentation inside households. We also found that about 91% of AFs and 73% of OTA in meju were degraded after the production of soybean paste and soy sauce. Even after degradation of AFs and OTA, the levels of AFB1 and OTA were 0.5 µg/kg and 7.5 µg/kg in soy sauce and 11.9 µg/kg and 190.4 µg/kg in soybean paste, respectively. Thus, our results suggest the need for constant monitoring of meju and soybean paste for AFs and OTA.
Keywords: Aflatoxin, HPLC, Meju, Ochratoxin A, Soybean
© The Author(s) 2019. This article is distributed under the terms of the Creative Commons Attribution 4.0 International License (http://creat iveco mmons .org/licen ses/by/4.0/), which permits unrestricted use, distribution, and reproduction in any medium, provided you give appropriate credit to the original author(s) and the source, provide a link to the Creative Commons license, and indicate if changes were made.
Introduction
Soybeans and its products are among the major protein sources in East Asia. Meju is a fermented soybean food used as a raw material for the preparation of traditional fermented foods such as soy sauce and soybean paste in South Korea [1, 2]. These products have been manufac-tured for centuries at home by traditional means, wherein the natural microflora, especially storage fungi, partici-pates in the fermentation process. These molds produce the enzymes for conversion of proteins and carbohy-drates into amino acids, sugars, organic acids, alcohol, and esters, thereby conferring the characteristic flavor of
meju [3]. In South Korea, the manufacture of fermented foods such as meju using traditional methods, which are preferred over commercial products, is raising concerns,
owing to the possibility of contamination with mycotox-ins, especially aflatoxins (AFs) and ochratoxin A (OTA).
AFs are a group of toxic metabolites produced by
Aspergillus species such as A. flavus, A. parasiticus, A. pseudotamarii, and A. nomius [4, 5]. In general, A. flavus
and A. pseudotamarii produce AFB1 and AFB2, while A.
parasiticus and A. nomius produce AFG1 and AFG2. The
carcinogenicity, mutagenicity, and teratogenicity of AFB1
and its metabolites have been well documented. Thus, AFs are classified as Group 1 carcinogens (carcinogenic to humans) by the International Agency for Research on Cancer (IARC) [6]. OTA is a toxic secondary metabolite produced by several Aspergillus species and Penicillium verrucosum, which are found in contaminated agricul-tural crops [7]. OTA poses a serious threat to public health and causes severe economic losses worldwide because it can be found in animal feed such as corn and stored grains as well as in food products such as flour,
Open Access
*Correspondence: lunohong@korea.ac.kr
peas, peanuts, spices, and coffee beans [8]. IARC has cat-egorized OTA as a possible human carcinogen (Group 2B) [9]. Both groups of mycotoxins may contaminate various food commodities, including meju [1, 2, 10, 11]. Considering that meju is a main ingredient in soybean paste and soy sauce, which are used as seasoning agents and condiments in many Korean foods, the contamina-tion of meju with AFs and OTA may affect most Korean foods. The Korean government has set the maximum limits of total AF at 15 µg/kg, AFB1 at 10 µg/kg, and OTA
at 20 µg/kg in meju. Several analytical methods have been developed to quantify the two mycotoxins, such as enzyme-linked immunosorbent assay (ELISA) [12], thin-layer chromatography (TLC) [13], and high-performance liquid chromatography (HPLC) [14]. ELISA and TLC methods are less selective than other analytical meth-ods and are prone to interference by sample matrices [15, 16]. HPLC has been employed to determine AFs and OTA at low levels in food [10, 15]. The analysis of AFs and OTA in meju is complicated because of the distribu-tion of lipids and proteins in the soy-fermented materi-als that are co-extracted with AFs and OTA. Therefore, a specific purification method is desirable before HPLC analysis. Highly pure AFs and OTA can be obtained by passing meju through an immunoaffinity column (IAC), which uses specific antibody binding. Such an approach would provide an easy and straightforward solution to extract pure mycotoxins and consequently overcome the problems of interference from other compounds present in meju. In this regard, the present study aimed to inves-tigate the contamination of AFs and OTA in meju and soybean paste samples collected in South Korea. We also observed the transfer rates of mycotoxins to soy sauce and soybean paste produced from the collected meju
samples, which were severely contaminated with AFs and OTA.
Materials and methods
Sample collection
Meju was randomly collected from traditional mar-kets in South Korea between 2012 and 2015, while soy-bean paste was obtained in 2016 under the previously described conditions. The sampling areas were chosen by dividing the nation into three climatic zones based on the temperature and precipitation characteristics observed at 60 points by the Korea Meteorological Administra-tion for 25 years [17]. The first region included the Yeo-ngdong region in Gangwon and Gyeonggi provinces (average temperature, 11.7 °C/year; average precipita-tion, 1286.6 mm/year), while the second region included Chungcheong, Gyeongsangbuk, and Jeollabuk provinces (average temperature, 11.3 °C/year; average precipitation, 1263.4 mm/year). The third region included southern
Yeongho-Nam and the coastal areas of Jeollanam and Gyeongsangnam provinces (average temperature, 13 °C/ year; average precipitation, 1346.9 mm/year). About 16–18 samples were collected each year. All samples were stored in a freezer (− 20 °C) until analysis.
Standards and reagents
AF and OTA analytical standards were purchased from Sigma-Aldrich (St. Louis, MO, USA) and stored at
− 18 °C until use. Stock solutions of AF were stored in a mixture of benzene and acetonitrile (ACN) (98:2, v/v) and working standard solutions were prepared by dilut-ing the stock standard solution to 10 μg/mL in 10% ACN. OTA was stored in a mixture of toluene and acetic acid (99:1, v/v). Working standard solutions were prepared by diluting stock standard solutions to 10 μg/mL in a mix-ture of ACN, methanol (MeOH), and acetic acid (HAC) (99:99:2, v/v). All solvents used for the preparation of the mobile phase were of HPLC grade and obtained from J.T. Baker (Center Valley, PA, USA). Trifluoroacetic acid (TFA) was obtained from Sigma-Aldrich. All solvents were filtered through 0.45 µm membrane filters (What-man plc, Maidstone, UK). Pure water was obtained from a Milli-Q apparatus (Millipore, Billerica, MA, USA). IACs were supplied by VICAM (Milford, MA, USA).
Extraction procedure and IAC clean‑up
The levels of AFs in meju were detected according to the previously published procedures with some minor modi-fications [18–20]. Briefly, 20 g of each sample was mixed in a 250 mL Erlenmeyer flask containing 100 mL of ACN and water (60:40, v/v), and the mixture was mechanically shaken by a wrist action shaker (EYELA, Tokyo, Japan) for 1 h. The extract was filtered through Whatman filter paper No. 4, and 10 mL of the filtrate was diluted with 40 mL of phosphate buffered saline (PBS, pH 7.4). After 50 mL of mixture was passed through a glass microfiber filter (Whatman GF/A, UK), 10 mL of the filtrate was passed through an IAC (Aflatest®, VICAM, USA). The IAC was washed with 10 mL distilled water. AFs were then eluted with 2 mL MeOH at a flow of 1–1.5 mL/min. The methanol eluate was evaporated to dryness under a stream of nitrogen at 50 °C, and AFs were reconstituted in 500 μL of 10% ACN-TFA.
Aflatest® IAC at a flow rate of about 3 mL/min (1 drop/s). The IAC was washed with distilled water (10 mL) at the same flow rate until 2–3 mL of air passed through it to remove water. AFs were finally eluted from the col-umn with 3 mL ACN at the same flow rate and it was flushed with air. The eluate was evaporated under a gen-tle stream of N2 at 50 °C. The dry residues were
re-dis-solved and derivatized in 200 μL TFA, allowing them to stand for 15 min. The sample was then diluted with 800 μL of ACN:water (20:80, v/v), filtered through a 0.45 µm syringe filter (13 mm × 0.2 μm, GHP; Pall Corporation, Ann Arbor, MI, USA), and transferred into HPLC vials for auto injection.
We analyzed the levels of OTA in meju according to the previously published methods with some minor modifications [20, 22, 23]. Each sample (25 g) was put in a 250 mL Erlenmeyer flask containing 100 mL of ACN:water (60:40, v/v), and the mixture was mechani-cally shaken with a wrist action shaker (EYELA, JAPAN) for 1 h. The extract was filtered through Whatman No. 4 filter paper, and 5 mL of the filtrate was diluted in 55 mL PBS. After about 55 mL of mixture was passed through a glass microfiber filter (Whatman GF/A, UK), 10 mL of the filtrate was passed through an IAC (OchrTest IAC®, VICAM, USA). The IAC was washed with 10 mL distilled water and OTA was eluted with 2 mL methanol at a flow rate of 1–1.5 mL/min. The methanol eluate was evapo-rated to dryness under a stream of nitrogen at 50 °C, and the OTA was reconstituted in 500 μL of the mobile phase solution (ACN:MeOH:HAC, 99:99:2, v/v).
The OTA in soybean paste was analyzed according to the annual report of the Korean Food and Drug
Admin-istration (KFDA) [24]. Briefly, 25 g of each sample was extracted with 100 mL MeOH:water (70:30, v/v) using a mechanical shaker for 3 min. The extract was filtered with Whatman No. 1 filter paper, and 4 mL of the filtrate was diluted in 40 mL PBS and subjected to vigorous agi-tation. After the mixture (44 mL) was passed through an OchrTest IAC® at a flow rate of about 3 mL/min (2 drop/s), the column was washed with distilled water (10 mL) at the same flow rate until 2–3 mL of air passed through it to ensure the removal of water. The OTA was eluted with 2 mL MeOH at a flow of 1–1.5 mL/min. The MeOH eluate was evaporated to dryness under a stream of nitrogen at 50 °C, and the OTA was reconstituted in 500 μL of the mobile phase solution (ACN:MeOH:HAC, 99:99:2, v/v).
Assessment of the linearity, precision and sensitivity of the analytical method for determination of levels of AFs and OTA
The linearity of a series of AFs concentrations in the analytical method was assessed by a standard curve using eight levels of AFs (0.01 µg/kg, 0.05 µg/kg, 0.1 µg/ kg, 0.5 µg/kg, 1.0 µg/kg, 2.0 µg/kg, 5.0 µg/kg, and 10 µg/ kg) for meju and AFs (0.005 µg/kg, 0.01 µg/kg, 0.05 µg/ kg, 0.1 µg/kg, 0.5 µg/kg, 1.0 µg/kg, 5.0 µg/kg, and 10 µg/ kg) for soybean paste, which were dissolved in the mobile phase solution (ACN:MeOH:distilled water = 17:17:66, v/v/v). The linearity of a series of OTA concentrations in the analytical method for meju and soybean paste sam-ples was assessed by a standard curve using eight levels of OTA (0.005 µg/kg, 0.01 µg/kg, 0.05 µg/kg, 0.1 µg/kg, 0.5 µg/kg, 1.0 µg/kg, 5.0 µg/kg, and 10 µg/kg) dissolved in the mobile phase solution (ACN:water:HAC = 99:99:2,
v/v/v). Each standard solution for AFs or OTA was injected into HPLC-FLD in triplicate. The calibration curve was constructed by plotting the peak areas (y axis) versus AF or OTA concentrations (x axis) in the HPLC analysis. The linearity was determined by linear regres-sion analysis and expressed as coefficient of determina-tion (r2).
The precision of the analytical method was evaluated by the recovery experiments. The recovery experiments were performed with AF- and OTA-free meju and soy-bean paste samples, which were spiked with either AFs at 1.0 μg/kg and 10.0 μg/kg or OTA at 2.0 μg/kg and 10.0 μg/kg. The experiment was carried out in triplicate, including a double blank. Recovery was calculated by the following equation.
The sensitivity of the methods was determined by limit of detection (LOD) and limit of quantification (LOQ) for
meju and soybean paste samples. These were calculated as a signal-to-noise (S/N) ratio of 3:1 and 10:1, respec-tively, which were determined by using HPLC software (Analyst 1.6 software program).
HPLC analysis
A Dionex Ultimate 3000 UHPLC system (Thermo Sci-entific, Waltham, MA, USA) was used to detect AF and OTA. Separation was carried out using a Nova-Pack C18 column (4.6 mm × 250 mm, 5 μm; Waters, Milford, MA, USA). The injection volume for the AF or OTA stand-ards and samples was 50 μL. For AF analysis, the mobile phase (ACN:MeOH:distilled water = 17:17:66, v/v/v) was
Recovery = AF or OTA concentration measured from the spiked sample
pumped at a flow rate of 0.5 mL/min, giving a total run time of 20 min. A fluorescence detector was used for the determination of AFs at an excitation wavelength of 360 nm and emission wavelength of 440 nm. For OTA analysis, the mobile phase (ACN:water:HAC = 99:99:2,
v/v/v) was pumped at a flow rate of 0.8 mL/min, giving a total run time of 20 min. A fluorescence detector was used for the determination of OTA at an excitation wave-length of 330 nm and emission wavewave-length of 460 nm.
Statistical analysis
Statistical analyses were performed by Student’s t test using SigmaStat scientific statistical software (version 1.0, Jandel corporation, San Rafael, CA, USA).
Results and discussion
Assessment of the linearity, precision, and sensitivity of the analytical method to determine levels of AFs and OTA
The precision of the method was evaluated from the recovery rate of AFs and OTA obtained from the sam-ples spiked with known concentrations of AF and OTA standard solutions. The recovery rate was calculated using the equation described in the Materials and Meth-ods. The recovery rates of AFs and OTA in meju samples are shown in Table 1, while the typical HPLC chromato-grams of AFs and OTA are shown in Fig. 1. The recovery rates of AFs were in the range of 71.2–99.8% at 1 µg/kg and 10 µg/kg of levels spiked with AFs, and the recovery rates of OTA were in the range of 75.6–93.3% at 2 µg/ kg and 10 µg/kg of levels fortified with OTA. The recov-ery rates of AFs and OTA in soybean paste samples are shown in Table 2. The recovery rates of AFs were in the range of 82.8–97.6% at 1 µg/kg and 10 µg/kg of levels spiked with AFs, and the recovery rates of OTA were in
the range of 90.5–92.8% at 2 µg/kg and 10 µg/kg of levels fortified with OTA.
The recovery rates of AFs and OTA in all the samples satisfied the permissible limits of the recovery recom-mended by the Codex or Association of Official Ana-lytical Chemists (AOAC) [25]. The Codex recommends 60–120% of recovery rates in food samples contaminated with 1–10 µg/kg mycotoxins, and the guideline for the recoveries by AOAC is 70–125% in food samples contam-inated with 10 µg/kg mycotoxins. In addition, the relative standard deviation (RSD) values of AFs and OTA (2.13– 7.97%) were below 15%, which is in accordance with the recommendation for food samples contaminated with 10 µg/kg mycotoxins by AOAC. Thus, we concluded that the analytical method had good recoveries from meju.
The sensitivity of the method using HPLC was deter-mined by LOD and LOQ. The LOD was 0.05 μg/kg for AFB1 and AFB2, 0.2 μg/kg for AFG1 and AFG2, and
0.03 μg/kg for OTA in meju, whereas the LOD was 0.01 μg/kg for AFB1 and AFB2, 0.05 μg/kg for AFG1 and
AFG2, and 0.01 μg/kg for OTA in soybean paste samples
(Tables 3 and 4). The LOQ was 0.15 μg/kg for AFB1 and
AFB2, 0.6 μg/kg for AFG1 and AFG2, and 0.1 μg/kg for
OTA in meju, whereas the LOQ was 0.03 μg/kg for AFB1
and AFB2, 0.15 μg/kg for AFG1 and AFG2, and 0.03 μg/kg
for OTA in soybean paste samples. They were as low as those for the detection of trace amounts of AFs and OTA.
The linearity of a series of AF or OTA concentrations in the analytical method was assessed by each standard curve using 8 levels of standard solutions for each toxin. The linearity was determined by linear regression analy-sis. The curves for AFs or OTA were greater than 0.99 (Tables 3 and 4). Therefore, we concluded that the cali-bration curves were linear in the range of 0.01–10 μg/kg of AFs for meju, in the range of 0.005–10 μg/kg of AFs for soybean paste, and in the range of 0.005–10 μg/kg of OTA for meju and soybean paste.
Monitoring the levels of AFs and OTA in meju samples
The analytical method validated above was used for the determination of levels of AFs and OTA in 100 meju sam-ples collected from local markets in South Korea. Ten out of 100 samples (10%) were contaminated with total AFs at 0.2–41.3 μg/kg. In addition, 9 samples (9%) were contaminated with AFB1 at 0.6–21.4 μg/kg (Table 5). The
mean concentration was 1.45 μg/kg and 0.86 μg/kg for AFB1 and total AFs, respectively. The levels of AFB1 and
total AF in three meju samples analyzed (3%) exceeded the regulatory limits for AFB1 (10 μg/kg) and total AFs
(15 μg/kg) set by the KFDA. In general, soybeans are believed to be a poor substrate for AF production [26]. Therefore, it is highly likely that AF production occurs during the fermentation process for making meju. Several
Table 1 Recovery of AFB1, AFB2, AFG1, AFG2, and OTA
in meju
a Mean recovery indicate the average of triplicates at each level Mycotoxin Spiked concentration (μg/kg) Mean recovery (%)a Relative standard deviations (RSD) (%)
AFB1 1.0 99.8 6.49
10.0 97.5 3.36
AFB2 1.0 91.2 7.97
10.0 90.5 7.31
AFG1 1.0 92.2 6.98
10.0 79.7 4.76
AFG2 1.0 71.2 7.24
10.0 95.1 2.13
OTA 2.0 75.6 4.26
studies have reported on the levels of AFs in soybean and soybean products. One study showed AF contamination in 41.7% of meju samples, and the mean levels were lower (6.9 μg/kg) than the legal limits [18]. Despite the detec-tion of contaminadetec-tion, the authors concluded that the presence of AFs in meju sold in South Korea was not a serious threat to human health. In addition, in Pakistan, Lutfullah and collaborators found AFB1 contamination in
15% of soybean samples, with an average concentration of 6.4 μg/kg [16]. The levels of AFs in a traditional Korean
fermented soybean food was similar to those of AF in soybean products marketed in other countries.
Fifty samples of 100 meju samples (50%) were contami-nated with 0.1–193.2 μg/kg of OTA, which were analyzed with HPLC (Table 5). The average concentration of OTA was 10.24 μg/kg. The levels of OTA in nine meju sam-ples analyzed (9%) exceeded the legal limits for OTA set by the KFDA (20 μg/kg). In particular, six meju samples exceeded the permissible limits by 5–10 times. Informa-tion about levels of OTA in soybean fermented food such
Fig. 1 HPLC chromatograms of a standard solution containing 10 µg/L of AFs and a meju sample naturally contaminated with 9 μg/kg of AFs and b
as meju is scarce. Therefore, greater attention is required for assessing and monitoring OTA contamination in
meju.
We also investigated the co-occurrence of AFs and OTA in the same meju samples. The co-occurrence and co-contaminated levels were relatively lower than those in samples contaminated with only one of the toxins (Fig. 2). These results suggest that the same meju
products are not likely to be co-infected with different fungi, which produce either AFs or OTA; even if the same products are co-infected, those fungi are not likely to produce toxins due to fungal competition.
The occurrence of AFs and OTA in meju was investi-gated on the basis of climate.
Samples from the first region (Yeongdong region in Gangwon and Gyeonggi provinces; average tempera-ture, 11.7 °C/year; average precipitation, 1286.6 mm/ year) showed higher mycotoxin contamination levels than those from the southern region (Jeollanam and Gyeongsangnam provinces; average temperature, 13 °C/ year; average precipitation, 1346.9 mm/year) (p < 0.05) (Table 6). Also, samples from the second region (Chun-gcheongbuk, Chungcheongnam, Gyeongsangbuk, and Jeollabuk provinces; average temperature, 11.3 °C/year; average precipitation, 1263.4 mm/year) showed higher mycotoxin contamination levels than those from the third region (Jeollanam and Gyeongsangnam provinces) (p < 0.05) (Table 6). This result might be due to differences in the average winter temperatures in South Korea. Some parts of South Korea have very low temperatures in win-ter, which are unsuitable for the fermentation of meju. The average temperature in winter is below zero in the first and second regions (− 6.0 to 0.7 °C), while it is above zero in the southern region (2.5 to 3.9 °C) [17]. As a result, in the southern region, meju can be exposed to different
Table 2 Recovery of AFB1, AFB2, AFG1, AFG2, and OTA
in soybean paste
a Mean recovery indicate the average of triplicates at each level Mycotoxin Spiked
concentration (μg/kg)
Mean recovery (%)a
Relative standard deviations (RSD) (%)
AFB1 1.0 97.6 1.65
10.0 94.1 3.33
AFB2 1.0 91.3 2.95
10.0 87.3 4.68
AFG1 1.0 88.2 7.00
10.0 83.1 2.00
AFG2 1.0 82.8 4.67
10.0 83.0 4.73
OTA 2.0 92.8 4.51
10.0 90.5 8.24
Table 3 LOD and LOQ of AFs and OTA by HPLC analysis in meju
a Limit of detection
b Limit of quantification
c X = AFs or OTA concentration (μg/kg), Y = intensity
d Coefficient of determination
Mycotoxin LODa (μg/kg) LOQb (μg/kg) Linear equationc R2 d Range (μg/kg)
AFB1 0.05 0.15 Y = 2441.0X + 7.8015 0.9974 0.01–10
AFB2 0.05 0.15 Y = 2900.1X − 7.1994 0.9974 0.01–10
AFG1 0.2 0.6 Y = 1293.4X + 1.7867 0.9988 0.01–10
AFG2 0.2 0.6 Y = 1173.8X + 2.0294 0.9976 0.01–10
OTA 0.03 0.1 Y = 3935.1X + 324.6316 0.9996 0.005–10
Table 4 LOD and LOQ of AFs and OTA by HPLC analysis in soybean paste
a Limit of detection
b Limit of quantification
c X = AFs or OTA concentration (μg/kg), Y = intensity
d Coefficient of determination
Mycotoxin LOD (μg/kg)a LOQ (μg/kg)b Linear equationc R2 d Range (μg/kg)
AFB1 0.01 0.03 y = 2.5259x + 0.4332 0.9978 0.005–10
AFB2 0.01 0.03 y = 0.6885x + 0.1409 0.9981 0.005–10
AFG1 0.05 0.15 y = 1.4595x + 0.2503 0.9978 0.005–10
AFG2 0.05 0.15 y = 1.0506x − 0.0995 0.9926 0.005–10
fungi in the outside air, causing competition among many different fungi and resulting in the inhibition of myco-toxin production [3, 27]. In contrast, in the first and sec-ond regions, meju is dried inside households. Thus, only a few specific fungi such as mycotoxin-producing fungi can contaminate meju. In this case, less competition between different fungi could increase the probability of mycotoxin contamination in meju. A previous study showed no AFs in samples from northern Korea [28]. Our data demon-strate that mycotoxin contamination is a function of cli-matic conditions to a certain extent.
Monitoring the levels of AFs and OTA in soybean paste samples
In total, 45 soybean paste samples were analyzed for AFs using HPLC. Eleven out of 45 samples (24.4%) were
Table 5 Natural occurrence of AFs and OTA in meju
ND none detectable
Mycotoxin Positive samples/total
samples (percentage) Mean (μg/kg) Range (μg/kg) Number of positive samples in the range ND 0.1–1.0
(μg/kg) 1.1–10.0 (μg/kg) 10.1–100.0 (μg/kg) 100.1–200.0 (μg/ kg)
AFB1 9/100 (9.0%) 0.86 ± 63.51 0.6–21.4 91 1 5 3 0
AFB2 3/100 (3.0%) 0.38 ± 2.59 1.4–19.9 97 0 1 2 0
AFG1 5/100 (5.0%) 0.20 ± 1.86 0.1–18.6 95 4 0 1 0
AFG2 1/100 (1.0%) 0.01 ± 0.11 1.1 99 0 1 0 0
AFs 10/100 (10%) 1.45 ± 6.60 0.2–41.3 90 2 5 3 0
OTA 50/100 (50.0%) 10.31 ± 33.49 0.1–193.2 50 27 12 5 6
Fig. 2 Co‑occurrence of AFs in OTA positive meju samples
Table 6 Occurrence of AFs and OTA in meju from three areas Region Number of positive samples/total number of samples
Range Mean
AFB1
(μg/kg) AFB(μg/kg)2 AFG(μg/kg)1 AFG(μg/kg)2 Total AFs(μg/kg) OTA(μg/kg) Total AFs(mean, μg/kg)
Total OTA (mean, μg/ kg)
Area I Seoul 1/3 (0.6) 0/3 (< 0.0) 1/3 (0.1) 0/3 (< 0.0) 0/3 (< 0.0) 2/3 (57–115.5) 4/31 (0.8) 15/31 (24.6)
Gyeonggi 1/17 (4.9) 0/17 (< 0.0) 1/17 (0.2) 0/17 (< 0.0) 1/17 (5.1) 6/17 (0.3–152.4)
Gangwon 3/11 (5.5–9.7) 1/11 (1.4) 1/11 (0.2) 0/11 (< 0.0) 3/11 (5.7–9.8) 7/11 (0.1–193.2)
Area II Chungcheong‑
buk 0/7 (< 0.0) 0/7 (< 0.0) 0/7 (< 0.0) 0/7 (< 0.0) 0/7 (< 0.0) 3/7 (0.7–3.0) 4/35 (3.2) 18/35 (6.8) Chungcheong‑
nam 1/7 (19.6) 1/7 (16.9) 0/7 (< 0.0) 0/7 (< 0.0) 1/7 (36.5) 5/7 (0.1–67.0)
Gyungsangbuk 1/12 (21.4) 1/12 (19.9) 0/12 (< 0.0) 0/12 (< 0.0) 1/12 (41.3) 6/12 (0.6–36.0)
Jeollabuk 1/9 (15.6) 0/9 (< 0.0) 2/9 (0.2–18.6) 1/9 (1.1) 2/9 (0.2–35.3) 4/9 (0.2–102.0)
Area III Jeollanam 1/17 (4.5) 0/17 (< 0.0) 1/17 (0.6) 0/17 (< 0.0) 1/17 (5.2) 12/17 (0.1–3.7) 2/31 (0.2) 18/34 (0.7) Gyungsang‑
contaminated with total AFs at levels of 0.88–16.17 μg/ kg (Table 7). Furthermore, four samples (8.9%) were con-taminated with AFB1 at 1.06–15.25 μg/kg. The mean
con-centrations of AFB1 and total AFs were 0.59 μg/kg and
1.09 μg/kg, respectively (Table 7). The levels of AFB1 and
total AF in one sample analyzed exceeded the regulatory limits for AFB1 (10 μg/kg) and total AF (15 μg/kg) set by
the KFDA. In a previous study, 5 out of 11 samples ana-lyzed (45.5%) were within the permissible levels, ranging 0.04–2.46 μg/kg [21]. These data indicate that continu-ous management of AF risk is necessary during soybean paste manufacturing. In addition, 45 soybean paste sam-ples were analyzed for OTA levels using HPLC. Twenty-two samples (48.9%) were contaminated with OTA at 0.88–26.29 μg/kg (Table 7); the mean concentration was 4.43 μg/kg. These results are similar to the average con-tamination (7.1 µg/kg) of soybean paste described by park et al. [24]. The levels of OTA in five soybean paste samples analyzed (11.1%) exceeded the permissible limits
for OTA in meju set by the KFDA (20 μg/kg) when the limit for OTA in meju was used for comparison as the legal limits for OTA in soybean paste are not yet estab-lished in South Korea. Thus, the establishment of legal limits for OTA in soybean paste and risk management are required for the soybean paste industry.
In addition, the occurrence of AFs and OTA in soy-bean paste was investigated on the basis of local climate. Unlike the severe contamination of meju, the contamina-tion level was low in soybean paste (Table 8). There were no regional differences in the levels of AFs and OTA in the samples.
Reduction in the levels of AFs and OTA in meju samples contaminated with high amounts of the toxins during soy sauce and soybean paste production
Soy sauce and soybean paste are produced after the rip-ening of fermented meju (Fig. 3). To investigate the levels of AFs and OTA in soy sauce and soybean paste after the
Table 7 Natural occurrence of AFs and OTA in soybean paste
ND none detectable
Mycotoxin Positive samples/total
samples (percentage) Mean (μg/kg) Range (μg/kg) Number of positive samples in the range ND 0.1–1.0
(μg/kg) 1.1–10.0 (μg/kg) 10.1–20.0 (μg/kg) 20.1–50.0 (μg/kg)
AFB1 4/45 (8.9%) 0.59 ± 2.52 1.06–15.25 41 0 3 1 0
AFB2 5/45 (11.1%) 0.34 ± 1.29 0.92–7.80 40 1 4 0 0
AFG1 1/45 (2.2%) 0.12 ± 0.78 5.24 44 0 1 0 0
AFG2 2/45 (4.4%) 0.05 ± 0.25 0.88–1.44 43 0 2 0 0
AFs 11/45 (24.4%) 1.09 ± 2.93 0.88–16.17 34 1 9 1 0
OTA 22/45 (48.9%) 4.43 ± 7.25 0.88–26.29 23 1 14 3 4
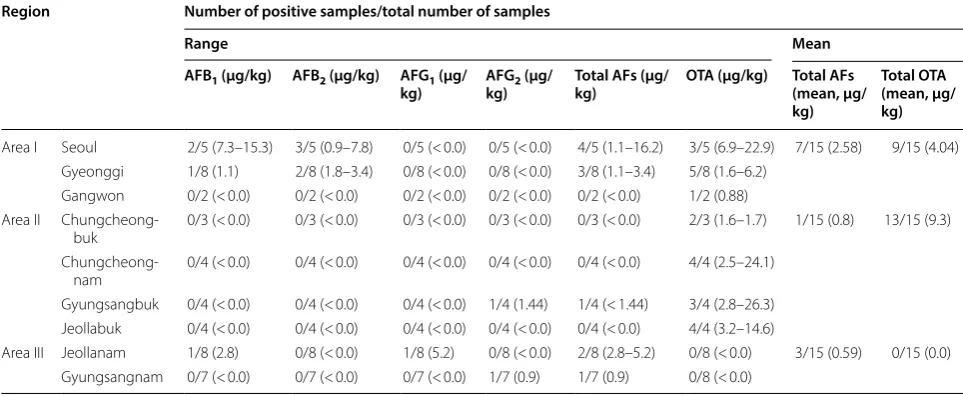
Table 8 Occurrence of AFs and OTA of soybean paste from three areas Region Number of positive samples/total number of samples
Range Mean
AFB1 (μg/kg) AFB2 (μg/kg) AFG1 (μg/
kg) AFGkg)2 (μg/ Total AFs (μg/kg) OTA (μg/kg) Total AFs (mean, μg/ kg)
Total OTA (mean, μg/ kg)
Area I Seoul 2/5 (7.3–15.3) 3/5 (0.9–7.8) 0/5 (< 0.0) 0/5 (< 0.0) 4/5 (1.1–16.2) 3/5 (6.9–22.9) 7/15 (2.58) 9/15 (4.04)
Gyeonggi 1/8 (1.1) 2/8 (1.8–3.4) 0/8 (< 0.0) 0/8 (< 0.0) 3/8 (1.1–3.4) 5/8 (1.6–6.2)
Gangwon 0/2 (< 0.0) 0/2 (< 0.0) 0/2 (< 0.0) 0/2 (< 0.0) 0/2 (< 0.0) 1/2 (0.88)
Area II Chungcheong‑
buk 0/3 (< 0.0) 0/3 (< 0.0) 0/3 (< 0.0) 0/3 (< 0.0) 0/3 (< 0.0) 2/3 (1.6–1.7) 1/15 (0.8) 13/15 (9.3) Chungcheong‑
nam 0/4 (< 0.0) 0/4 (< 0.0) 0/4 (< 0.0) 0/4 (< 0.0) 0/4 (< 0.0) 4/4 (2.5–24.1) Gyungsangbuk 0/4 (< 0.0) 0/4 (< 0.0) 0/4 (< 0.0) 1/4 (1.44) 1/4 (< 1.44) 3/4 (2.8–26.3) Jeollabuk 0/4 (< 0.0) 0/4 (< 0.0) 0/4 (< 0.0) 0/4 (< 0.0) 0/4 (< 0.0) 4/4 (3.2–14.6)
Area III Jeollanam 1/8 (2.8) 0/8 (< 0.0) 1/8 (5.2) 0/8 (< 0.0) 2/8 (2.8–5.2) 0/8 (< 0.0) 3/15 (0.59) 0/15 (0.0)
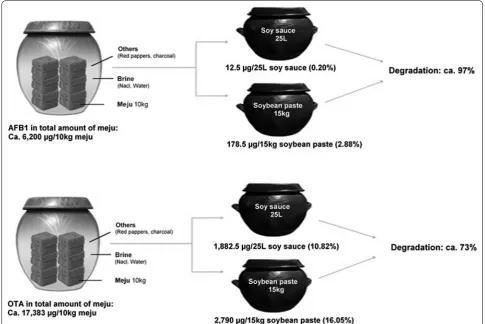
ripening of meju, we collected meju samples, which were contaminated with high amounts of AFs (620.0 µg/kg) and OTA (1738.3 µg/kg), soy sauce samples, and soybean paste samples in the same household in 2016, which were prepared from the meju. Both soy sauce and soybean paste were collected 8 months after meju sampling. In this study, we assumed that soy sauce and soybean paste from meju were produced as shown in Fig. 3. Briefly, 10 kg of meju and 30 L of brine (about 20% NaCl) were used for the production of soy sauce and soybean paste. After the ripening of meju in the brine, the mashed meju
was filtered, and the paste was separated from the liquid. Finally, 25 L of liquid (soy sauce) and 15 kg of soybean paste were obtained without any loss [29]. When soybean paste and soy sauce are made in the traditional way, fer-mented meju is matured for several months in brine. AFs and OTA production would not occur during the ripen-ing of fermented meju because the fungus cannot grow and produce AFs under > 14% salt concentration (22%). Therefore, mycotoxins levels are expected to decline or stay at a certain value [30]. Table 9 shows that the levels of AFB1 and OTA were 0.5 µg/kg and 7.5 µg/kg in soy
sauce and 11.9 µg/kg and 190.4 µg/kg in soybean paste,
respectively. It was presumed that 12.5 µg of AFB1 and
1882.5 µg of OTA were present in 25 L soy sauce and that 178.5 µg of AFB1 and 2790 µg OTA were present in 15 kg
soybean paste (Fig. 4). These results suggest that con-siderable amounts of AFB1 (97%) and OTA (73%) were
degraded during the production of soy sauce and soybean paste from meju. AFB1 and OTA were almost completely
degraded. There are various reasons why the mycotox-ins were degraded. Various microorganisms are known to inhibit mycotoxin production. Cho and co-workers reported the degradation of OTA using A. tubingensis
isolated from meju [31]. In their study, OTA degrada-tion was about 95% after 14 days. Kim and collaborators studied the effect of mixed culture conditions in a liquid medium and soybean mash and reported that A. niger
reduced AF formation, but other microorganisms did not interfere with AF production [10]. Petchkongkaew and colleagues reported the detoxification of AFs and OTA by using Bacillus licheniformis isolated from fresh Thua
-nao (a fermented soybean product) collected from north Thailand (74% decrease in AFB1 and 92.5% decrease in
OTA) [32]. However, in our study we cannot rule out the possibility that mycotoxins in the final products might be adsorbed onto charcoal during the soybean paste and soy sauce preparation even though charcoal addition to home-made soy sauce had negligible effects on AFB1
deg-radation (about 5% AFB1 degradation) in the soy sauce in
one study described by Park et al. [27].
Both AF and OTA contamination in meju can cause public health hazards even at low levels. Our data showed that OTA contamination in meju was more frequent than AF contamination. Therefore, although greater manage-ment of OTA is necessary than of AFs in meju, regular monitoring and control of both mycotoxins in meju and soybean paste are crucial for the fermented food industry in South Korea.
Fig. 3 General scheme for the production of soy sauce and soybean paste from meju
Table 9 Levels of AFs and OTA in meju, soy sauce, and soybean paste collected from the same household Mycotoxin Meju (μg/kg) Soy sauce (μg/kg) Soybean paste
(μg/kg)
AFB1 620.0 ± 6.49 0.49 ± 0.02 13.29 ± 0.70
AFB2 9.7 ± 1.99 0.48 ± 0.01 13.20 ± 0.60
AFG1 1.2 ± 0.32 0.49 ± 0.01 13.30 ± 0.61
AFG2 0 0.48 ± 0.02 13.25 ± 0.50
Abbreviations
AFs: aflatoxins; OTA: ochtatoxin A; AFB1: aflatoxin B1; AFB2: aflatoxin B2; AFG1: aflatoxin G1; AFG2: aflatoxin G2; A.: Aspergillus; IARC : International Agency for Research on Cancer; ELISA: enzyme‑linked immunosorbent assay; TLC: thin‑ layer chromatography; HPLC: high‑performance liquid chromatography; IAC: immunoaffinity column; ACN: acetonitrile; MeOH: methanol; HAC: acetic acid; TFA: trifluoroacetic acid; PBS: phosphate buffered saline; NaCl: sodium chlo‑ ride; LOD: limit of detection; LOQ: limit of quantification; S/N: signal‑to‑noise ratio; AOAC: Association of Official Analytical Chemists; KFDA: Korea Food and Drug Administration; RSD: relative standard deviation.
Acknowledgements
Not applicable.
Authors’ contributions
SEJ, SHC, and SYH conceived and designed the experiments. SEJ performed the experiments. SEJ, SHC, and SYH analyzed the data. SEJ and SYH wrote the manuscript. All authors read and approved the final manuscript.
Funding
This work was funded by Korea Research Foundation in South Korea. We authors thank for the support.
Availability of data and materials
Not applicable.
Competing interests
The authors declare that they have no competing interests.
Received: 18 July 2019 Accepted: 25 October 2019
References
1. Kim DH, Lee KH, Yook HS, Kim JH, Shin MG, Byun MW (2000) Quality characteristics of gamma irradiated‑grain shape improved meju. Korean J Food Sci Technol 32:640–645
2. Lee KH, Kim ND, Yoo JY (1997) Survey on the manufacturing process of traditional meju for and of kanjang (Korean soy sauce). J Korean Soc Food Sci Nutr 26:390–396
3. Kim JS, Kim JG, Kim WJ (2004) Changes in isoflavone and oligosac‑ charides of soybeans during germination. Korean J Food Sci Technol 36:294–298
4. Abdin M, Ahmad MM, Javed S (2010) Advances in molecular detection of
Aspergillus: an update. Arch Microbiol 192:409–425
5. Reddy K, Salleh B, Saad B, Abbas H, Abel C, Shier W (2010) An overview of mycotoxin contamination in foods and its implications for human health. J Toxicol Toxin Rev 29:3–26
6. IARC (2002) Some traditional herbal medicines, some mycotoxins, naph‑ thalene and styrene. IARC Monogr Eval Carcinog 82:1–556
7. Abrunhosa L, Venâncio A (2007) Isolation and purification of an enzyme hydrolyzing ochratoxin A from Aspergillus niger. Biotechnol Lett 29:1909–1914
8. Wang Y, Wang L, Liu F, Wang Q, Selvaraj J, Xing F et al (2016) Ochratoxin A producing fungi, biosynthetic pathway and regulatory mechanisms. Toxicol Toxin Rev 8:83
Fig. 4 Putative fate of AFB1 and OTA during the production of soy sauce and soybean paste from meju assuming that all meju samples contained
9. Lee KR, Yang SM, Cho SM, Kim M, Hong S‑Y, Chung SH (2017) Aflatoxin B1 detoxification by Aspergillus oryzae from meju, a traditional Korean fermented soybean starter. J Biol Biotechnol 27:57–66
10. Kim EJ, Chung Y, Kwon SP (1976) Effect of various fungi on the aflatoxin productivity in the culture of Aspergillus flavus. J Prev Med Public Health 9:77–86
11. Kim Y‑H, Hwangbo J‑S, Lee S‑R (1977) Detection of aflatoxins in some Korean foodstuffs. Korean J Food Sci Technol 9:73–80
12. Park K‑Y, Lee E‑S, Moon S‑H, Cheigh H‑S (1989) Effects of browning prod‑ ucts and charcoal on the degradation of aflatoxin B, in Korean soy sauce (kanjang) and its model system. Bull Environ Contam Toxicol 21:419–424 13. Scott P, Lawrence J, Van Walbeek W (1970) Detection of mycotoxins by
thin‑layer chromatography: application to screening of fungal extracts. Appl Microbiol 20:839–842
14. Leitner A, Zöllner P, Paolillo A, Stroka J, Papadopoulou‑Bouraoui A, Jaborek S et al (2002) Comparison of methods for the determination of ochratoxin A in wine. Anal Chim Acta 453:33–41
15. Dallsta C, Galaverna G, Dossena A, Marchelli R (2004) Reversed‑phase liquid chromatographic method for the determination of ochratoxin A in wine. J Chromatogr A 1024:275–279
16. Lutfullah G, Hussain A (2012) Studies on contamination level of aflatoxins in some cereals and beans of Pakistan. Food Control 23:32–36
17. Park C‑Y, Choi Y‑E, Moon J‑Y, Yun W‑T (2009) Classification of climate zones in South Korea considering both air temperature and rainfall. J Geo Soc Korea 44:1–16
18. Kim E, Shon D, Yoo J, Ryu D, Lee C, Kim Y (2001) Natural occurrence of aflatoxins in Korean meju. Food Addit Contam 18:151–156 19. Sripathomswat N, Thasnakorn P (1981) Survey of aflatoxin‑producing
fungi in certain fermented foods and beverages in Thailand. Mycopatho‑ logia 73:83–88
20. Wei R, Chang SC, Lee S (1980) High pressure liquid chromatographic determination of aflatoxins in soy sauce and fermented soybean paste. J Assoc Off Anal Chem 63:1269–1274
21. Park M‑J, Yoo M‑H, Hong H‑G, Joe T‑s, Lee I‑s, Park J‑H et al (2008) A survey of the presence of aflatoxins in food. J. Food Hyg Saf 23:108–112 22. Blesa J, Soriano J, Moltó J, Mañes J (2004) Absence ochratoxin A in soy
sauce. Int J Food Microbiol 97:221–225
23. Brera C, Grossi S, De Santis B, Miraglia M (2003) Automated HPLC method for the determination of ochratoxin A in wine samples. J Liq Chromatogr Related Technol 26:119–133
24. Park S‑K, Kwon K‑S, Kim M‑H, Jeong S‑Y, Jang G‑H, Nam T‑H et al (2004) Survey of ochratoxin A in cereal‑based Korean traditional foods by HPLC. Korean J Food Sci Technol 36:158–161
25. Horwitz W (1975) Official methods of analysis, pp edn. Association of Official Analytical Chemists, Washington, DC
26. Chang Y, Beng C, Ponnapalam J (1966) Mouldy soybeansas potential source of aflatoxin contamination. Far East Med J 2:298–300
27. Park K‑Y, Lee K‑B, Bullerman LB (1988) Aflatoxin production by Aspergillus parasiticus and its stability during the manufacture of Korean soy paste (doenjang) and soy sauce (kanjang) by traditional method. J Food Prot 51:938–944
28. Kim Y‑K, Roh J‑K (1985) Detection of aflatoxins in soybean food by HPLC. Korean J Food Sci Technol 17:295–303
29. Park K‑Y, Hwang K‑M, Jung K‑O, Lee K‑B (2002) Studies on the stand‑ ardization of doenjang (Korean soybean paste): 1. Standardization of manufacturing method of doenjang by literatures. J Korean Soc Food Sci Nutr 31:343–350
30. Nagarajan V, Bhat R, Tulpule P (1973) Aflatoxin production in some varie‑ ties of soybeans (Glycine max L.). Experientia 29:1302–1303
31. Cho SM, Jeong SE, Lee KR, Sudhani HP, Kim M, Hong S‑Y et al (2016) Bio‑ degradation of ochratoxin a by Aspergillus tubingensis isolated from meju. J Microbiol Biotechnol 26:1687–1695
32. Petchkongkaew A, Taillandier P, Gasaluck P, Lebrihi A (2008) Isolation of Bacillus spp. from Thai fermented soybean (Thua‑nao): screening for afla‑ toxin B1 and ochratoxin A detoxification. J Appl Microbiol 104:1495–1502
Publisher’s Note