How does under-reporting of negative
and inconclusive results affect the
false-positive rate in meta-analysis?
A simulation study
Michal Kicinski
To cite:Kicinski M. How does under-reporting of negative and inconclusive results affect the false-positive rate in meta-analysis? A simulation study. BMJ Open2014;4:e004831. doi:10.1136/bmjopen-2014-004831
▸ Prepublication history for this paper is available online. To view these files please visit the journal online (http://dx.doi.org/10.1136/ bmjopen-2014-004831).
Received 10 January 2014 Revised 21 July 2014 Accepted 12 August 2014
Department of Science, Hasselt University, Diepenbeek, Belgium
Correspondence to M Kicinski;
ABSTRACT
Objective:To investigate the impact of a higher
publishing probability for statistically significant positive outcomes on the false-positive rate in meta-analysis.
Design:Meta-analyses of different sizes (N=10, N=20,
N=50 and N=100), levels of heterogeneity and levels of publication bias were simulated.
Primary and secondary outcome measures:The
type I error rate for the test of the mean effect size (ie, the rate at which the meta-analyses showed that the mean effect differed from 0 when it in fact equalled 0) was estimated. Additionally, the power and type I error rate of publication bias detection methods based on the funnel plot were estimated.
Results:In the presence of a publication bias
characterised by a higher probability of including statistically significant positive results, the meta-analyses frequently concluded that the mean effect size differed from zero when it actually equalled zero. The magnitude of the effect of publication bias increased with an increasing number of studies and between-study variability. A higher probability of including statistically significant positive outcomes introduced little asymmetry to the funnel plot. A publication bias of a sufficient magnitude to frequently overturn the meta-analytic conclusions was difficult to detect by publication bias tests based on the funnel plot. When statistically significant positive results were four times more likely to be included than other outcomes and a large between-study variability was present, more than 90% of the meta-analyses of 50 and 100 studies wrongly showed that the mean effect size differed from zero. In the same scenario, publication bias tests based on the funnel plot detected the bias at rates not exceeding 15%.
Conclusions:This study adds to the evidence that
publication bias is a major threat to the validity of medical research and supports the usefulness of efforts to limit publication bias.
INTRODUCTION
The tendency to decide whether to publish a study based on its results is commonly
referred to as publication bias. Clearly, when some study outcomes are more likely to be reported than others, the available literature may be misleading. The phenomenon of research under-reporting has been long recognised as a potential source of bias.1–3
Meta-analysis, a tool that allows researchers to summarise the findings from multiple studies in a single estimate, plays an import-ant role in the era of evidence-based decision-making. A key assumption of the standard meta-analysis model is that the sample of retrieved studies is representative of all conducted studies.4–6 One conse-quence of publication bias is that it affects the sample of studies that is available for a meta-analysis, thereby violating that assump-tion.7 Indeed, more and more evidence sug-gests that publication bias is present in many meta-analyses.8–11
Deciding whether to publish a study based on the statistical sinificance and the direction of the effect is the best-documented form of publication bias in the medical literature.12 13 Investigators, who followed research projects from the moment of the submission of the study protocols to ethics committees and
Strengths and limitations of this study
▪ This is the first study that evaluated both the impact of publication bias on the conclusions from meta-analysis and the ability of publication bias methods to detect publication bias in the same meta-analysis samples.
▪ The model for publication bias was realistic since it was based on empirical research on pub-lication bias in the medical literature.
▪ Selection models were not considered in this study because their relatively large computational burden made it impossible to incorporate them in the simulations, which involved analysing hundreds of thousands of samples.
on September 22, 2020 by guest. Protected by copyright.
medical agencies to the publication of the results, demonstrated that statistically significant and positive results often have a multiple times higher probability to be published than other results.13–15Consistent with this evidence, a recent study observed that statistically signifi -cant findings favouring treatment often had a multiple times higher probability to enter meta-analyses of clin-ical trials than otherfindings.16
The effect of publication bias on the validity of meta-analytic conclusions remains largely unexplored. Hedges17 showed that censoring all non-significant results induces a strong bias when conslusions are drawn from multiple studies. Simulation studies have demon-strated that the standard meta-analysis model produces biased estimates of the mean effect size when publica-tion bias is present.18–20 The conclusions from meta-analyses are sometimes inconsistent with the results of large studies and publication bias is a likely cause of this inconsistency.21–24
The validity of any statistical procedure requires a low rate of false-positivefindings. In the case of meta-analysis, a low type I error rate (ie, a rate at which a meta-analysis leads to the conclusion that the mean effect differs from 0 when it in fact equals 0) is particularly important because a meta-analytic conclusion is assumed to sum-marise the existing evidence. In the context of a meta-analysis of clinical trials, a false-positive result may lead to the conclusion of a beneficial effect from a treat-ment that is in fact less efficient than the available alter-natives.25 In general, a false-positive finding from a meta-analysis misinforms doctors, scientists and policy-makers, potentially causing wastefullnes or even harm.
The aim of this study was to investigate the impact of a higher publishing probability for statistically significant positive outcomes on the type I error rate in meta-analysis. A simulation approach was used because the effect of publication bias on the conclusions from meta-analysis can only be evaluated when the exact nature of the selection process is known.
METHODS
Data from individual studies
Meta-analyses of clinical trials with two arms and a binary outcome were simulated. However, the results of the simu-lations are applicable to other study designs as well because the distribution of the log-OR is approximately normal, similarly to the distribution of other commonly used effect size measures. Similar to another simulation study,26 the sample size was modelled using the exponen-tial of a normal distribution. This approach gives a right-skewed distribution, which is a realistic model. Based on the characteristics of the meta-analyses from the Cochrane Database of Systematic Reviews,27 a mean of 4.51 and a variance of 1.47 was chosen. With these values, the median sample size equalled 91 and the IQR was 166. Following other simulation studies,19 20 26 28 29equal sizes were used for the treatment group and control group.
As in other simulation studies,19 20 26 the probability of the event in the control group ( pC) was sampled from a uniform distribution U (0.3, 0.7). The probability of the event in the treatment group ( pT) was calculated from the equation logit ( pT)=logit ( pC)+δ+θ, where δ was the effect of study-specific characteristics on the log-OR, andθwas the mean effect size. The mean effect size equalled 0 because the effect of publication bias on the type I error rate for the test of the mean effect size was investigated. I sampledδ from a normal distribution N (0, τ2). For the between-study variability, τ2, the values 0.02, 0.12 and 0.9 were considered. These values are the 10th, 50th and 90th centiles of the predictive distribu-tion of the between-study variability in the meta-analyses of clinical trials from the Cochrane database.30 The size of the between-study variability is often expressed in terms of I2, defined as the proportion of the total vari-ability due to heterogeneity.31 The considered values of
τ2 correspond to I2=17%, I2=56% and I2=90%. The
number of events in the treatment and control group was sampled from a binomial distribution.
Selection process
The relative risk (RR) was defined as the ratio of the probability of including statistically significant positive results to the probability of including other results. However, the conclusions of the study are equally applic-able to the case of a higher publishing probability for statistically significant negative outcomes. A conventional two-sided significance level of 0.05 was assumed. Three values of RR were considered: 1, 4 and 10. For RR=1, no publication bias was present. A value of four was chosen because multiple studies on publication bias estimated the ratio of the probability of publishing studies showing statistically significant positive results to the probability of publishing other results as close to four.13–15 A value of 10 represents a strong publication bias and is still rele-vant in the light of the empirical research on publica-tion bias in the medical literature.13 16 32
Publication bias detection
A meta-analysis is often accompanied by an investigation of the presence of publication bias. Therefore, publica-tion bias tests were incorporated in the simulapublica-tions. The funnel plot is a scatter plot of effect estimates against some measure of precision. In the absence of a bias, the effect estimates from smaller studies scatter widely at the bottom of the funnel plot, with the spread narrowing among larger studies, so that the plot resembles a sym-metrical inverted funnel.33 If there is a bias, funnel plots are often asymmetrical.33 34 Since a funnel plot asym-metry is commonly used to investigate the presence of publication bias,35 the funnel plots were inspected visu-ally and using the following formal tests:
▸ the Egger’s test,‘Egger’;34
▸ the rank correlation test,‘Rank’;36
▸ a modified Egger’s test based on the efficient score, ‘Harbord’;28
on September 22, 2020 by guest. Protected by copyright.
▸ a regression test based on sample size,‘Peters’;26 ▸ a rank correlation test for binary data,‘Schwarzer’;37 ▸ the Egger’s test based on the arcsine transformation,
‘Arc-Egger’;38
▸ a rank correlation test based on the arcsine trans-formation,‘Arc-rank’;38
▸ the trim andfill method,‘Trim’.39
For all tests, a significance level of 0.05 was used. For ‘Egger’, ‘Rank’, ‘Harbord’, ‘Peters’, ‘Schwarzer’, ‘Arc-Egger’ and‘Arc-rank’two-sided tests were used. For the trim and fill method, the presence of publication bias was indicated when the number of missing studies estimated by the R estimator in thefirst step of the algo-rithm was greater than 3.39
Meta-analysis
The mean log-OR was estimated using the random effects model proposed by DerSimonian and Laird, which is a widely used approach to conduct a meta-analysis.40 Four sizes of meta-analyses were consid-ered: N=10, N=20, N=50 and N=100. Meta-analyses including less than 10 studies were not considered because publication bias tests were not recommended for use in this case due to a low power.33
Simulations
Four sample sizes (N=10, N=20, N=50 and N=100), three sizes of the between-study variability (τ2=0.02, τ2=0.12
and τ2=0.9), and three levels of publication bias were considered (RR=1, RR=4 and RR=10), resulting in 36 simulation scenarios. For each scenario, the estimates of the mean effect size were evaluated in terms of the bias and the mean squared error. The effect of publication bias on the type I error rate for the test of the mean effect size was estimated for a grid of values within the considered ranges of the level of publication bias and the size of between-study variability. A two-sided signifi -cance level of 0.05 was assumed.
For each scenario, the power and the type I error rate for the publication bias tests were also investigated. Additionally, I estimated the type I error rate for the test of the mean effect size using only those samples where no publication bias was found. The purpose of this ana-lysis was to investigate the effect of a one-sided selection process based on the statistical significance on the false-positive rate in meta-analysis in situations where publica-tion bias detecpublica-tion methods cannot not identify the bias. All reported estimates are based on 10 000 simulations. The analysis was conducted in R (V.2.15.0). The R code used to perform the simulations is available online (see data sharing statement).
RESULTS
Validity of the mean effect size estimates
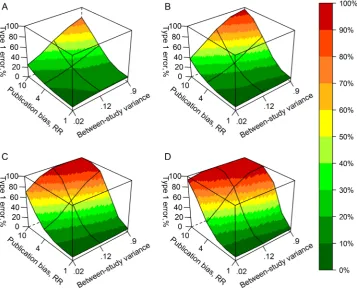
Figure 1 shows the type I error rates for the test of the mean effect size for the range of the level of publication
Figure 1 The effect of a higher probability of inclusion for statistically significant positive outcomes on the type I error rate for the test of the mean effect size in a meta-analysis of (A) 10 studies, (B) 20 studies, (C) 50 studies, (D) 100 studies. RR: the ratio of the probability of including statistically significant positive outcomes to the probability of including negative and/or not
statistically significant outcomes.
on September 22, 2020 by guest. Protected by copyright.
bias and the amount of between-study variability consid-ered in the study. In the presence of a selection process characterised by a higher probability of including statis-tically significant positive results, the meta-analyses fre-quently concluded that the mean effect size differed from zero when it in fact equalled zero. The magnitude of the effect of publication bias increased with an increasing number of studies and the amount of between-study variability. When statistically significant positive results were four times more likely to be included than other results, the type I error rate was between 11% and 100%. When statistically significant positive results were 10 times more likely to be included, between 25% and 100% of the meta-analyses concluded that the mean effect size differed from zero when it in fact equalled 0 (figure 1).
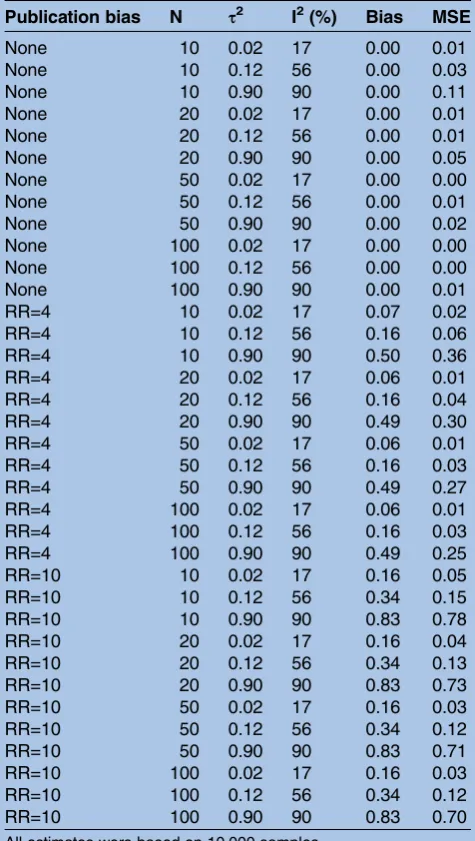
A higher probability of including statistically signifi -cant positive outcomes led to a drastic increase of the bias and the mean squared error, especially when a large between-study variability was present (table 1). When statistically significant positive results were four times more likely to be included than other results and 90% of the variability was due to between-study differ-ences, the random-effects meta-analysis overestimated the mean log-OR approximately by 0.5 on average. When statistically significant positive results were 10 times more likely to be included and the same amount of between-study variability was present, the random-effects meta-analysis overestimated the mean log-OR by 0.83 on average. The mean squared error was especially large when the between-study variability was large (table 1).
Publication bias detection
Next, I investigated whether a one-sided selection process based on the statistical significance (which caused a drastic increase of the false-positive rate of the meta-analyses, as described in the previous section) was detectable by different publication bias methods.
Figure 2shows data from simulations without publica-tion bias (A and B) and simulapublica-tions in which statistically significant positive results were 10 times more likely to Table 1 Validity of estimates of the mean effect size
Publication bias N τ2 I2(%) Bias MSE
None 10 0.02 17 0.00 0.01
None 10 0.12 56 0.00 0.03
None 10 0.90 90 0.00 0.11
None 20 0.02 17 0.00 0.01
None 20 0.12 56 0.00 0.01
None 20 0.90 90 0.00 0.05
None 50 0.02 17 0.00 0.00
None 50 0.12 56 0.00 0.01
None 50 0.90 90 0.00 0.02
None 100 0.02 17 0.00 0.00
None 100 0.12 56 0.00 0.00
None 100 0.90 90 0.00 0.01
RR=4 10 0.02 17 0.07 0.02
RR=4 10 0.12 56 0.16 0.06
RR=4 10 0.90 90 0.50 0.36
RR=4 20 0.02 17 0.06 0.01
RR=4 20 0.12 56 0.16 0.04
RR=4 20 0.90 90 0.49 0.30
RR=4 50 0.02 17 0.06 0.01
RR=4 50 0.12 56 0.16 0.03
RR=4 50 0.90 90 0.49 0.27
RR=4 100 0.02 17 0.06 0.01
RR=4 100 0.12 56 0.16 0.03
RR=4 100 0.90 90 0.49 0.25
RR=10 10 0.02 17 0.16 0.05
RR=10 10 0.12 56 0.34 0.15
RR=10 10 0.90 90 0.83 0.78
RR=10 20 0.02 17 0.16 0.04
RR=10 20 0.12 56 0.34 0.13
RR=10 20 0.90 90 0.83 0.73
RR=10 50 0.02 17 0.16 0.03
RR=10 50 0.12 56 0.34 0.12
RR=10 50 0.90 90 0.83 0.71
RR=10 100 0.02 17 0.16 0.03
RR=10 100 0.12 56 0.34 0.12
RR=10 100 0.90 90 0.83 0.70
All estimates were based on 10 000 samples.
Bias, the average estimate of the mean effect size; MSE, mean squared error.
Figure 2 A funnel plot of simulated data when: (A) the probability of inclusion was the same for all outcomes and a small between-study variability was present (τ2=0.02), (B) the probability of inclusion was the same for all outcomes and a large between-study variability was present (τ2=0.9), (C) statistically significant positive outcomes were 10 times more likely to be included than other outcomes and a small between-study variability was present (τ2=0.02),
(D) statistically significant positive outcomes were 10 times more likely to be included than other outcomes and a large between-study variability was present (τ2=0.9).
on September 22, 2020 by guest. Protected by copyright.
be included than other results (C and D). A visual exam-ination of the funnel plots indicated that a one-sided selection process based on the statistical significance introduced little asymmetry to the funnel plot both when the between-study variability was small (compare
figure 2A, C) and large (compare figure 2B, D). In other words, the funnel plot provided no evidence of publication bias when positive statistically significant results were 10 times more likely to be included than other results.
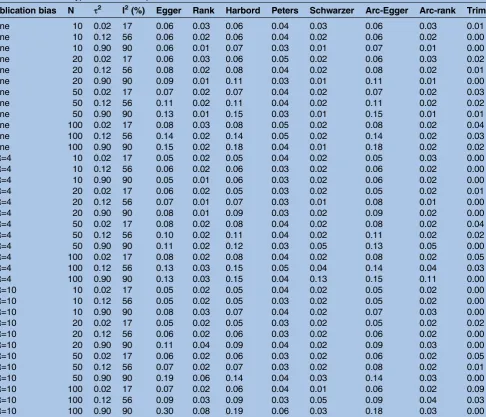
Table 2 gives the proportions of the meta-analyses in which the presence of publication bias was indicated by formal tests. The scenarios with publication bias (RR=4 and RR=10) provide estimates of the power of different tests to detect a one-sided selection process based on the statistical significance. The scenarios without publication bias provide estimates of the type I error rate (the rate at which publication bias was indicated when no publica-tion bias was present). When statistically significant
positive results were four times more likely to be included than other results, all methods indicated the presence of publication bias in not more than 15% of the meta-analyses for all simulation settings (table 2). When statistically significant positive results were 10 times more likely to be included, the power of publica-tion bias detecpublica-tion methods did not exceed 30% for any simulation setting. The type I error rates for the‘Egger’, ‘Harbord’ and ‘Arc-Egger’ tests substantially exceeded 0.05 for some simulation settings, especially when a large between-study variability was present
False-positive rate in meta-analyses in which no publication bias was found
For the completeness of the study, I repeated the investi-gation of the effect of a selection process based on the statistical significance on the type I error rate for the test of the mean effect size using only those samples in which a certain publication bias test did not show
Table 2 Power and type I error rate of publication bias detection methods
Publication bias N τ2 I2(%) Egger Rank Harbord Peters Schwarzer Arc-Egger Arc-rank Trim
None 10 0.02 17 0.06 0.03 0.06 0.04 0.03 0.06 0.03 0.01
None 10 0.12 56 0.06 0.02 0.06 0.04 0.02 0.06 0.02 0.00
None 10 0.90 90 0.06 0.01 0.07 0.03 0.01 0.07 0.01 0.00
None 20 0.02 17 0.06 0.03 0.06 0.05 0.02 0.06 0.03 0.02
None 20 0.12 56 0.08 0.02 0.08 0.04 0.02 0.08 0.02 0.01
None 20 0.90 90 0.09 0.01 0.11 0.03 0.01 0.11 0.01 0.00
None 50 0.02 17 0.07 0.02 0.07 0.04 0.02 0.07 0.02 0.03
None 50 0.12 56 0.11 0.02 0.11 0.04 0.02 0.11 0.02 0.02
None 50 0.90 90 0.13 0.01 0.15 0.03 0.01 0.15 0.01 0.01
None 100 0.02 17 0.08 0.03 0.08 0.05 0.02 0.08 0.02 0.04
None 100 0.12 56 0.14 0.02 0.14 0.05 0.02 0.14 0.02 0.03
None 100 0.90 90 0.15 0.02 0.18 0.04 0.01 0.18 0.02 0.02
RR=4 10 0.02 17 0.05 0.02 0.05 0.04 0.02 0.05 0.03 0.00
RR=4 10 0.12 56 0.06 0.02 0.06 0.03 0.02 0.06 0.02 0.00
RR=4 10 0.90 90 0.05 0.01 0.06 0.03 0.02 0.06 0.02 0.00
RR=4 20 0.02 17 0.06 0.02 0.05 0.03 0.02 0.05 0.02 0.01
RR=4 20 0.12 56 0.07 0.01 0.07 0.03 0.01 0.08 0.01 0.00
RR=4 20 0.90 90 0.08 0.01 0.09 0.03 0.02 0.09 0.02 0.00
RR=4 50 0.02 17 0.08 0.02 0.08 0.04 0.02 0.08 0.02 0.04
RR=4 50 0.12 56 0.10 0.02 0.11 0.04 0.02 0.11 0.02 0.02
RR=4 50 0.90 90 0.11 0.02 0.12 0.03 0.05 0.13 0.05 0.00
RR=4 100 0.02 17 0.08 0.02 0.08 0.04 0.02 0.08 0.02 0.05
RR=4 100 0.12 56 0.13 0.03 0.15 0.05 0.04 0.14 0.04 0.03
RR=4 100 0.90 90 0.13 0.03 0.15 0.04 0.13 0.15 0.11 0.00
RR=10 10 0.02 17 0.05 0.02 0.05 0.04 0.02 0.05 0.02 0.00
RR=10 10 0.12 56 0.05 0.02 0.05 0.03 0.02 0.05 0.02 0.00
RR=10 10 0.90 90 0.08 0.03 0.07 0.04 0.02 0.07 0.03 0.00
RR=10 20 0.02 17 0.05 0.02 0.05 0.03 0.02 0.05 0.02 0.02
RR=10 20 0.12 56 0.06 0.02 0.06 0.03 0.02 0.06 0.02 0.00
RR=10 20 0.90 90 0.11 0.04 0.09 0.04 0.02 0.09 0.03 0.00
RR=10 50 0.02 17 0.06 0.02 0.06 0.03 0.02 0.06 0.02 0.05
RR=10 50 0.12 56 0.07 0.02 0.07 0.03 0.02 0.08 0.02 0.01
RR=10 50 0.90 90 0.19 0.06 0.14 0.04 0.03 0.14 0.03 0.00
RR=10 100 0.02 17 0.07 0.02 0.06 0.04 0.01 0.06 0.02 0.09
RR=10 100 0.12 56 0.09 0.03 0.09 0.03 0.05 0.09 0.04 0.03
RR=10 100 0.90 90 0.30 0.08 0.19 0.06 0.03 0.18 0.03 0.00
All proportions were based on 10 000 samples.
on September 22, 2020 by guest. Protected by copyright.
evidence of publication bias. The aim of this analysis was to study whether a one-sided selection process based on the statistical significance threatened the validity of those meta-analyses where no evidence of publication bias was apparent. For example, meta-analyses were simulated until 10 000 samples were identified in which the‘Egger’test did not show any evidence of publication bias. Next, those samples were used to estimate the rate at which the meta-analysis led to the conclusion that the mean effect size differed from 0 when it actually did not, under a selection process based on the statistical sig-nificance that could not be detected by the‘Egger’test.
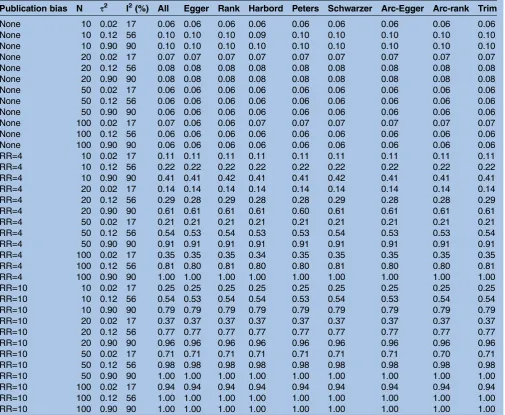
Table 3compares the proportion of meta-analyses incor-rectly showing that the mean effect size differed from zero among all samples (column ‘All’) and among samples where no publication bias was found. There was little difference in the type I error rate for the test of the
mean effect size between the meta-analyses without evi-dence of publication bias and all meta-analyses.
DISCUSSION
The results of these realistic simulations demonstrate that when a one-sided selection process based on the statistical significance is present, the false-positive rate in meta-analysis dramatically increases. The magnitude of the problem increases with an increasing number of studies used and the amount of heterogeneity. When statistically significant positive results were four times more likely to be included in the meta-analyses than other results, the false-positive rate was between 11% and 100%. When statistically significant positive results were 10 times more likely to be included, between 25%
Table 3 Type I error rate for the test for the mean effect size when no evidence of bias was present
Publication bias N τ2 I2(%) All Egger Rank Harbord Peters Schwarzer Arc-Egger Arc-rank Trim
None 10 0.02 17 0.06 0.06 0.06 0.06 0.06 0.06 0.06 0.06 0.06
None 10 0.12 56 0.10 0.10 0.10 0.09 0.10 0.10 0.10 0.10 0.10
None 10 0.90 90 0.10 0.10 0.10 0.10 0.10 0.10 0.10 0.10 0.10
None 20 0.02 17 0.07 0.07 0.07 0.07 0.07 0.07 0.07 0.07 0.07
None 20 0.12 56 0.08 0.08 0.08 0.08 0.08 0.08 0.08 0.08 0.08
None 20 0.90 90 0.08 0.08 0.08 0.08 0.08 0.08 0.08 0.08 0.08
None 50 0.02 17 0.06 0.06 0.06 0.06 0.06 0.06 0.06 0.06 0.06
None 50 0.12 56 0.06 0.06 0.06 0.06 0.06 0.06 0.06 0.06 0.06
None 50 0.90 90 0.06 0.06 0.06 0.06 0.06 0.06 0.06 0.06 0.06
None 100 0.02 17 0.07 0.06 0.06 0.07 0.07 0.07 0.07 0.07 0.07
None 100 0.12 56 0.06 0.06 0.06 0.06 0.06 0.06 0.06 0.06 0.06
None 100 0.90 90 0.06 0.06 0.06 0.06 0.06 0.06 0.06 0.06 0.06
RR=4 10 0.02 17 0.11 0.11 0.11 0.11 0.11 0.11 0.11 0.11 0.11
RR=4 10 0.12 56 0.22 0.22 0.22 0.22 0.22 0.22 0.22 0.22 0.22
RR=4 10 0.90 90 0.41 0.41 0.42 0.41 0.41 0.42 0.41 0.41 0.41
RR=4 20 0.02 17 0.14 0.14 0.14 0.14 0.14 0.14 0.14 0.14 0.14
RR=4 20 0.12 56 0.29 0.28 0.29 0.28 0.28 0.29 0.28 0.28 0.29
RR=4 20 0.90 90 0.61 0.61 0.61 0.61 0.60 0.61 0.61 0.61 0.61
RR=4 50 0.02 17 0.21 0.21 0.21 0.21 0.21 0.21 0.21 0.21 0.21
RR=4 50 0.12 56 0.54 0.53 0.54 0.53 0.53 0.54 0.53 0.53 0.54
RR=4 50 0.90 90 0.91 0.91 0.91 0.91 0.91 0.91 0.91 0.91 0.91
RR=4 100 0.02 17 0.35 0.35 0.35 0.34 0.35 0.35 0.35 0.35 0.35
RR=4 100 0.12 56 0.81 0.80 0.81 0.80 0.80 0.81 0.80 0.80 0.81
RR=4 100 0.90 90 1.00 1.00 1.00 1.00 1.00 1.00 1.00 1.00 1.00
RR=10 10 0.02 17 0.25 0.25 0.25 0.25 0.25 0.25 0.25 0.25 0.25
RR=10 10 0.12 56 0.54 0.53 0.54 0.54 0.53 0.54 0.53 0.54 0.54
RR=10 10 0.90 90 0.79 0.79 0.79 0.79 0.79 0.79 0.79 0.79 0.79
RR=10 20 0.02 17 0.37 0.37 0.37 0.37 0.37 0.37 0.37 0.37 0.37
RR=10 20 0.12 56 0.77 0.77 0.77 0.77 0.77 0.77 0.77 0.77 0.77
RR=10 20 0.90 90 0.96 0.96 0.96 0.96 0.96 0.96 0.96 0.96 0.96
RR=10 50 0.02 17 0.71 0.71 0.71 0.71 0.71 0.71 0.71 0.70 0.71
RR=10 50 0.12 56 0.98 0.98 0.98 0.98 0.98 0.98 0.98 0.98 0.98
RR=10 50 0.90 90 1.00 1.00 1.00 1.00 1.00 1.00 1.00 1.00 1.00
RR=10 100 0.02 17 0.94 0.94 0.94 0.94 0.94 0.94 0.94 0.94 0.94
RR=10 100 0.12 56 1.00 1.00 1.00 1.00 1.00 1.00 1.00 1.00 1.00
RR=10 100 0.90 90 1.00 1.00 1.00 1.00 1.00 1.00 1.00 1.00 1.00
The column‘All’shows the type I error rates for the test for the mean effect size based on all samples. The remaining columns show the type I error rates based on meta-analyses, in which no publication bias was detected by the test in the column heading.
on September 22, 2020 by guest. Protected by copyright.
and 100% of the meta-analyses wrongly concluded that the mean effect size differed from zero.
Publication bias tests based on the funnel plot were unlikely to detect a publication bias of a sufficient mag-nitude to frequently overturn the meta-analytic conclu-sions. For example, when statistically significant positive results were four times more likely to be included and a large between-study variability was present, more than 90% of the meta-analyses of 50 and 100 studies wrongly concluded that the mean effect size differed from zero. In the same scenario, all publication bias tests based on the funnel plot detected the bias at rates not exceeding 15%. The power of the tests did not exceed 30% for any simulation settings. In general, the Egger’s test,34 the modified Egger’s test based on the efficient score28 and the Egger’s test based on the arcsine transformation38 showed the highest power. However, the type I error rate of these tests substantially exceeded 0.05, especially when a large between-study variability was present.
Many selection processes are known to introduce a considerable amount of asymmetry to the funnel plot. For example, when studies with most extreme negative effect estimates fail to enter a meta-analysis, a test based on the R estimator from the trim and fill method pro-vides a powerful tool to detect this bias.39 In addition to the type of selection process, the mean effect size also determines the performance of publication bias detec-tion methods. Several studies considering different selec-tion processes have observed that tests based on the funnel plot are characterised by a low power when the mean effect size equals zero.26 41 The current study shows that this is also the case for a one-sided publica-tion bias based on the statistical significance.
A higher probability of including statistically signifi -cant positive results caused a large increase of the type I error rate for the test of the mean effect size also in those meta-analyses, where publication bias tests did not detect the bias. This result demonstrates that under-reporting of negative and non-significant results is also a threat to the validity of those meta-analyses where publi-cation bias cannot be found by the methods based on the funnel plot.
The most common approaches to address publication bias in a meta-analysis include ignoring the issue and applying methods based on the funnel plot.35 The current study demonstrates that when a one-sided publi-cation bias based on the statistical significance is possibly present, the issue should never be ignored because this bias causes a severe increase of the false-positive rate in meta-analysis. Moreover, the study shows that the methods based on the funnel plot are not appropriate to address the problem because a selection process based on the statistical significance introduces little asymmetry to the funnel plot when the mean-effect size equals zero. Parametric16 42 43 and non-parametric44 45 selection models may be an attractive alternative to the methods based on the funnel plot. In a recent study with settings based on characteristics of large
meta-analyses from major medical journals, a Bayesian hierarchical selection model outperformed methods based on the funnel plot.16 Future research should compare the performance of different selection models and methods based on the funnel plot in a wider range of scenarios. Selection models were not considered in this study because their relatively large computational burden made it impossible to incorporate them in the simulations, which involved analysing hundreds of thou-sands of samples.
Many recent developments enhance complete and unbiased reporting of clinical trials. The International Committee of Medical Journal Editors began to require trial registration as a condition for publication in 2005. In 2008, the 59th World Medical Association (WMA) General Assembly stated that clinical trials must be regis-tered prospectively and called a public disclosure of posi-tive, negative and inconclusive results an author’s duty. The results of this study add to the evidence that publi-cation bias is a major threat to the validity of conclusions from medical research and strongly support the useful-ness of the efforts to limit publication bias.
CONCLUSIONS
Under-reporting of negative and inconclusive results, which was demonstrated by studies on publication bias, represents a major threat to the validity of meta-analysis. A higher probability of including statistically significant positive outcomes causes a severe increase of the false-positive rate in meta-analysis. Moreover, a one-sided selection process based on the statistical significance of a sufficient magnitude to dramatically bias meta-analysis conclusions is poorly detectable by publication bias methods based on the funnel plot when the mean effect size equals 0. Future research is needed to compare the performance of these methods with selection models. The study supports the usefulness of initiatives aiming to reduce publication bias in the medical literature.
Funding This research received no specific grant from any funding agency in the public, commercial or not-for-profit sectors. MK is a PhD fellow at the Research Foundation-Flanders (FWO).
Competing interests None.
Provenance and peer review Not commissioned; externally peer reviewed.
Data sharing statement The R code that was used to perform the simulations is available on figshare at: http://www.dx.doi.org/10.6084/m9. figshare.1119702.
Open Access This is an Open Access article distributed in accordance with the Creative Commons Attribution Non Commercial (CC BY-NC 3.0) license, which permits others to distribute, remix, adapt, build upon this work non-commercially, and license their derivative works on different terms, provided the original work is properly cited and the use is non-commercial. See: http:// creativecommons.org/licenses/by-nc/3.0/
REFERENCES
1. Rosenthal R. File drawer problem and tolerance for null results. Psychol Bull1979;86:638–41.
on September 22, 2020 by guest. Protected by copyright.
2. Chalmers L. Underreporting research is scientific misconduct.JAMA 1990;263:1405–8.
3. Dickersin K. The existence of publication bias and risk factors for its occurrence.JAMA1990;263:1385–9.
4. Normand SL. Meta-analysis: formulating, evaluating, combining, and reporting.Stat Med1999;18:321–59.
5. Borenstein M, Hedges L, Higgins JP,et al.Introduction to meta-analysis. West Sussex, England: Wiley & Sons, 2009. 6. Cooper H.Research synthesis and meta-analysis. Los Angeles, CA:
Sage, 2010.
7. Rothstein H, Sutton A, Borenstein M.Publication bias in
meta-analysis: prevention, assessment and adjustments. Chichester, West Sussex: Wiley, 2005.
8. Ahmed I, Sutton AJ, Riley RD. Assessment of publication bias, selection bias, and unavailable data in meta-analyses using individual participant data: a database survey.BMJ2012;344:d7762. 9. Kirkham JJ, Dwan KM, Altman DG,et al. The impact of outcome
reporting bias in randomised controlled trials on a cohort of systematic reviews.BMJ2010;340:c365.
10. Nuesch E, Trelle S, Reichenbach S,et al. Small study effects in meta-analyses of osteoarthritis trials: meta-epidemiological study. BMJ2010;341:c3515.
11. Zhang Z, Xu X, Ni H. Small studies may overestimate the effect sizes in critical care meta-analyses: a meta-epidemiological study. Crit Care2013;17:R2.
12. Dwan K, Altman DG, Arnaiz JA,et al. Systematic review of the empirical evidence of study publication bias and outcome reporting bias.PLoS ONE2008;3:e3081.
13. Song F, Parekh-Bhurke S, Hooper L,et al. Extent of publication bias in different categories of research cohorts: a meta-analysis of empirical studies.BMC Med Res Methodol2009;9:79. 14. Decullier E, Lheritier V, Chapuis F. Fate of biomedical research
protocols and publication bias in France: retrospective cohort study. BMJ2005;331:19–22.
15. Lee K, Bacchetti P, Sim I. Publication of clinical trials supporting successful new drug applications: a literature analysis.PLoS Med 2008;5:e191.
16. Kicinski M. Publication bias in recent meta-analyses.PLoS ONE 2013;8:e81823.
17. Hedges LV. Estimation of effect size under nonrandom sampling: the effects of censoring studies yielding statistically insignificant mean differences.J Educ Stat1984;9:61–85.
18. Hedges L, Vevea J. Estimating effect size under publication bias: small sample properties and robustness of a random effects selection model.J Educ Behav Stat1996;21:299–332. 19. Moreno S, Sutton A, Ades AE,et al. Assessment of
regression-based methods to adjust for publication bias through a comprehensive simulation study.BMC Med Res Methodol 2009;9:2–18.
20. Peters JL, Sutton AJ, Jones DR,et al. Performance of the trim and fill method in the presence of publication bias and between-study heterogeneity.Stat Med2007;26:4544–62.
21. Ioannidis JA, Cappelleri JC, Lau J. Issues in comparisons between meta-analyses and large trials.JAMA1998;279:1089–93. 22. LeLorier J, Gregoire G, Benhaddad A,et al. Discrepancies between
meta-analyses and subsequent large randomized, controlled trials. N Engl J Med1997;337:536–42.
23. Nuesch E, Juni P. Commentary: which meta-analyses are conclusive?Int J Epidemiol2009;38:298–303.
24. Villar J, Carroli G, Belizan JM. Predictive ability of meta-analyses of randomised controlled trials.Lancet1995;345:772–6.
25. Egger M, Smith G. Misleading meta-analysis.BMJ1995;310:752–4. 26. Peters J, Sutton A, Jones D,et al. Comparison of two methods
to detect publication bias in meta-analysis.JAMA2006;295: 676–80.
27. Davey J, Turner RM, Clarke MJ,et al. Characteristics of meta-analyses and their component studies in the Cochrane Database of Systematic Reviews: a cross-sectional, descriptive analysis.BMC Med Res Methodol2011;11:160.
28. Harbord RM, Egger M, Sterne JA. A modified test for small-study effects in meta-analyses of controlled trials with binary endpoints. Stat Med2006;25:3443–57.
29. Macaskill P, Walter SD, Irwig L. A comparison of methods to detect publication bias in meta-analysis.Stat Med2001;20:641–54. 30. Turner RM, Davey J, Clarke MJ,et al. Predicting the extent of
heterogeneity in meta-analysis, using empirical data from the Cochrane Database of Systematic Reviews.Int J Epidemiol 2012;41:818–27.
31. Higgins JP, Thompson SG. Quantifying heterogeneity in a meta-analysis.Stat Med2002;21:1539–58.
32. Turner EH, Matthews AM, Linardatos E,et al. Selective publication of antidepressant trials and its influence on apparent efficacy. N Engl J Med2008;358:252–60.
33. Sterne JA, Sutton AJ, Ioannidis JP,et al. Recommendations for examining and interpreting funnel plot asymmetry in meta-analyses of randomised controlled trials.BMJ2011;343:d4002.
34. Egger M, Smith G, Schneider M,et al. Bias in meta-analysis detected by a simple, graphical test.BMJ1997;315:629–34. 35. Song F, Parekh S, Hooper L,et al. Dissemination and publication of
research findings: an updated review of related biases.Health Technol Assess2010;14:iii, ix–iii, 1–193.
36. Begg C, Mazumdar M. Operating characteristics of a rank correlation test for publication bias.Biometrics1994;50:1088–101.
37. Schwarzer G, Antes G, Schumacher M. A test for publication bias in meta-analysis with sparse binary data.Stat Med 2007;26:721–33.
38. Rucker G, Schwarzer G, Carpenter J. Arcsine test for publication bias in meta-analyses with binary outcomes.Stat Med
2008;27:746–63.
39. Duval S, Tweedie R. Trim and fill: a simple funnel-plot-based method of testing and adjusting for publication bias in meta-analysis. Biometrics2000;56:455–63.
40. Thorlund K, Wetterslev J, Awad T,et al. Comparison of statistical inferences from the DerSimonian−Laird and alternative random-effects model meta-analyses—an empirical assessment of 920 Cochrane primary outcome meta-analyses.Res Synth Methods 2011;2:238–53.
41. Kromney J, Rendina-Gobioff G. On knowing what we do not know: an empirical comparison of methods to detect publication bias in meta-analysis.Educ Psychol Meas2006;66:357–73.
42. Hedges LV. Modeling publication selection effects in meta-analysis. Stat Sci1992;7:246–55.
43. Silliman N. Hierarchical selection models with applications in meta-analysis.J Am Stat Assoc1997;92:926–36.
44. Dear K, Begg C. An approach for assessing publication bias prior to performing a meta-analysis.Stat Sci1992;7:237–45.
45. Rufibach K. Selection models with monotone weight functions in meta analysis.Biom J2011;53:689–704.
on September 22, 2020 by guest. Protected by copyright.